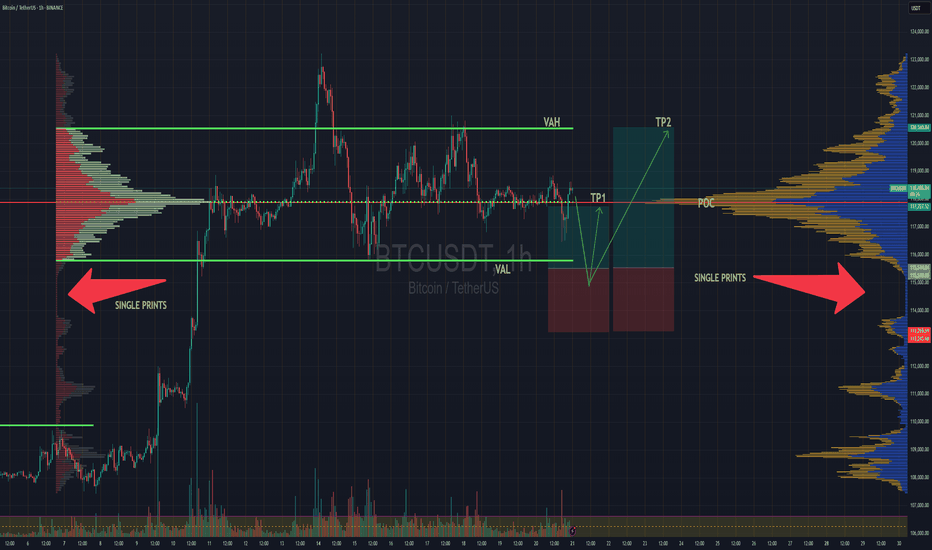
Consolidationzone
key performance of sentiment cycle indicatorI couldn’t resist sharing this idea again because the performance of the Sentiment Cycle Indicator continues to impress, as demonstrated by the latest chart. This post follows up on the idea I shared yesterday, showcasing the indicator’s ability to identify price manipulation and avoid market traps.
Let me explain: Around midnight on Wednesday (yesterday at 00:00 hours), the market was in a sideways phase. The indicator briefly signaled a buy, followed by a small sell signal, before going sideways again. Later, it gave a sell signal, and after another sideways period, it returned to sell mode. What’s remarkable is how accurately the indicator identifies these phases, guiding you through periods of low volume and reduced market activity.
• The Red and Green Backgrounds: These represent clear buy and sell signals, helping traders act with confidence.
• No green/red background or Plain chart: This signify sideways markets, where no significant signals are detected, helping traders avoid over-trading or entering low-probability trades. (highlighted in blue line border box)
Notice the two marked blue areas—these are prime examples of how the indicator detects manipulative sideways phases, keeping you out of risky trades. It lets you stay disciplined by waiting for confirmed buy or sell signals, avoiding unnecessary losses.
Additionally:
• Stop-Loss Options: The indicator allows you to set your stop-loss either on the same candle or the previous one, giving you flexibility in trade management.
• Small and Precise Signals: The indicator generates accurate signals with minimal noise, helping you enter trades with confidence and tighter risk management.
This is a perfect demonstration of how this tool not only gives high-probability buy and sell signals but also helps you understand market manipulation and avoid common traps. Whether you’re an experienced trader or a beginner, this indicator offers clarity and structure in your decision-making process.
Give it a try—you’ll see how effective it is in helping you trade smarter and avoid over-trading!
USDJPY new bullish for expect
FX:USDJPY trend based analysis, we having in period from 1.12 - 9.12 ROUNDED BOTTOM pattern visible, price is make break of same and confirmation of same (yellow line) and its make short bullish push, currently price in consolidation, its on strong ex. zone 151.800 (violet line).
What here expecting after todays and past events in this week, still looks like we will have strong USD and here exepcting to see new bullish push.
SUP zone:151.450
RES zone:154.550, 155.050
GBPNZD bearish expectations
GBPNZD price is make two strong bullish pushes from 4.Oct. currently DESCENDING CHANNEL visible, price is make bearish bounce on strong zone 2.16600.
Expecting this point now is exhaustion and expectations are to see higher bearish continuation from here
SUP zone: 2.17000
RES zone: 2.14700, 2.14100
NZDCAD pattern based analysis
NZDCAD strong structure of FALLING WEDGE pattern. We are have and RBA on 6.11 which is have positive impact on AUD and on NZD.
AUDCAD we can see strong bullish pushing from start of week, here same on NZDCAD expecting higher bullish trend.
SUP zone: 0.82700
RES zone: 0.84750, 0.85200
Palantir will move after earnings so hold tight ! As long as Palantir remains within the upward channel, it’s still in play!
There’s an imbalance guiding the price, preventing it from dropping. We’ve seen the price attempt to go up twice already, so as long as Palantir stays within the channel and respects the imbalance, I’m quite confident it will make a third attempt to break the high.
On the other hand...
We have the earnings report coming up Monday pre-market, so whatever happens at the open, we’ll know which direction the price will take based on the report’s results.
Keep a close eye on this!
Best regards.
EURAUD may now go upside!EURAUD may now go upside!
EURAUD price touching the support and taking upward momentum from support frequently. its time to open the buy position because price is at resistance zone.
Resistance is between 1.6845 and 1.6724.
Support is between 1.6072 and 1.5938.
Entry Point:- 1.61269
Take Profit:- 1.64271
Stop loss :- 1.58266
Google Still Bullish but nothing to see yet till Earnings ReportGoogle is clinging to this stagnant channel (yellow color), but the question is:
Could this be an accumulation before their earnings report?
We are one week away from Google's earnings report, and I have a feeling that the price will simply continue to trade within the same range until a few days before the report. Let's say on Friday or Monday, we may see a strong and sudden move. This is due to the "insiders," those privileged individuals within the company who hold positions and know what the price movement will be on the day of the report based on information they can access before the expected date.
We just need to keep in mind that we are still in a congested sideways channel, and this channel may expand as the days leading up to the report approach.
There's really not much to see with Google at the moment.
Best regards, and thank you for supporting my analysis.
SWING IDEA - CHOLAHLDNGStock has been under consolidation since 6 months.
MACD Cross seems to be in play. But has tried crossing since 3 months now.
Lets wait for the MACD Cross to happen successfully and the consolidation could complete around same time.
Stock has been having multiple good Earnings. This should definitely take it to new highs.
Keep a close eye.
TASI: At Resistance_Sideways ExpectedTASI is receiving resistance from 12,325 level (a significant level).
Gap up opening was filled yesterday and the downtrend continues after taking correction from the specified resistance level (12,325).
Profit booking due to Week and Month closure will also drag the index down further to the levels of 12,000.00 (A significant/psychological support level).
It is expected that the price may remain sideways for a while between these two levels 12,000 to 12,325 (a good sign to build up foundation for further upside movement).
On weekly timeframe, price is moving in the same way (flipped) as in recent past.
Watchout for September events in US market.
Overall, We are Bullish on TASI.
Trade individual stocks with proper risk management.
Happy Trading!
META daily channel is getting tight.NASDAQ:META daily chart shows consolidation and has a lot of room to supply above recent highs, should the daily 5 SMA confirm to the upside. Watching closely to see which way this consolidation resolves, as there are always a million opinions, but only one confirmation.
XRP doubts for long positionI am trying to create a plan for XRP. As far as I know, this cryptocurrency carries a high level of risk. However, the chart appears to be very bullish to me after a prolonged period of consolidation. My strategy is to wait for it to reach one of the current fair value gaps on either the 4-hour or daily timeframe, and then make a move. XRP has already formed a swing low, so I anticipate a new swing high to be reached soon. BINANCE:XRPUSDT
Just A View - VBL 📊 Script: VBL
📊 Sector: FMCG
📊 Industry: Food - Processing - Indian
Key highlights: 💡⚡
📈 Script is trading in consolidation zone since last few trading session.
📈 Script has to give breakout or breakdown to came put of consolidation zone.
📈 For breakout script has to give closing above 1644, and for breakout script has to give closing below 1578
KEEP AN EYE ON STOCK
⚠️ Important: Always maintain your Risk & Reward Ratio.
✅Like and follow to never miss a new idea!✅
Disclaimer: I am not SEBI Registered Advisor. My posts are purely for training and educational purposes.
Eat🍜 Sleep😴 TradingView📈 Repeat 🔁
Happy learning with trading. Cheers!🥂
Bitcoin Must Show Decisive in its Move before im excitedHi guys. So i posted recently some crypto related stock ideas. I felt like i should do a BTC update as they are directly related. When BTC goes up, all related crypto assets move up.
So lets jump right in.
This is a 1 week analysis.
So we have established a consolidation range. Consolidation ranges is just a price range between which an asset moves up and down in.
The key is to observe a confirmation of a breakout either ABOVE or BELOW it.
The Key lvls are:
1. $61,000 as support
2. $71,000 as Resistance
FOr our Bull market to continue and move into the final supercycle phase of the crypto market we need a DECISIVE BREAK ABOVE 71,000.
This will in a short time print a blowoff top and end Bull market.
I have up a bunch of Moving averages in different colors.
What i'd love to see is from ascending order:
Purple 1st
Green 2nd
Blue 3rd
Red at the bottom
This order signifies that a Bull market is going on.
STOCH RSI has also crossed BUllish above the 20 lvl. If you look left, everytime we've done so We've moved higher.
_________________________________________________________________________________
Thank you for taking the time to read my analysis. Hope it helped keep you informed. Please do support my ideas by boosting, following me and commenting. Thanks again.
Stay tuned for more updates on BTC in the near future.
If you have any questions, do reach out. Thank you again.
DISCLAIMER: This is not financial advice, i am not a financial advisor. The thoughts expressed in the posts are my opinion and for educational purposes. Do not use my ideas for the basis of your trading strategy, make sure to work out your own strategy and when trading always spend majority of your time on risk management strategy.
COINbase Macro Analysis: To Keep You Informed Of OpportunityHi Guys! As always i try to bring ideas that catch my attention on the macro timeframes. The one that got my attention is Coinbase (COIN). Ive been tracking coinbase for some time now, ever since i discovered the Inverse Head and Shoulders pattern. (Ill be putting the link to that idea and others related to COIN below.
This current analysis will be assessing whether or not the Inverse head and shoulders pattern has more juice left or not in continuing the rally from the bottom at $31.00.
Pattern was confirmed when we broke the Head & Shoulders neckline.
This analysis is on the 1 week timeframe.
Some areas have been highlighted.
Major Resistance -> this is a critical area in my opinion, further gains being linked to us needing price to be ABOVE this lvl.
We are currently BELOW it.
But have not yet confirmed in my opinion.
Last weeks candle had equal top/bottom wicks, which usually means buyers and sellers were equaled out, not giving a direction.
We would need next week to play out in a more decisive manner. And for price to be ABOVE Major Resistance lvl.
We are also current ABOVE 21 EMA, as long as we stay ABOVE it, UPtrend is intact.
We've also had 2 Golden Crosses occur where 21 EMA and 50 SMA crossed ABOVE 100 SMA. As long as we stay crossed Uptrends tend to continue.
Ive also applied FIB retracement lvls from our current top to the bottom at $31.
We've been rejected from 0.786 lvl. Watch for a test of the 0.618 level which is known as the Golden Ratio. If 21 EMA is broken, it becomes more probable.
My personally opinion is that i think we will touch the 0.618 lvl.
We would need to maintain Support ABOVE here.
This area also coincides with a potential Consolidation range bottom.
Which I think is likely to be forming, as COIN tends to move like this as seen in previous history.
__________________________________________________________________________________
Thank you for taking the time to read my analysis. Hope it helped keep you informed. Please do support my ideas by boosting, following me and commenting. Thanks again.
Stay tuned for more updates on SNOW in the near future.
If you have any questions, do reach out. Thank you again.
DISCLAIMER: This is not financial advice, i am not a financial advisor. The thoughts expressed in the posts are my opinion and for educational purposes. Do not use my ideas for the basis of your trading strategy, make sure to work out your own strategy and when trading always spend majority of your time on risk management strategy.