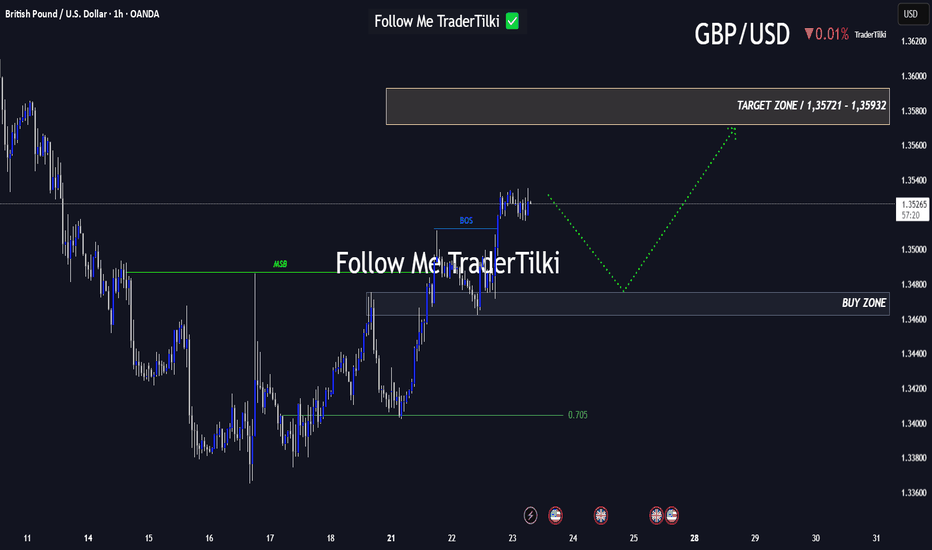
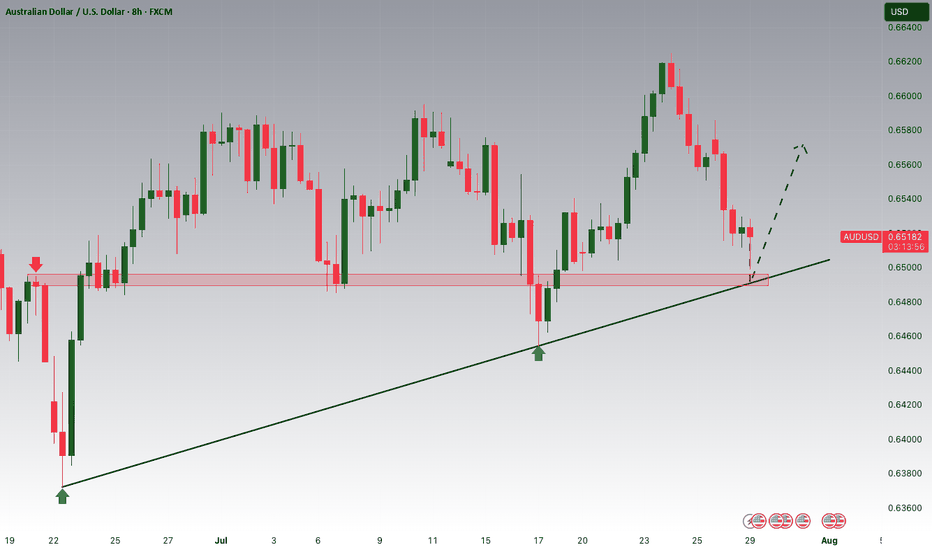
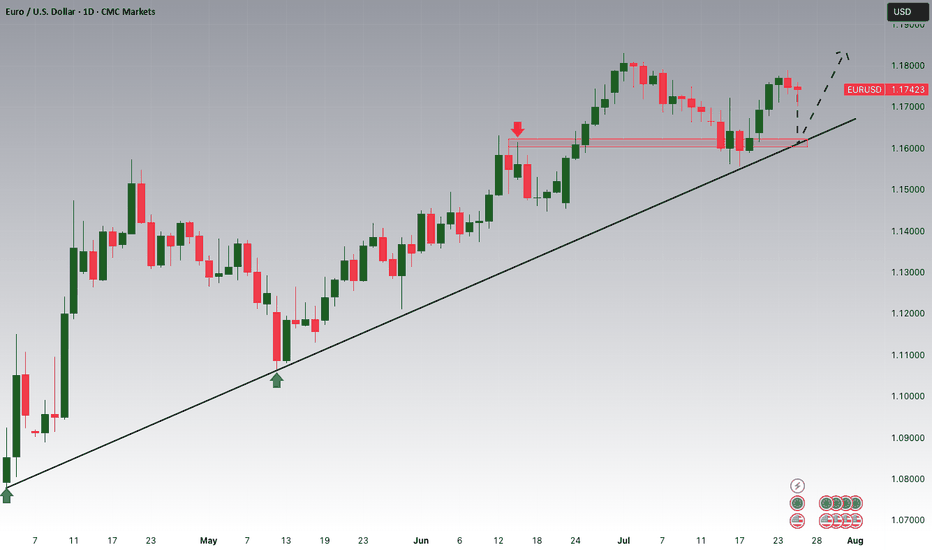
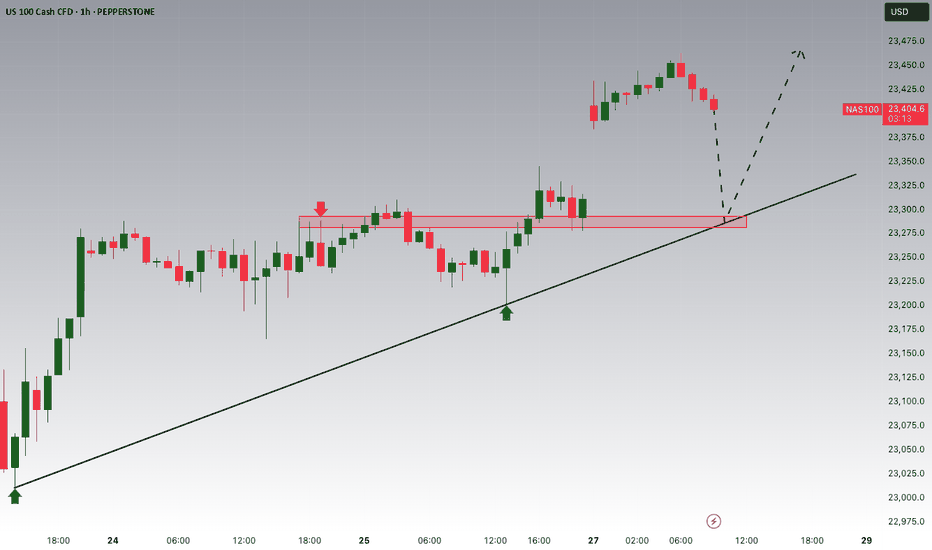
GbpUsd- Back above 1.3?In my previous GBP/USD analysis, I highlighted the important 1.2850 support zone.
Yesterday, the pair fell below this support; however, sellers couldn't push the price down significantly, and a strong floor was found at 1.28.
The recent drop from above 1.3 appears corrective in nature, overlapping and resembling a falling wedge with a false break below support.
Considering yesterday's price action, I anticipate a reversal.
Confirmation of this reversal comes if GBP/USD moves above 1.2870. In that case, we can consider 1.28 a low and expect the price to continue rising back above 1.3.
Containsimagine
Nasdaq could test the broken neck line levelLast week, the Nasdaq broke below the neckline of a head and shoulders (H&S) pattern, which took over a month to form. The price quickly accelerated to the downside, dropping almost 800 points.
However, once the price approached the rising trend line of the channel (a channel that has kept the price elevated for the past nine months), buyers entered the market, and now the Nasdaq 100 is trading back above 19,000.
This recovery could continue in the coming days, and a test of the broken support level is likely.
Looking further ahead to the medium term, if the price reverses from that level and drops below 19,000 once more, a break below the support line of the channel becomes probable, potentially leading to a deep correction.
For now though, as long as 18,700 remains intact, the bulls hold the upper hand.
Buy Dogecoin (DOGE) at $0.12724I recommend buying Dogecoin (DOGE) at $0.12724. This recommendation is based on the Smart Money Concept (SMC), which identifies a "Demand Zone" at this price level and a Fair Value Gap (FVG) above the demand zone.
Key Points:
Entry Price:
Buy Dogecoin at $0.12724. This price level has been identified as an optimal entry point due to the presence of a demand zone and an FVG.
Explanation of FVG:
Fair Value Gap (FVG): An FVG occurs when there is a significant price movement with little or no trading activity in between, creating a gap. This gap represents an imbalance in the market, often caused by institutional investors, and can act as a magnet for price, providing an area of potential support or resistance.
Stop Loss (SL):
Set your stop loss (SL) at $0.12502, which is just under the FVG. This level has been chosen to minimize potential losses if the market moves against the trade. The stop loss percentage is 1.74%.
Take Profit (TP):
Set your take profit (TP) at $0.13822, which aligns with a supply zone. This target has been chosen based on market dynamics and anticipated resistance levels.
Explanation:
Smart Money Concept (SMC):
SMC is a trading strategy that focuses on understanding and following the actions of institutional investors, who have significant influence on the market. By identifying areas where these large players are likely to buy (demand zones) or sell (supply zones), traders can align their positions with the "smart money" to improve their chances of success.
Demand Zone:
A demand zone is an area on the chart where there has been a high level of buying interest, causing prices to rise from that level in the past. When the price returns to this zone, it is likely to encounter buying pressure again, providing a potential entry point for traders.
Supply Zone:
A supply zone is an area on the chart where there has been significant selling interest in the past, which may act as a resistance level.
Conclusion:
Entering Dogecoin at $0.12724, based on the SMC and the identified demand zone and FVG, presents a strategic investment opportunity. By setting a stop loss at $0.12502, we aim to manage risk effectively, and by setting a take profit at $0.13822, we target a supply zone for potential gains.
As always, it's essential to monitor the market closely and adjust your strategy as necessary. Trading involves risks, and it's crucial to stay informed and make decisions based on thorough analysis. Like, follow me for more such content and share to increase your friends' knowledge.
DXY- False break and strong reversal ahead?
Last week, the DXY broke below important horizontal support.
However, the next day, the index reversed its losses, followed by a bullish candle on Friday.
This created a strong reversal candle on our weekly chart, making us wonder if the initial break was false.
Now, the index is consolidating above this important horizontal support.
A break above the current lateral consolidation could lead to an upward acceleration.
Typically, after a false break, the asset moves in the opposite direction to test the next significant level.
For the DXY, this sets a target in the 1.0650 zone.
SPX broke the trend line with a gap. Time to sell rallies?Since April, the SPX has risen around 15%, and since November's low, it has increased by almost 40%.
This is quite significant for such an index, making us wonder if this rise is fundamentally justified (in my opinion, it is not).
But, as they say, "trade what you see, not what you think".
What we saw was a strong upward move.
However, keeping this expression in mind, we also observed a breakdown with a gap yesterday, which was not filled during the day, indicating a "gap and run."
My preferred strategy for the index is to sell on eventual rallies above 5500, with a target at 5250.
This strategy would be negated by a new all-time high (ATH).
EurAud- Important break could lead to 1k pips riseAfter a recent dip to the 1.6 zone and a period of consolidation, the EUR/AUD has reversed strongly over the past two weeks, leading to a significant breakout.
As shown in the chart, following an initial upward movement lasting about a year, the pair corrected and consolidated within a falling wedge pattern for another year.
Currently, we see a clear breakout above the falling wedge's resistance, which could lead to a rise of approximately 1,000 pips in the medium to long term.
Swing and positional traders might consider buying on any dips around 1.64, aiming for a target of 1.75, while keeping the interim resistance and falling wadge's target at 1.7 in mind.
Bitcoin- The Good, The Bad and The UglyAs I mentioned in my previous posts, I am bullish on Bitcoin and expected a break above $71,000 with a rise to at least $85,000.
However, I always consider multiple scenarios.
In this post, I want to discuss all the potential outcomes I foresee.
The Good Scenario:
As shown in the chart, although the price dropped again from the all-time high resistance, the bulls have strongly defended the $67,000 support level that I've been emphasizing. If the price recovers and reaches the resistance level again, it is likely to break above, targeting at least $85,000.
The Bad Scenario:
In this scenario, the bulls fail to defend the $67,000 support zone. If this happens, the price will likely drop to the $60,000 zone.
The Ugly Scenario:
In this scenario, all the price action since mid-March could be viewed as a long distribution phase. If Bitcoin also loses the $60,000 support, we could see a significant decline, potentially down to around $45,000.
Alikze »» ENA | Pullback to broken structureIn time 1D and 8H, it has faced demand after supporting in the golden zone.
💎 According to the momentum and upward guard, if it is issued in the 8H period after meeting with the pullback trigger line to the golden limit, it can continue to grow up to the Fibo range of 0.78 after the support in the first step, and then this growth can continue up to the supply area. slow down
💎 Alternative scenario: if the golden zone and the range of 0.68 are broken, the correction can extend up to the range of 0.58 and the green box.
»»»«««»»»«««»»»«««
Please support this idea with a LIKE and COMMENT if you find it useful and Click "Follow" on our profile if you'd like these trade ideas delivered straight to your email in the future.
Thanks for your continued support.
Sincerely.❤️
»»»«««»»»«««»»»«««
Gold- Real break under 2300 this week?As you know, I have been bearish on gold for more than two weeks now.
Not only has this opinion remained unchanged, but it has also been reinforced by last week's price action.
As seen in the posted chart, after dropping below the 2300 zone, gold started a normal correction.
Importantly, last week, we experienced a false break above the 2340 resistance, resulting in a strong bearish engulfing pattern on our daily chart.
The week closed exactly on the ascending trend line of the correction that started after the 2385 low, and now the price is in a normal rebound.
This rebound could give us an opportunity to open short trades against last week's high.
For short-term targets, 2385 could be a good point for booking profits.
However, I am convinced that, after a clear break below 2300, gold will drop significantly and reach the 2200 zone.
Gold- Correction over, 1k pips drop next?As I mentioned in my analysis yesterday, I anticipate a significant drop in gold prices once the current correction ends.
As expected, the price broke above the 2320 local resistance, creating a new upward correction leg. It then reversed from 2341, giving me a precise short entry.
The candlestick pattern since Friday has formed a "bearish mat hold pattern," suggesting a continued downward trend. At the time of writing, gold is trading at 2314, below the 2320 zone, which has recently acted as both support and resistance. This adds to the bearish outlook.
Confirmation of a lower high will come with a drop below the 2300 psychological level. If this happens, the technical support at 2285 will be exposed.
Furthermore, if there is a new drop to this technical support, I expect it to break, leading gold to fall to the 2250 zone initially.
DOGE-USDT | 4H | TECHNICAL CHART Hello traders, BINANCE:DOGEUSDT I have determined the formation target on the chart. I wish everyone success.
Like and comment if you find value in our analysis.
Feel free to post your ideas and questions at the comments section.
PS: Thank you very much that you support me with your likes and Comments
If you have another analysis at this pair, please share in comments, I will be glad to discuss with you.
Tonyfx | XAUUSD potential LONG from the DEMANDXAUUSD is approaching a DAILY VALIDATION POINT identified with a yellow line in 2018.590. We can also see that the price is inside a FOUR-HOURS DEMAND ZONE, possibly LONGS from the demand after we get a CHOC, spot SOS and RTO to the discount price orders are filled.
TARGET is psychological level 2050.
Double Bottom - AUHere I have AUD/USD on the 1Hr Chart with what looks to be a Double Bottom Pattern!
We were given a Higher High then the one on Tuesday which was preceded by a Lower Low late on Wednesday!
Following the negative news on the Consumer Debt Today and with Non-Farm Employment, Unemployment Rate and Average Hourly Earnings Tomorrow, I will be looking for Price to retrace a little lower testing our EMA Spread, finding Support, then going HIGHER!
*It's important to observe the Intensity of how Price Action revisits our area! Updates will be made.
I also see the RSI giving us quite a Strong Divergence which strengthens my Bullish Bias!
*TRADING INVOLVES RISK! DO NOT TRADE WHAT YOU DO NOT UNDERSTAND OR HAVE NOT TESTED BEFORE! THIS IS NOT TRADING ADVICE. EDUCTIONAL PURPOSES ONLY!*
-Pattern CONFIRMED by Higher High Break
-BUY-
{ SL } .65520
{ ENTRY } .65838 - .65782
{ TP } .66520