Gold: Breakout and Potential retraceHey Traders, in today's trading session we are monitoring XAUUSD for a selling opportunity around 3,340 zone, Gold was trading in an uptrend and successfully managed to break it out. Currently is in a correction phase in which it is approaching the retrace area at 3,340 support and resistance area.
Trade safe, Joe.
Containsimagine

USOIL Potential UpsidesHey Traders, in tomorrow's trading session we are monitoring USOIL for a buying opportunity around 72.00 zone, USOIL is trading in an uptrend and currently is in a correction phase in which it is approaching the trend at 72 support and resistance area.
Trade safe, Joe.

EURUSD Potential UpsidesHey Traders, in the coming week we are monitoring EURUSD for a buying opportunity around 1.14500 zone, EURUSD is trading in an uptrend and currently is in a correction phase in which it is approaching the trend at 1.14500 support and resistance area.
Trade safe, Joe.

Gold: Breakout and Potential Retrace!!Hey Traders, in today's trading session we are monitoring XAUUSD for a selling opportunity around 3,390 zone, Gold was trading in an uptrend and successfully managed to break it out. Currently is in a correction phase in which it is approaching the retrace area at 3,390 support and resistance zone.
Trade safe, Joe.

USDCAD is Nearing The Daily TrendHey Traders, in today's trading session we are monitoring USDCAD for a selling opportunity around 1.38500 zone, USDCAD is trading in a downtrend and currently is in a correction phase in which it is approaching the trend at 1.38500 support and resistance area.
Trade safe, Joe.

NASDAQ Potential UpsidesHey Traders, in the coming week we are monitoring NAS100 for a buying opportunity around 21,500 zone, NASDAQ is trading in an uptrend and currently is in a correction phase in which it is approaching the trend at 21,500 support and resistance area.
Trade safe, Joe.

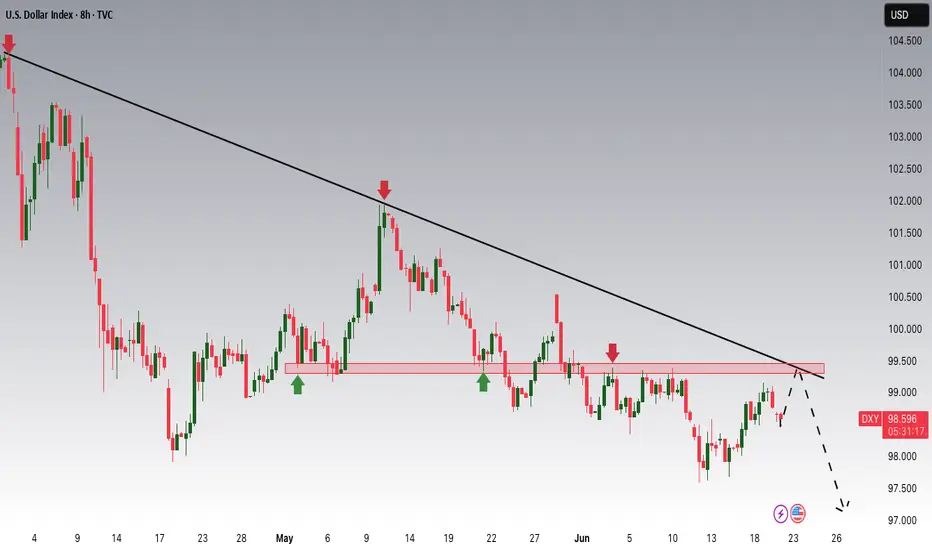
DXY Potential DownsidesHey Traders, in today's trading session we are monitoring DXY for a selling opportunity around 99.300 zone, DXY is trading in a downtrend and currently is in a correction phase in which it is approaching the trend at 99.300 support and resistance area.
Trade safe, Joe.
GBPJPY Potential DownsidesHey Traders, in tomorrow's trading session we are monitoring GBPJPY for a selling opportunity around 195.600 zone, GBPJPY is trading in a downtrend and currently is in a correction phase in which in which it is approaching the trend at 195.600 support and resistance area.
Trade safe, Joe.

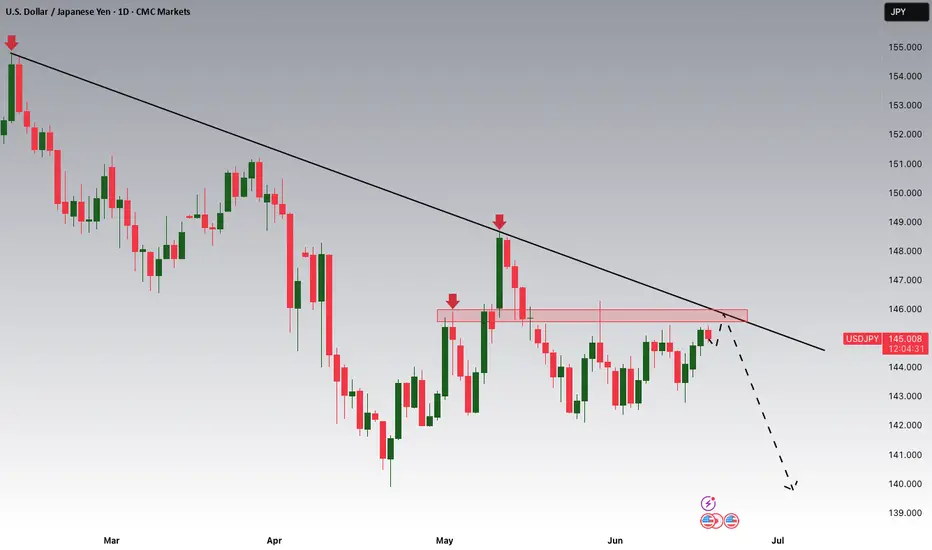
USDJPY Potential DownsidesHey Traders, in today's trading session we are monitoringUSDJPY for a selling opportunity around 145.700 zone, USDJPY is trading in a downtrend and currently is in a correction phase in which it is approaching the trend at 145.700 support and resistance area.
Trade safe, Joe.
Dow Jones Potential UpsidesHey Traders, in today's trading session we are monitoring US30 for a buying opportunity around 41,900 zone, US30 is trading in an uptrend and currently is in a correction phase in which it is approaching the trend at 41,900 support and resistance area.
Trade safe, Joe.

AUDUSD Potential UpsidesHey Traders, in today's trading session we are monitoring AUDUSD for a buying opportunity around 0.64600 zone, AUDUSD is trading in an uptrend and currently is in a correction phase in which it is approaching the trend at 0.64600 support and resistance area.
Trade safe, Joe.

USDCAD is Nearing The Daily Trend!!Hey Traders, in today's trading session we are monitoring USDCAD for a selling opportunity around 1.36950 zone, USDCAD is trading in a downtrend and currently is in a correction phase in which it is approaching the trend at 1.36950 support and resistance area.
Trade safe, Joe.

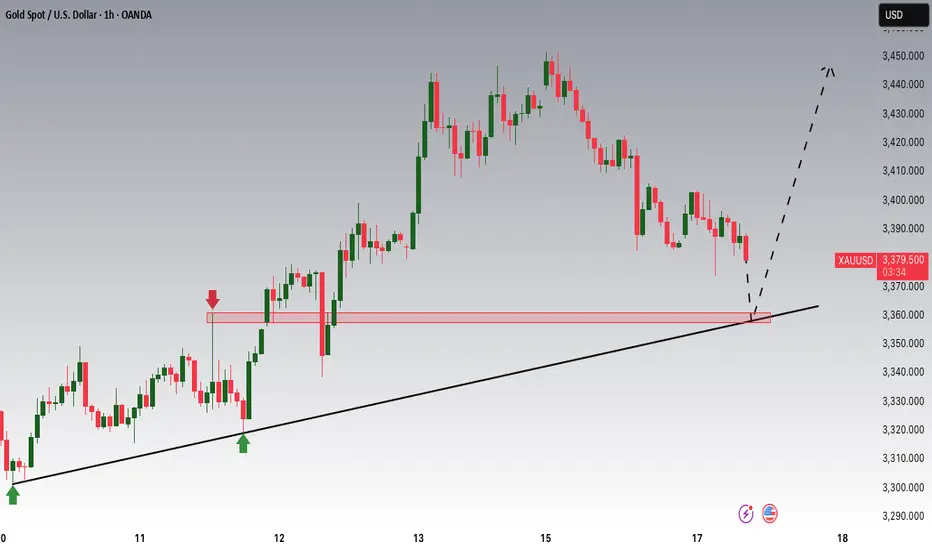
Gold is Nearing an Important Support!!Hey Traders, in today's trading session we are monitoring XAUUSD for a buying opportunity around 3,360 zone, Gold is trading in an uptrend and currently is in a correction phase in which it is approaching the trend at 3,360 support and resistance area.
Trade safe, Joe.
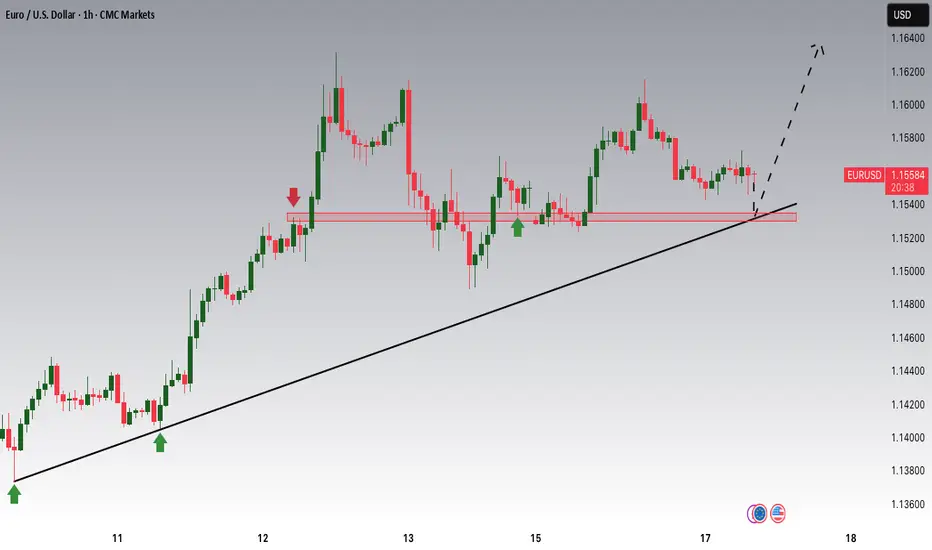
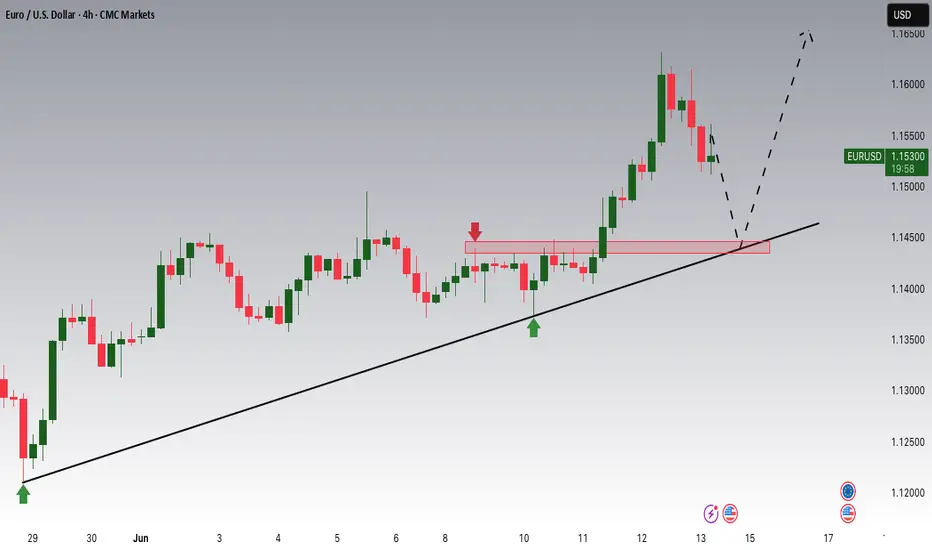
EURUSD Potential UpsidesHey Traders, in today's trading session we are monitoring EURUSD for a buying opportunity around 1.15300 zone, EURUSD is trading in an uptrend and currently is in a correction phase in which it is approaching the trend at 1.15300 support and resistance area.
Trade safe, Joe.
AUDJPY Potential UpsidesHey Traders, in today's trading session we are monitoring AUDJPY for a buying opportunity around 93.600 zone, AUDJPY is trading in an uptrend and currently is in a correction phase in which it is approaching the trend at 93.600 support and resistance area.
Trade safe, Joe.

NZDUSD Potential UpsidesHey Traders, in today's trading session we are monitoring NZDUSD for a buying opportunity around 0.60000 zone, NZDUSD is trading in an uptrend and currently is in a correction phase in which it is approaching the trend at 0.600000 support and resistance area.
Trade safe, Joe.

EURUSD Potential UpsidesHey Traders, in today's trading session we are monitoring EURUSD for a buying opportunity around 1.14500 zone, EURUSD is trading in an uptrend and currently is in a correction phase in which it is approaching the trend at 1.14500 support and resistance area.
Trade safe, Joe.
Dow Jones Breakout and Potential RetraceHey Traders, in the coming week we are monitoring US30 for a selling opportunity around 42,400 zone, Dow Jones was trading in an uptrend and successfully managed to break it out. Currently is in a corerction phase in which it is approaching the retrace area at 42,400 support and resistance area.
Trade safe, Joe.

NASDAQ Breakout and Potential RetraceHey Traders, in tomorrow's trading session we are monitoring NAS100 for a selling opportunity around 21,700 zone, NASDAQ was trading in an uptrend and successfully managed to break it out. Currently is in a correction phase in which it is approaching the retrace area at 21,700 support and resistance zone.
Trade safe, Joe.

AUDUSD Potential UpsidesHey Traders, in the coming week we are monitoring AUDUSD for a buying opportunity around 0.64500 zone, AUDUSD is trading in an uptrend and currently is in a correction phase in which it is approaching the trend at 0.64500 support and resistance area.
Trade safe, Joe.

Safe-Haven Demand Boosts Gold as Middle East Tensions EscalateHey Traders,
In today’s trading session, we are monitoring XAUUSD for a buying opportunity around the 3,380 zone. Gold is currently trading in an uptrend and is experiencing a correction phase as it pulls back toward this key support and resistance area.
On the fundamental side, reports indicate that Israel struck Iran overnight — fueling a classic geopolitical risk-off sentiment. This escalation is driving strength in safe-haven assets while putting pressure on riskier markets. Gold typically benefits from this kind of uncertainty, adding further weight to the technical setup we’re seeing today.
Trade safe,
Joe

Gold (XAUUSD) Eyes 3,330 Zone as Safe-Haven Demand Builds!!Hey Traders, In today’s trading session, we’re keeping a close watch on XAUUSD for a potential buying opportunity around the 3,330 zone. Gold continues to trade within a strong uptrend, and is currently undergoing a healthy correction, bringing it near a key support/resistance level that could act as a springboard for the next leg higher.
From a fundamental perspective, rising geopolitical tensions in the Middle East have led to the evacuation of diplomatic personnel and increasing concerns of potential military escalation. As uncertainty grows, safe-haven assets like gold tend to attract stronger demand from investors seeking protection against volatility and risk.
If the situation deteriorates further, we could see a surge in gold prices as market participants hedge against geopolitical instability.
Trade safe,
Joe

Crude Oil Eyes 65.40 Support Amid Middle East Uncertainty!!Hey Traders,
In today’s trading session, we’re closely monitoring USOIL for a potential buying opportunity around the 65.40 zone. The commodity remains in an overall uptrend, and is currently undergoing a corrective phase, approaching a key support/resistance area near 65.40. This level aligns well with the broader trend structure and may offer a favorable risk-to-reward setup.
On the fundamental side, geopolitical tensions are on the rise. Reports indicate that U.S. embassy personnel are being evacuated from parts of the Middle East amid growing regional instability. Allegedly, Israel is preparing for potential military action against Iran should nuclear deal talks collapse.
If these tensions escalate further into military conflict, oil prices could spike in response to the heightened risk to regional supply chains.
Trade safe,
Joe
