DXY Ready to Reload? Eyes on 99.100 as Tariff Tensions Ease!!Hey Traders, In tomorrow's trading session, we're closely monitoring the DXY for a potential buying opportunity around the 99.100 zone. After trending lower for a while, the dollar index has successfully broken out of its downtrend and is now entering a corrective phase.
We’re watching the 99.100 support/resistance area closely, as it aligns with a key retracement level making it a strong candidate for a bullish reaction.
On the fundamental side, Friday's NFP data came in slightly above expectations, which is typically USD-positive. In addition, recent Trump-led de-escalation in U.S.-China tariff tensions is another supportive factor for the dollar.
Trade safe, Joe.
Containsimagine

S&P500 is Nearing an Important Support of 5,960!!!Hey Traders, in today's trading session we are monitoring US500 for a buying opportunity around 5,960 zone, US500 is trading in an uptrend and currently is in a correction phase in which it is approaching the trend at 5,960 support and resistance area.
Trade safe, Joe.

USDCAD Potential DownsidesHey Traders, in today's trading session we are monitoring USDCAD for a selling opportunity around 1.37100 zone, USDCAD is trading in a downtrend and currently is in a correction phase in which it is approaching the trend at 1.37100 support and resistance area.
Trade safe, Joe.

NZDJPY Potential UpsidesHey Traders, in today's trading session we are monitoring NZDJPY for a buying opportunity around 87.350 zone, NZDJPY is trading in an uptrend and currently is in a correction phase in which it is approaching the trend at 87.350 support and resistance area.
Trade safe, Joe.

NZDUSD Potential UpsidesHey Traders, in today's trading session we are monitoring NZDUSD for a buying opportunity around 0.60350 zone, NZDUSD is trading in an uptrend and currently is in a correction phase in which it is approaching the trend at 0.60350 support and resistance area.
Trade safe, Joe.

Gold: Easing China Tensions Could Weigh on XAUUSD Prices!!!Hey Traders, in the coming week we are monitoring XAUUSD for a selling opportunity around 3,340 zone, Gold was trading in an uptrend and currently is in a correction phase in which it is approaching the retrace area at 3,340 support and resistance area.
Trade safe, Joe.

EURUSD: Breakout and Potential RetraceHey Traders, in today's trading session we are monitoring EURUSD for a selling opportunity around 1.14200 zone, EURUSD was trading in an uptrend and successfully managed to break it out. Currently is in a correction phase in which it is approaching the retrace area at 1.14200 support and resistance zone.
Trade safe, Joe.

AUDJPY Potential UpsidesHey Traders, in today's trading session we are monitoring AUDJPY for a buying opportunity around 94.000 zone, AUDJPY is trading in an uptrend and currently is in a correction phase in which it is approaching the trend at 94.000 support and resistance area.
Trade safe, Joe.

GBPUSD Potential UpsidesHey Traders, in today's trading session we are monitoring GBPUSD for a buying opportunity around 1.35400 zone, GBPUSD is trading in an uptrend and currently is in a correction phase in which it is approaching the trend at 1.35400 support and resistance area.
Trade safe, Joe.

USDCAD Potential DownsidesHey traders, in today's trading session we are monitoring USDCAD for a selling opportunity around 1.37500 zone, USDCAD is trading in a downtrend and currently is in a correction phase in which it is approaching the trend at 1.37500 support and resistance area.
Trade safe, Joe.

EURUSD Breakout and Potential RetraceHey Traders, in today's trading session we are monitoring EURUSD for a buying opportunity around 1.13700 zone, EURUSD was trading in a downtrend and successfully managed to break it out. Currently is in a correction phase in which it is approaching the retrace area at 1.13700 support and resistance area.
Trade safe, Joe.

AUDUSD Breakout and Potential RetraceHey Traders, in today's trading session we are monitoring AUDUSD for a buying opportunity around 0.64900 zone, AUDUSD was trading in a downtrend and successfully managed to break it out. Currently is in a correction phase in which it is approaching the retrace area at 0.64900 support and resistance zone.
Trade safe, Joe.

Gold Breakout and Potential RetraceHey Traders, in today's trading session we are monitoring XAUUSD for a buying opportunity around 3,330 zone, Gold was trading an a downtrend and successfully managed to break it out. Currently is in a correction phase in which it is approaching the retrace area at 3,330 support and resistance zone.
Trade safe, Joe.

USDJPY Potential DownsidesHey Traders, in today's trading session we are monitoring USDJPY for a selling opportunity around 143.200 zone, USDJPY is trading in a downtrend and currently is in a correction phase in which it is approaching the trend at 143.200 support and resistance area.
Trade safe, Joe.

NZDUSD Potential UpsidesHey Traders, in today's trading we are monitoring NZDUSD for a buying opportunity around 0.59400 zone, NZDUSD is trading in an uptrend and currently is in a correction phase in which it is approaching the trend at 0.59400 support and resistance area.
Trade safe, Joe.

Ripple is Approaching An Important ResistanceHey Traders, in today's trading session we are monitoring XRPUSDT for a selling opportunity around 2.25 zone, Ripple is trading in a downtrend and currently is in a correction phase in which it is approaching the trend at 2.25 support and resistance area.
Trade safe, Joe.

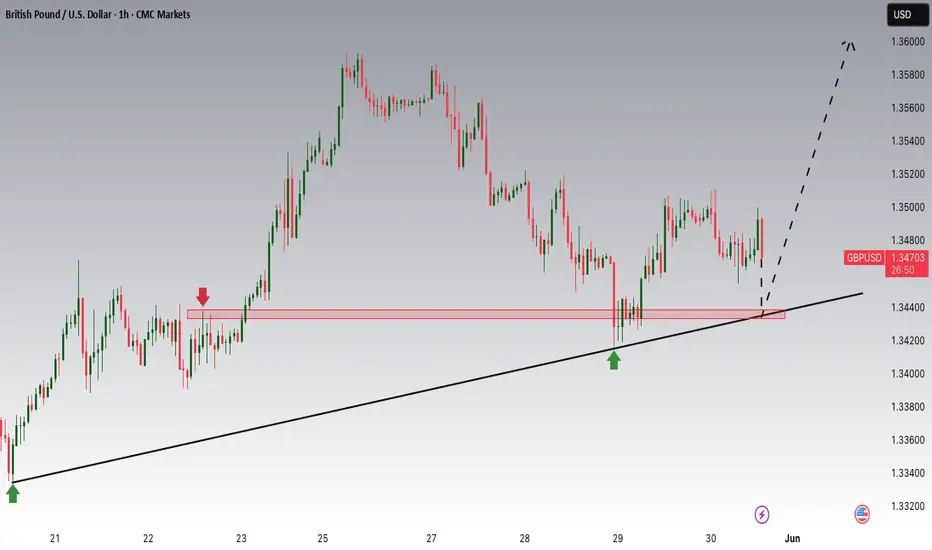
GBPUSD is Nearing an Important Support!!Hey Traders, in today's trading session we are monitoring GBPUSD for a buying opportunity around 1.34400 zone, GBPUSD is trading in an uptrend and currently is in a correction phase in which it is approaching the trend at 1.34400 support and resistance area.
Trade safe, Joe.
Gold Strong Pullbacks But Long Term Image Still Bullish!!!Hey Traders, in today's trading session we are monitoring XAUUSD for a buying opportunity around 3,200 zone, Gold is trading in an uptrend and currently is in a correction phase in which it is approaching the trend at 3,200 support and resistance area.
Trade safe, Joe.

AVAX/USDT Potential UpsidesHey Traders, in today's trading session we are monitoring AVAX/USDT for a buying opportunity around 22.00 zone, AVAX.USDT is trading in an uptrend and currently is in a correction phase in which it is approaching the trend at 22.00 support and resistance area.
Trade safe, Joe.

Ethereum is Approaching a Key Support!Hey Traders, in today's trading session we are monitoring ETH/USDT for a buying opportunity around 2,650 zone, Ethereum is trading in an uptrend and currently is in a correction phase in which it is approaching the trend at 2,650 support and resistance area.
Trade safe, Joe.

Bitcoin is Nearing a Key Support Level!!!Hey Traders, in today's trading session we are monitoring BTCUSDT for a buying opportunity around 107,000 zone, Bitcoin is trading in an uptrend and currently is in a correction phase in which it is approaching the trend at 107,000 support and resistance area.
Trade safe, Joe.

SUI/USDT is Nearing an Important Support!!Hey Traders, in today's trading session we are monitoring SUI/USDT for a buying opportunity around 3.2460 zone, SUI/USDT is trading in an uptrend and currently is in a correction phase in which it is approaching the trend at 3.2460 support and resistance area.
Trade safe, Joe.

PEPE/USDT Potential UpsidesHey Traders, in today's trading session we are monitoring PEPE/USDT for a buying opportunity around 0.00001360 zone, PEPE/USDT is trading in an uptrend and currently is in a correction phase in which it is approaching the trend at 0.00001360 support and resistance area.
Trade safe, Joe.
