EURCAD I Correction and Long Continuation FormingWelcome back! Here's an analysis of this pair!
COMMENT BELOW and let us know your thoughts or questions!
**
We recommend that you keep this pair on your watchlist and enter when the entry criteria of your strategy is met.
Please support this idea with a LIKE if you find it useful and Click "Follow" on our profile if you'd like these trade ideas delivered straight to your email in the future.
Thanks for your continued support!
Brian & Kenya Horton, BK Forex Academy
Continuation

DUSK ContinuationLooking to enter this DUSK swing continuation setup with target at the next higher timeframe structure.

✅EUR_GBP BULLISH BIAS|LONG🚀
✅EUR_GBP is again trading above the falling support
With the fakeout on the daily
And the pair is trading above the level again
Which makes me expect bullish continuation
LONG🚀
✅Like and subscribe to never miss a new idea!✅

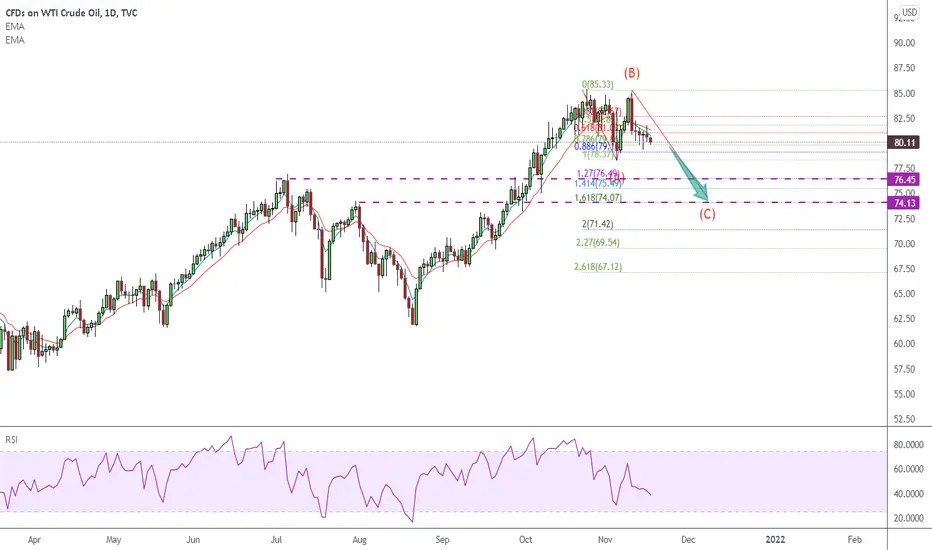
1711 Reversal Top USOIL continue down to test 74 soonHello traders,
USOIL is on my daily selling list that all retracement would make a chance to add a new setup to sell.
Fibo 1.27-1.618 is the target zone.
RISK LOWER THAN YOUR TOLERANCE:
Suggested Risk <5%
Your Real Entry Position Will Make Different RR for Your Trade.
GOOD LUCK!!!
LESS IS MORE!
Crab Almost Complete 🦀GBP/AUD - Crab Almost complete, D point landing on the .886 of the Daily uptrend pullback (Very nice PRZ here lots of confluence)
Price may tap into the imbalance below before the continuation, it just made a fake move to the upside from the .786 i'll be waiting for price to hit my zone and watching for reversals on the LTF
Let me know your thoughts!
** Disclaimer ***
These ideas I never trade until the end target with my initial lots, I focused on high probable entries with higher lots and use a specific partial taking strategy giving me a very high win rate and take most of my profits very early, I only leave a small % of my capital to run the entire trade. On the flip side im constantly monitoring LTF momentum and will close early if things change, these analysis's are for research purposes only.

USDJPY Continuation higher again!Ill be looking for more rejection off current support of 112.700 for buy trades to atlest 113.500 and beyond.

FTM CORRECTION INCOMINGFTM has seen a lot of growth the past few months, however it is due for a correction.
Looking at the chart we can see price always retraced back to the .786 fib support after each impulsive wave,
should we get that same retracement, FTM will be on a discount price at just below $1
Coupled with the bearish Divergence it seems just about right to me.
Did the analysis on a 1D Timeframe originally but uploading the 1W chart to avoid cluster and improve visibility.
Hope this helps.

What are Supply and Demand Zones and How to Trade with Them?What are Supply and Demand Zones?
▷ Demand Zone (Accumulation Area):
Accumulation comes from a Latin word meaning to increase something over time.
A strong uptrend can only exist if buyers outnumber sellers. During a trend, price moves up until enough sellers enter the market to absorb the buy orders. The origin of strong bullish trends is called an accumulation or a demand zone. Demand Zone is where traders are willing to buy aggressively because the balance has shifted to the demand side. Here, buyers are dominant and sellers weak.
The demand zone represents a period of implicit buying, typically by institutional buyers, while the price remains fairly stable. This area is characterized by mostly sideways price movement. Before a trend starts, price stays in an demand zone until the “big players” have accumulated their positions and then drive price higher.
This can be contrasted with the Supply Zone, where institutional investors start to sell.
▷ Supply Zone (Distribution Area):
Bearish trends are created when sellers outnumber buy orders. Then, price falls until a new balance is created and buyers become interested again. The origin of a bearish trend wave is called a distribution or a supply zone. At Supply Zone traders are willing to sell aggressively because the balance has shifted to the distribution side. Here, sellers are dominant and buyers are weak.
Support and Resistance Levels vs. Zones
If you have an idea of how to trade with support and resistance zones, you might find supply and demand zones very similar.
You won’t be mistaken; Supply and demand zones are natural support and resistance levels. You’ll often find supply and demand zones just below/above support and resistance levels.
Types of Supply And Demand Patterns
There are two types of patterns: “Reversal” and “Continuation” patterns.
While a pattern is forming, there is no way to tell whether the trend will continue or reverse. As such, careful attention should be paid to whether the price breaks above or below the zone.
▷ Continuation Patterns
If price continues on its trend, the pattern is known as a continuation pattern.
We have two continuation patterns: “Rally-Base_Rally” and “Drop-Base-Drop”
▷ Reversal Patterns
When price reverses after a pause, the pattern is known as a reversal pattern. The established trend will pause and then head in a new direction as new energy emerges from the other side (bull or bear).
Reversals that occur at market tops are known as distribution patterns. Conversely, reversals that occur at market bottoms are known as accumulation patterns.
We have two reversal patterns: “Rally-Base_Drop” and “Drop-Base-Rally”
How to Find Supply and Demand Zones?
On a price chart, the demand zone is characterized by sideways price movement on above-average volume. When a stock price doesn't fall below a certain price level, and moves in a sideways range for an extended period, this can be an indication to investors that the stock is being accumulated by investors and as a result, will be moving up soon.
The demand and supply zones are encompassing the base on the beginning of the move. The most important thing is to first finding a sharp move in either direction, after which you can identify its starting point and roughly define the supply or demand zone:
• Look at the chart and try to spot successive large candles.
• Find the base from which price started the quick move. Usually, before that you have a small sideways move, that is where your supply / demand zone is.
• Draw the zone
It is very hard to be precise with those levels and here it is more of an art than science. To make it easier to identify these levels, you can use another tool for confirmation.
How to Trade with Them?
One way to trade with supply and demand areas is reversal trading. After identifying a previous strong market reversal, wait for the price to return to that area. If a false breakout occurs, the chance of seeing a successful reversal is extremely high.
Some candlestick patterns such as "Engulfing", "Pin Bar" and "Tweezer Blades" can help you identify trend reversals.
Be careful, trading in the opposite direction of the trend is very risky. Technical analysts typically recommend assuming a trend will continue until it is confirmed that it has reversed. Trend reversal trading can be a profitable way to trade the markets. However, like any other trading strategy, there is a correct and a wrong way to do it.
Pros and Cons
Being able to recognize whether an asset is in the demand zone or the supply zone is helpful to investing success. Demand Zone is the origin of a big rally in price. Identifying this area could help investors spot good entry points into an investment before its price begins to rise.
Once the price leaves an demand zone, not all buyers got a fill and open interest still exists at that level. Supply and demand traders can use this knowledge to identify high probability price reaction zones.
As with anything else, supply and demand zones have their cons, as well. Understanding chart movements such as those seen in the accumulation area can work well during times of relative stability. Still, prudent investors know to pay attention to larger economic events that can quickly reconfigure charts (like the covid-19 epidemic)
Key Points
• Accumulation / Re-accumulation zones can becomes distribution/Re-distribution zones over a period in the Stock Market
• The narrower a supply/demand zone before a strong breakout is, the better the chances for a good reaction the next time typically.
• Good supply and demand zones are quite narrow and do not hold too long, which shows strong imbalance between buyers and sellers.
• The stronger the breakout, the better the demand zone and the more open interest will usually still exist.
• Always look for extremely strong turning points. They are often high probability price levels.
• Each time the price re-tests a supply/demand zone, more and more previously unfilled orders are filled and the level is continually weakened.
Conclusions
Supply and Demand Zones are a great way to identify areas of buying and selling as well as support and resistance, but they work best when combined with other kinds of technical analysis.

EURAUD Analysis - Temporary move down and trend continuationWelcome back! Here's an analysis of this pair!
COMMENT BELOW and let us know your thoughts or questions!
**
We recommend that you keep this pair on your watchlist and enter when the entry criteria of your strategy is met.
Please support this idea with a LIKE if you find it useful and Click "Follow" on our profile if you'd like these trade ideas delivered straight to your email in the future.
Thanks for your continued support!
Brian & Kenya Horton, BK Forex Academy

KCS - My Trading Plan in 3 mins!Hello everyone, if you like the idea, do not forget to support with a like and follow.
Here is the top-down analysis for KCS, feel free to request any pair/instrument or ask any questions in the comment section below.
Best of luck!

MU breakout continuation Even ok the short week MU consistently tried to move. I’m following the orange levels up to ultimately test the ath. Break of that we may move.


#TSLA - Price moving within a consolidation triangle!Hi All, my main 3 take-outs from this analysis are the following:
1- Price action is maturing within a symmetrical triangle which looks like being a continuation triangle pattern. I would not be surprised if the price might touch again the up red trendline and break it upwards with volumes by mid-December
2- First target following this possible breakout would be approximately 1490-1500$
3- The target given by the triangle is also matching with the first extension leg of fibonacci expansion tool
Not a financial advice, just personal opinion. Do your own due diligence and good luck!

CRVUSDT Breakout and moves to TargetYet another example of an asset ready to move and helped by a little BTC push upwards. CRV was in a flagging pattern for awhile now and it was only a matter of time before it started to move towards the target. I think it still has a bit more juice in it before it starts to consolidate again before continuation. Once BTC gets going, its should head to the target without issue. This will likely create a small basing pattern and give us another smaller target. Thanks again everyone!

ILVUSDT Breakout Starts Move to TargetHere is another asset I have been mentioning that has moved due to BTCs recent push upwards. The RSI looks a bit high right now so you should expect it to consolidate into a continuation pattern soon and head up even further. This will likely create a small cup and handle further confirming the move higher. Thanks again everyone!

ONEUSDT Starts Move to TargetSo ONEUSDT has started its breakout move to the major target with a little help from a semi bullish movement from BTC. I expect other alts to either finish their patterns or start moving just like ONEUSDT. We can this the same type of action from CRV finally. I expect ONEUSDT to consolidate in a continuation pattern from here and push to the major target in the coming weeks. Thanks again everyone!

POSSIBLE SHORT ON GBPJPYHowever on the flip side we still have bearish price action as we broke out and back into the downward channel afterward retracing 50% giving momentum candles to the downside.Will update as time goes on, stay tuned!
Good Luck.
God Bless!

US100 16591.0 + 0.5% LONG IDEA * TREND CONTINUATIONHELLO EVERYONE
HOPE EVERYONE IS DOING GOOD HAVING A GOOD ONE, HERE'S A LOOK AT POSSIBLE SCENARIOS THAT COULD PLAY OUT IN THE COMING WEEK ON NASDAQ, US100.
Will we see a bullish continuation to - 61.6 % fib ( 16933.00) level in the coming week.
* The index is still strongly bullish
* Tested and rejected 61.8 % Fibonacci level signaling continuation
* Broke above of structure.
lets see how it goes.
IF THIS IDEA ASSISTS IN ANY OR IF YOU LIKE THIS ONE
SMASH THAT LIKE BUTTON & LEAVE A COMMENT.
ALWAYS APPRECIATED
____________________________________________________________________________________________________________________
* Kindly follow your entry rules on entries & stops. |* Some of The idea's may be predictive yet are not financial advice or signals. | *Trading plans can change at anytime reactive to the market. | * Many stars must align with the plan before executing the trade, kindly follow your rules & RISK MANAGEMENT.
_____________________________________________________________________________________________________________________
| * ENTRY & SL -KINDLY FOLLOW YOUR RULES | * RISK-MANAGEMENT | *PERIOD - SWING TRADE

SOLUSDT Patterns and Next TargetSo I have talked about SOL to my followers for awhile now. I have been profiting off of the asset rather early. I am not sure if I every published a public chart on it so here you go. We have a cup and handle pattern and a flag pole both agreeing on a price around the area marked on the chart. This one is rather easy to see and tells us there is expected continuation. Thank again everyone!

KDAUSDT Update and TargetWith KDA, we did not see a standard flagging pattern like we have seen with a lot of alts the past week. Instead we have a bull pennant signaling the continuation. Obviously, I believe this asset will do great. I have been talking about it and charting it myself for awhile now. Next major stop will be 44. KDA finally gave me a moment to chart it again. Thanks again everyone!

BUY/USDT ContinuationBurency has been an impressive trade so far. Right now we are looking for a breakout and continuation. This will eventually give another chance to test 0.085 and 0.09 again. Once this barrier is broken, the rest of its resistance are much further away. Patience is a must with this as the whales are heavily suppressing before take off. Enjoy

EURGBP It Will Head UpwardWelcome back!
Please support this idea with a LIKE and COMMENT if you find it useful.
*****
EURGBP is presently bullish on the Daily and rejecting the 50 % fib. If the current daily support holds, price action should push upward back to previous resistance for the bullish continuation.
Be sure to follow the entry criteria rules for your strategy and keep this on your watch list!
- BKH

$SIlver is off to the moon? Let's see! Godawful continuation patIMHO it is NOT a bullfalg. IT's a continuation pattern with two massive rugpulls to reset fo rth next leg up.
THe S/R lines drawn that go off-screen are historic ones and they are POWERFUL. Watch for them to be acknowledge and crawled amongst.
