Continuation

BTC Bullish Pennant and TargetLooks like sideways action for the next for or five days could be followed by a bullish break and continuation to the upside. Target for next short could be around $54k.

NZDCHF| Continuation Correction We took profits on the first push up this week, now we're looking capitalize on the next leg of the impulse, All we have to do is to wait for the correction to complete. I'm comfortable with all types of entries on this play whether Risk entry, breakout entry or a LTF correction after the breakout entry.

THE CARDANO TRAIN MAY HAVE NOT LEFT YET!! (ADAUSD)Please like and comment as it pushes me to keep creating content on pairs and my bias on it :) -This is merely MY outlook and not advice on what YOU should do just my opinion on what I see - yonsfx

usdchf next week strategy on usdchf this is a good pattern where there is an inverted head and shoulders with a target point of around 0.95 but it will take a long time to reach the target, it seems, so just anticipate it

LONG position on USDCADJust an update. I analyzed a buy setup on the pair as an intraday buy trade. The analysis played out.


GBPUSD 4H Long (Market Structure)Clear market structure idea, we can see new HH's also we might see that breakout (bullish pattern) as a New HIgher low. Fibonacci 0.38 is also extra confirmation for support level if this goes as we expected we can buy til fibonacci 0.78 please manage your risk if youre looking forward to trade on it.

EURGBP SHORTsituation :Trend UP changing to dwon
Position: looking go down in the 50% of the monday candle
Strategy :sell looknin R/B - 1/2

Late Entry Inverse Head And Shoulders Continuation Above PCZGRT has broken Above Our Buy Zone and is now forming a potential continuation pattern above it. I previously stated that GRT was at the PCZ of a Bullish Gartley on the Monthly and now we are above the PCZ but there still may be a chance for those who are here late to enter.
For the context behind the Monthly Bullish Gartley look at the related chart below.

Gold Long analysisi believe gold will go long position.The daily structure are strong and not easy to break.

USDJPY Buy SetupFor my chart of the day today, i am going with USDJPY, we have retraced and retested both the Psychological resistance and the 52 days moving average. Then we get a bullish engulfing pattern in the direction of the trend. My bias is to see the USD moving upwards.

BTCUSD Long following a nice pullbackSo far, we've seen a nice run on BTC. And its been a while since I've traded BTC, but as I missed alot of opportunities since last week, I figured tonight would be a good night when I saw that nice pullback. As I am seeing bullish structure being formed, I entered a LONG, hoping for continuation.
Reasons for entering trade:
0.618 Pullback of the last push up
Wyckoff schematic, entry on retest
Entry on predefined POI
As more structure is being broken to the upside, BTC is showing signs of strength for continuation
To be honest, I am not confident that we are going too much higher. I would like to see more structure broken to the upside before I think there is a chance that this could continue up. Even if it does continue up, we will likely see a large pullback to grab some of the liquidity created along the way.
As for this trade, I've entered a low risk, narrow SL trade, so even if it goes against me, not a big deal. If it breaks the fractal AR, then I will set BE and let it run. And if it continues, I'll take partials at the target in the chart, and let the rest run, hoping for continuation.

AUDJPY Short SetupTrend: Bearish
Structure: Support and resistance / Lower lows
Plan: We look for a continuation of the bearish trend. Price has bounce off previous higher lows (resistance) and has made a lower low, this along with MACD confirmation suggest a continuation of bearish trend

Continuation & Reversal Correction in price action structures
In-depth look at Continuation & Reversal Correction in price action structures/patterns
Hi everyone:
Today I want to revisit the fundamental aspect of trading impulsive and corrective phases in Price Action Analysis.
As you all know I focus on multi-time frame analysis and forecasting/anticipating the next impulsive move in the market.
To me, the most important part of identifying the next impulsive phase of the market, is to understand how correction works.
An impulse phase usually happens after a correction has finished correcting, so the key is to identify and understand how a corrections structure will complete so we anticipate the next impulsive move.
You may have seen my videos on this topic, but today I will go more in detail on this, and explain the 2 types of correctional structure the market can create.
The market can only be in 2 phases, impulsive phrase or corrective phrase.
In addition, the corrective phrase can only be continuation, or reversal.
So to fully have an edge in the market, is to understand what the correctional structure the price is currently making,
whether a continuation/reversal, then forecast the possible price outlook, and go down to the lower time frames for possible entries.
Now, it's important to understand that different traders/strategies/styles will call these patterns/structures in varies names.
What they are called or identify isn't important, but the important aspect is to understand whether they are continuation, or they are reversal.
In addition, simply seeing price action structures/patterns by itself, is not a good enough entry criteria for me.
You want to combine multi- time frame analysis, top-down approach, and with multiples of these price actions all happening so it adds extra confluence for you to enter a particular trade.
Seeing a H and S pattern, on a 5 minute chart, without considering the overall HTF and other factors, will not be a consistent move in the long run.
Continuation Correctional Structure/Pattern
Bullish/Bearish Flag
Bullish/Bearish Pennant
Parallel Channel
Reversal Correctional Structure/Pattern
Ascending/Descending Channel
Rising/Falling Wedge
Double Top/Bottom
Head & Shoulder Pattern/Inverse H and S
“M” and “W” style pattern
Reversal Impulse Price Action
I will forward all the price action structures/patterns videos I have made in the past to help you understand each of the structures more.
Impulse VS Correction
Multi-time frame analysis
Identify a correction for the next impulse move in price action analysis
Continuation Bull/Bear Flag
Parallel Channel (Horizontal, Ascending, Descending)
Reversal Ascending/Descending Channel
Reversal Double Top/Bottom
Reversal Head & Shoulder Pattern
Reversal “M” and “W” style pattern
Reversal Impulse Price Action
Continuation/Reversal Expanding Structure/Pattern
Any questions, comments or feedback please let me know. :)
Thank you
Jojo

XAUUSD ANALYSIS - UpdateWe have now reached a support zone, formerly resistance as noted in the picture above. we still anticipate a break of this support level to create the next lower low which can be seen on the daily chart.
Now, the US will be reporting Home Sales and Job claims. Initial Jobless Claims measures the number of individuals who filed for unemployment insurance for the first time during the past week. This is the earliest U.S. economic data, but the market impact varies from week to week. A higher than expected reading should be taken as negative/bearish for the USD, while a lower than expected reading should be taken as positive/bullish for the USD.
The DXY also suggest we could see a push to the up side as we have broken resistance and maybe retested. Retail Forex sentiment on myfxbook.com sees 70% of retail traders in a long position while 30% are short. My bias is Short though we are at a zone price have respected over and over again. if we can break the zone (1794 - 1790), we could eventually see the flush to 1762.50.
on the flip side there are buyers grouped at the zone (1794 - 1790) and we are expecting news so anything can happen.

USDJPY: Continuation After 4h Trendline Break The blue trendline zone was drawn on the 4h timeframe. I believe there's more room for this pair to move to the downside after a pullback on the 30 min timeframe.
GL Traders!
"Don’t blindly follow someone, follow the market and try to hear what it is telling you." - Jaymin Shah

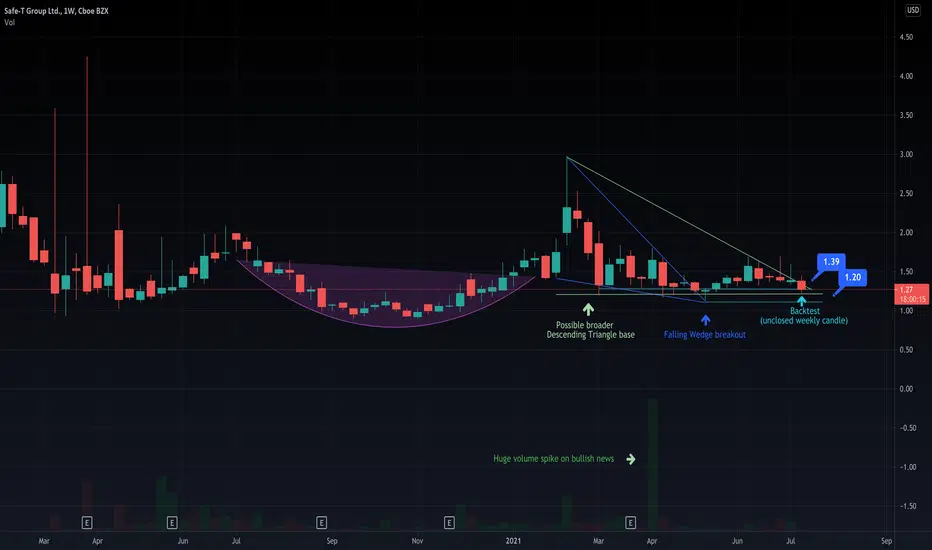
SFET about to make a decisive move On the weekly chart: After completing a large cup shape, SFET has been consolidating into a wedge/triangle pattern. A potential breakout was achieved on the wedge, and a curved backtest is underway near 1,20. A broader triangle may also exist, and the action would be nearing completion of that as well. Looking for a rebound off the 1,20 area and a weekly candle close above 1,39 for breakout continuation. Lots of bullish news has been coming out of this one lately, with one PR release accompanying a very large volume spike in April.
Why i think the bullish sycle is still intact! Hello there, this idea is more looking on the mid to long term analysis and why i think bitcoin is not done yet with his sycle
First of all its important to understand what a bullish sycle remains bullish even though we dropped over 50% in stock terms you would consider -20%+ to be the end of a sycle but as we all know 20%+ changes are the usual thing in crypto especialy on alts.
the second key of a bullish sycle is your up trend channel wich is shown as the purple line here
i do like to share this idea simply becuase this can be a great buy oppertunity with a very good risk reward that potentialy can play out here
either way even so if this will not play out i still think considering stoch being very low on daily and weekly even lower and has not been low since the 2018 bear market would be considered a good buy oppertunity anyway.
that being said we can see that the last touch around 10k triggered a period of buyers that led all the way up to 60k, a x6 times basicly, now dont get exited i dont think we will x6 and there are alot of other factors we need to account for like the ma200 daily, and not to mention resistance zones that are crucial to break out of before we really have a good foundation of a bullish sycle continuation
in my last idea about a wyckoff accumulation pattern is still at play as we havent made any lower highs then the spring and test zone, see my idea, keep in mind that subwaves are indicational and doesnt nessesary have to be followed aslong its holding the key requirements of the specific phases
the reason i am saying that is becuase it supports the idea i released now and aling very well with eich other
thanks for reading and if you liked it please dont hesitate to follow me and throw me a like! ;)

US100 Analysis: Week 7/12/21 - 7/16/21 My overall medium term bias for the market is bullish. Right now I'm seeing any dips as opportunities to buy.
Technically we're in a strong uptrend and we just had a healthy pullback. I see it breaking even further to the upside after a small retracement.
News I'm watching out for. (all pairs)
- Comments about the timeline of interest rate hikes.
- Comments about quantitative easing (tapering or not).
- Keep an eye on the opec+ spat. Watch for tapering of production cuts. Watch for oil demand projections returning to pre-pandemic levels earlier than expected.
- Any news about vaccines being ineffective against new variants of the virus.
- News about more lockdowns due to virus variants.
GL Traders!
"You don’t need to be a rocket scientist. Investing is not a game where the guy with the 160 IQ beats the guy with 130 IQ." - Warren Buffett

Chance to Go Long at USDCAD's Next Dip The pair appears to be developing a massive 1-5 impulse wave pattern, as postulated by the Elliott Wave Theory.
The current correction could potentially bottom out around the 38.2 per cent Fibonacci retracement level at 1.23670 before the bullish momentum is resumed.

BITCOIN - It's Going As ExpectedHello everyone, rouzwelt here
Well as you can clearly see in the chart, price is now reached to the lower side of the uprising yellow channel and is about to break below it, if you have been following me lately, you know that I've been talking about a potential test of the crossing point of the blue down-trend line and lower side of the uprising yellow channel in my post on June 30 (Link: ), this way it would be testing these 2 potential dynamic supports at the same time. But it's worth mentioning that we still have not fully broken below it, I believe we still need more confirmations before entering a short trade, and 2 good enough confirmations for us would be candle body close below those 2 lines in 4H or daily timeframe and also a new lower low below the last swing low (red dotted line). In that case I'll be entering on my short trade which I've been talking about lately.
Below is a screenshot of my very last post, in which I was talking about my short trade setup idea at the break out of the yellow channel, and I've been projecting the probable price actions and right now as you can see it is playing out with good accuracy as I've been expecting. I also mentioned the lack of volume and demand at rallies up which is a crucial necessity of a sustainable uprise. But what we actually are seeing at this moment in the main chart is increase in volume at the current rally down, which is an indication of more supply coming in on these levels.
So with all those said above, I'll be waiting for those confirmations I mentioned before entering my short trade, as I said earlier we still have not fully invalidated the yellow channel, so we need to wait a few more hours before jumping in on a trade, because before seeing any of those confirmations, price can still get back inside the yellow channel and continue its move up, so we don't want to enter on any trade blindly.
I'd like to remind you to please check my last 2 posts on Bitcoin, because you can find the details of my short trade setup idea (entry point, SL, TP and ...) in full if you'd like to enter on this trade along with me, as they are important considerations before entering any trade. I'll be updating this post whenever I open my position. And please If you find this post useful then support me by hitting like, share and comment below if have any opinion about it, I'd appreciate it a lot.
And as always have fun and trade safe.

CARS looking very bullish with very strong support!Hi Traders! This is our analysis for CARS, the chart looks very simple but very bullish!
- Price is currently located on a long term trend line (Yellow) which is working as a very strong support.
- Also backed by medium term trend support (purple).
- 100MA support + horizontal support.
- RSI is 45, in the past year RSI bounced of 40 level 7 times.
- Ichimoku indicating that we are in a very strong uptrend.
This stock is currently backed by 4 times of support indicating that the probability of bouncing up and testing the next resistance high. Also, the 1 year high has been tested once already, a retest is very likely when the price is backed by such strong support!
Entry at 13,50
Target at 15,37 slightly below the 1 year high for a 14% gain-
SL at 13,00
