EUR 1H short tradeAfter the upward bias on the 1H EUR now seems to break down again to continue to the downside. Sell @ 1.1910 SL 1.1930 target 1.1850
Continuation

Anticipated BREAK OUT below the ZONE AREABefore I proceed with my view on this chart, I want to believe as a trader you already know the importance of 200 EMA acting as a Dynamic Resistance and Support, we have seen a break-out below the 200 EMA and a steady consolidation just above the SUPPORT ZONE AREA from January, a rejection at the Dynamic Resistance. We saw that price did range for some days before the BREAK-OUT to the Down-Side and a retest which created a Bearish Engulfing. At this point we are expecting a clear BREAK-OUT below the ZONE AREA and if that's achieved and a possibly we see a retest, a continuation will give a valid entry and a target at 19150.96.
NOTE: As a trader, by now you should already know that consolidation at SUPPORT or RESISTANCE AREA, a strong BREAK-OUT below or above gives a valid entry.

DXY - Head & Shoulders Entry in Bullish Flag Pattern Hey guys, bigger picture here on the DXY we have just violated an inside level of structure which allows me to make the prediction that price is likely to continue higher to our next higher level of previous structure resistance. Recently we've seen a little relief in the market in the form of a bullish flag pattern.
Currently at the lower end of this flag pattern we're forming a head & shoulders bottom pattern which can be used as a setup in it's own right or as an entry reason into the bigger flag pattern setup.
Your Trading Coach - Akil

What is a Cup and Handle Pattern? GBP/USD Real ExampleGood morning, traders! Today we will make an educational post about a specific behavior in the market in certain circumstances, and we wanted to take advantage of the situation in GBP/USD that is currently happening.
The pattern we are talking about is the CUP AND HANDLE PATTERN . This pattern is widely used in stocks or indices since they are trend instruments by their essence, and it serves to catch a potential rise in price after a correction. The premise for this pattern to be valid is that the asset is in a CLEAR trend, either bullish or bearish, and has initiated a corrective process.
A cup and handle is a technical chart pattern that resembles a cup and handle where the cup is in the shape of a "u," and the handle has a slight downward drift.
There are three key things to consider when forming these patterns:
🔸Length: Generally, cups with longer and more "U" shaped bottoms provide a stronger signal (this case). Avoid cups with sharp "V" bottoms.
🔸Depth: Ideally, the cup should not be overly deep. Avoid overly deep handles, as handles should form in the top half of the cup pattern.
🔸Volume: Volume should decrease as prices decline and remain lower than average in the bowl base; it should then increase when the stock begins to make its move higher, back up to test the previous high.
🔸In addition, it is also an important factor that the handle is a clear corrective pattern and has some point of support or support. In this situation, we see that in the daily chart, the price is touching the uptrend line, and also in the published chart, we see how it is also testing the broken zone of the range. The current reversal point is solid.

USDCHF Continuation, LongGood morning ladies & gents,
Following on from my USDCHF idea last week that has destroyed TP 1, I'm now anticipating continuations long for another day. I'd anticipate a repricing on Tuesday/Wednesday downwards, but for now, DXY should be strong.
In light of this, I've taken an entry here off the M30 +OB anticipating price to hit the high of the day then take the next high lying above.
Let's see how it plays out.
RR 1:5 on the table.
Partials will be taken @ the following points I've highlighted.
As it's Monday, I'll be employing significantly lower risk as statistically this is my LEAST profitable day where I tend to avoid trading - unless a pristine setup forms like so.
Good luck.
- AmplaFX

Dow Jones continuation patternAfter a strong bullish impulse on 20 May ,Dow pulled back from the Predominant bullish trend towards the Closing Bell and Asian session opening , and had a convergence of the support and resistance levels ,forming a Bullish Wedge pattern with a break-out level @ Price 34175 .

DVN uptrend - What to expectI took some time this morning to go over the chart for Devon Energy. It looks like there is a lot of room for potential. 35 Analysts say 86% BUY. Trend continuity is in perptual uptrend. There's a steady diagonal line there. Earnings report coming up in July. There are some good short squeeze positions at the pinnacle of those bounces as well however if you buy now and hold until the end of the year there is a good potential for gains at just under 50%.

EURUSD > Possible Break and Continuatio to The Upside!!Analysis on #EURUSD
Hello friends.
The EURUSD made falls break to the downside last week and hit so many Stop losses, only to go back and closes where it was, as you can see now we have a possible head and shoulder pattern forming at the structure.
A break and close above the neckline will open the door for us to go and test the high near 1.2265
if this setup delivered value to you, like and comment
Check today analysis below⠀
>>It’s not what we do once in a while that shapes our lives. It’s what we do consistently.
____________________________________________________________________________⠀
-Disclaimer: This information is not a recommendation to BUY or SELL. It is to be used for educational purposes only⠀
-Please note this is just a PREDICTION and I have no reason to act on it and neither should you

USDJPY 109.821 + 0.06 % SHORT IDEA PRICE ACTION & STRUCUTREHELLO EVERYONE
HOPE EVERYONE IS DOING GOOD HAVING A GOOD ONE IN THE MARKET THIS WEEK, HERE'S A LOOK AT THE USD /JPY .
* follow your entry rules on entries
* significant moves with the bears change the plan.
lets see how it goes.
many stars must align with the plan before executing the trade, kindly follow your rules.
HAPPY TRADING EVERYONE & LET YOUR WINS RUN...
_________________________________________________________________________________________________________________________
ENTRY & SL - FOLLOW YOUR RULES
RISK-MANAGEMENT
PERIOD - SWING TRADE
__________________________________________________________________________________________________________________________
If this idea helps with your trading plan kindly leave a like definitely appreciate it.

Ascending Structure + Bear Flag continuation after the Breakout.With how Market closed, it looks like we may finally get sellers commitment this coming week, What I'm looking for is for a lower timeframe tight flag to continue the downtrend, if Price shoots up to test the high one more time I might opt for a breakout entry of the larger flag, my stop loss will be larger but I'm fine with it as we broke out of the larger ascending channel therefore the risk is worth it.

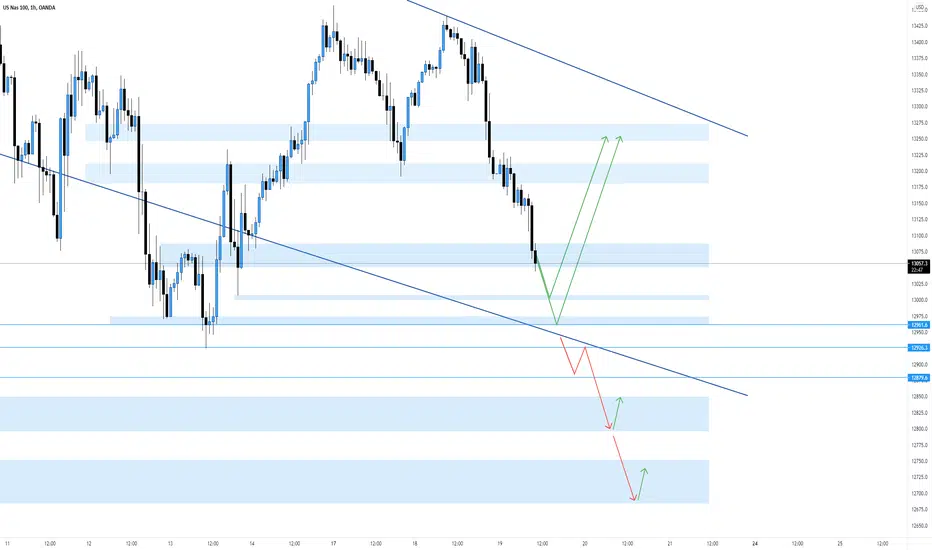
NAS100 REVERSAL OR CONTINUATIONYesterdays analysis was a total flop. A couple of guys commented and pointed out the M formation which I should have incorporated into my analysis. While my analysis was wrong, I was luckily able to catch the drop and make some decent profits. Part of growing as a trader is being able to admit when you're wrong and owning it instead of being arrogant and only showing off the winning days. Hopefully onwards and upwards from here. For today I've marked possible areas for a reversal (between 13007 - 12960) and then areas where price may head in the case of a break of the trendline. Good luck to everyone for today ✌🏼

Detail Look into Parallel Channel In Price Action Analysis
Hello everyone:
Let's take another detailed look into some parallel channels structures/patterns in price action analysis.
Recall my previous educational video on Ascending/descending channel correction, they are higher probability reversal price action structures/patterns.
Today I want to go over the horizontal parallel channel structures/patterns as well where they are more neutral,
more advanced to analyze and forecast the potential direction of the impulse phase following after.
Let's take a look into some of these horizontal parallel channel corrections, and break them down more.
In my opinion, the longer, deeper these types of parallel channels go, the stronger the next impulsive phase will be.
Although they can be tricky depending on whether they are continuation or reversal correction.
I will go over for examples in different markets to pinpoint some of these price action structures/patterns.
Below are some of the important topics that I mentioned in the video.
Reversal Ascending/Descending Channel
Risk Management: 3 different entries on how to enter the impulsive phrase of price action
Multi-time frame analysis
Identify a correction in price action analysis
Continuation and Reversal Correction
Any questions, comments, or feedback welcome to let me know thx :)
Jojo

ENJIN, ENJUST - ready to continue the uptrendHello all,
This is another update for the ENJUSDT pair that I'm monitoring and holding for quite some time. Both the fundamentals and the technicals are quite strong for this one and I can see it easily double in value if the strong general market uptrend in the altcoins remains.
As visible on the daily chart, we are currently at stage 4 in the pair's cycle which is a consolidation period after revisiting the demand zone. Back in February this was the $0.45 zone and the successful defend of that level resulted in a rapid growth in the price of ENJIN.
What we are seeing now in late April is a similar picture with the price of the altcoin rebounding from the $2 level and preparing for another leg up. What we need here is a stable daily close above he $2.7 level (again - similar to the $0.6 area from the previous breakout).
If we zoom in to the 4-hour chart we will notice that the ENJUSDT pair is already out of the downtrend and currently above all important EMAs, so the horizontal resistance is the only obstacle ahead.
1st target up - ATH daily close at $3.4 - 26 percent from here and breakout target from the triangle pattern.
2nd target up - above ATH value - 54 percent
3rd target up - flying target at 160% Fibonacci extension - 97 percent
Regards

$BNTX Ascending Triangle breakout in next 3 days?BNTX has formed an Ascending Triangle indicating breakout in next three days for run to earnings. I've taken some good profits on this since the last earnings, got in at 102, so may be a bit biased.
On the other side - this has been a LONG bull run and is clearly overbought already. The ascending triangle would seem to indicate it's got some more bullish energy left though. China is on the verge of approving it in the news...
Also in the news watch out if the White House issues an intellectual property waiver on vaccines . This most certainly could have a dramatic effect on the price action.

LRC, Secure the StationLRC, 4h: The power in the trade idea here is the 4h timeframe working from inside out, to signal longer term bullish continuation. MACD Hidden bullish divergence issues the continuation signal. Entry accumulation here between the 0.382 and 0.50 Fib. Moving averages have gold crossed this week: the 14 SMA (purple) over the 56 SMA (green) at 4:1 ratio. LRC will use the 56 SMA as support all the way up to Fib extension targets overhead. Easy risk management with stop loss just below the 0.236, defining the bottom of this local range. I think this will turn into a 3 rising valleys, which is why position starts here. This is trading 101.

Target hit on $/JPY for 8.6R, now playing the last leg downAfter the strong up trend the momentum slowed down and made bearish divergence. However i only enter divergence if it is double top/bottom after a strong trend. First opportunity to enter was on a classic swing swing around the 50 MA after momentum slowdown. I then added 2 more positions on swing trades after reversals. All positions exited at 107.7 for total 8.6R. Now playing the potential last leg down to at least test the last low, entry 108.65-60, stop 109.12, target 107.70 for 2R trade. After that we might see trend reversal and play it to the up side if momentum reverses or we get opposite swing trade

AAL: Invisible BreakoutAAL made quite the move during the nights of April 23rd and April 26th, and that move was a gap up above the downtrend, with an open at $21.46 and a close at $22.00. This invisible move is very bullish, as AAL was in a downtrend for about a month and now the gap up has broken the trend. We failed to break $22, and are now ranging between $21.64 - $21.06. However, before we get too excited for a continuation, I presume the gap will be filled ($21.21-$21.46), as we gapped through a pretty major price level, as previously mentioned. Statistically speaking, gaps have about a 91% chance of being filled according to bioequity.org. Once this level has been cleared, I anticipate a continuation of the breakout by breaking out of the established range and continuing to the upside, as bullish sentiment for AAL will continue to be fueled due to reopening optimism.

Target hit on $/JPY for 8.6R, now playing the last leg downAfter a strong up move momentum slowed down with bearish divergence. However I dont enter bearish divergence unless its double top/bottom. First opportunity to short was a classic swing around 50 MA. Added two more positions on swings pullback. All out at 1107.70 for total of 8.6R profit. Now playing the last potential leg down to at least retest the previous low. Entry 108.65-60 SL a09.12 target 107.70 for around 2R trade. after that we most probably will get trend reversal either in the form of double bottom or up swing where we can play the upside

Triangle Pattern Market gives us signals when it want to continue
its momentum. There are some patterns that tell
us that the price will not change direction, but that
it will continue its direction. In the graph you can see
a triangle. Bearish trend-pattern-bearish trend!


Potential Swing Continuation trade in NQNQ is setting up for a potential trend continuation long trade. After making the first leg from a low of 12609.75 to a high of 14059.50 then making a deep correction, it attempted to break that high but failed in the intial go with slowing at the second top then found support at 13700 and seems now going for a second try. Target is at 14550 giving us around 1:3 RR

Gold Long - Six Month trendline breakLonger term perspective XAUUSD (GOLD). XAUUSD has broken well established trendline which has been acting as an upper bound for its trading range since Highs in August.
Fundementally Gold should be transitioning to a more Bullish case as fed having been implementing quantitive easing (Printing Money) measures to stimulate the US economy over the past year. The effects of this i.e inflation of the prices of consumer good are starting to take effect now continue to do so in the coming months. Investors often turn to other assets such as Gold to protect their assets against the devaluing of the dollar.
Technically, a good long term Long position would be once a clear breakout has been made by the market on the trendline above and a clear retest of the trendline and continitation of an uptrend is established, we would ride the trend up. ( With apropriatly managed risk).
In the graph above we see a previous breakout of this trendline highlighted in red, but as said above we don't trade the breakout, nor at the return to the trendline but a clear continuation of the breakout which did not happen there. No one can predict the market but using strict rules and strategies we can increase our probability of wins. 🥇
- Adrian
