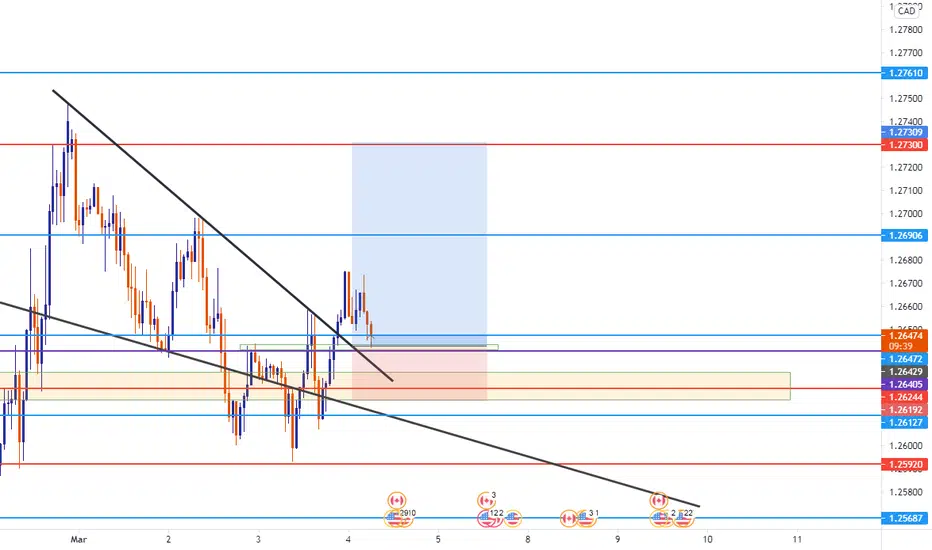
USDCADBuy setup , price formed a wedge pattern that suggests continuation of the trend ,
Price breaks above , makes a retest to the previous support , looking to make higher highs
Targeting 88 pips , Risking 23 pips , RRR 1:3
Continuation
M15 Supply Zone, Downtrend Pattern LH LL LH LLYou can see Lower Low Break at H1 and M30. Smooth downtrend pattern LH LL LH LL, then price reversal. So I think current uptrend is for retest. Based on Bullish Engulfing M30 and H1 break, I found matching M15 Bearish Engulfing, in the same possible zone of M30+H1 SBR. Exit target is based on price level that connect lower H H H structure that breaks.

GBP/JPY Short - March 1st 2021 GBPJPY on the weekly has hit a resistance, similar to GBPUSD. Mostly due to the United Kingdom's vaccination pace, re-opening schedule guaranteed which means business can now prepare to reopen. However we are seeing U.S. yields rise on anticipation of a potential inflationary period in the U.S., this adds some strength to the dollar and money flowing from other currencies to it. The Yen is also used as a cheap vehicle to invest in other economies, so now with yields rising and asset values falling in the U.S., money may begin flowing back into the Yen to cover the borrowing.


EURUSD Bull Flag pattern (continuation) forming EU looking for buys once it breaks the Flag pattern.

NAS100 - Bullish Pullback Trade Not much needs to be said about this setup aside from the fact that price has currently pulled back into a previous level of structure offering an excellent opportunity to reload your longs. Sometimes simple is better
Akil

Link Continuation That 50 day MA following that bottom trendline looks like a very appealing support to push through that upper resistance

DXY Bearish continuation pattern - DXY was developing in a bearish flag pattern
- Perfect break and retest of the support trend line
- Structure is pushing down
- Overall trend is bearish
- ( Candlestick ) Bearish Signal
- Plan is to go SHORT on DXY
- Take the trade when your rules are fulfilled
A BEARISH MOVE is probable in this market.


Heineken back to €100Heineken is heading for another move up after it has been consolidating within a bullish flag pattern. My target is €100.

Bullish Triangle on GRTUSDT PERPETUAL Green ray is where I buy,
Red ray is stop loss
White lines upper tips are the TP
(50% on the lower, what’s left on the higher)


EURUSD 1.21645 + 0.31 % LONG IDEA * PRICE ACTION AND STRUCUTRE Hey everyone
Here's a look at the EURO DOLLAR from the 4H chart for perspective and direction on lower time-frames hope everyone is good having a good one, the euro / dollar broke out of the descending channel strucutre pushed down for a retest but saw continuation to the upside as momentum was strong with the bulls, looking for a continuation of this move we are currently trading at resistance level 1.21574 a break above of this structure amongst other factors will be the trigger for the trade. significant moves with the bears change the whole plan.
lets see how it goes.
AS ALWAYS PROPER RISK MANAGEMENT AND A LOT OF PATIENCE & AGAIN many stars must align with the plan before executing the trade, kindly follow your rules.
LET'S SEE HOW IT GOES..
HAPPY TRADING EVERYONE & LET YOUR WINS RUN...
_________________________________________________________________________________________________________________________
ENTRY & SL - FOLLOW YOUR RULES
RISK-MANAGEMENT
PERIOD - SWING TRADE
__________________________________________________________________________________________________________________________
If this idea helps with your trading plan kindly leave a like definitely appreciate it.

Directional analysisPresented is a brief directional analysis using the 1 hr chart.
The trend continued its sell off to start the week following last weeks close. For continuation sentiment I analyze the day chart. Here I see a retest of the next support (very near). This is a great opportunity for buyers to be patient for a potential pivot. Strong sentiment would lean towards sell continuation if we see a clear breach through support on the day chart with no rejection.
If the above scenario plays out expect sellers to load increase sell off to the next Key support at .82900 (presented on chart).
I will be watching the MACD/SIGNAL closely for a diversion (which would tell us too lean towards a support breach) or a full signal cross (which would tell us to lean towards a pivot reversal). RSI will continue to zig-zag swim ( I call dolphin swimming through the waves) along the bottom of the oversold zone until MACD/SIGNAL plays out its role.
I will publish a trade analysis based off a breach or pivot of the looming support.
Please comment with thoughts and ideas. Thank you.


dash monthly continuation targetscamarilla + cpr. monthly level breakout targets. targets within the month are H5.

EURUSD 1.21287 + 0.09 % STRUCTURE & PRICE ACTION IDEAHEY EVERYONE
Hope you guys are having a great one Here's a look at the EURO / POUND swing wise and from multiple time-frames perspective for the most likely direction and probabilities of seeing a continuation with the BULLS.
From the MONTHLY, WEEKLY & DAILY Time-frames we see the pair trading in a bull flag that saw a rejection at the level of support 1.20172 currently seeing a continuation with the BULLS from higher Time-FRAMES the pair is strongly bullish looking for continuation of this move.
On the 4H we just broke out of that descending channel pushed down for a retest currently rallying up with the bulls now the is a significant area of resistance on the path with the bulls this is where i will have my alerts and watch what price does at this key area to signal whether continuation is in the cards and look out for entries with the bulls...
as always many stars must align with the plan before executing the trade, kindly follow your rules.
LET'S SEE HOW IT GOES..
HAPPY TRADING EVERYONE & LET YOUR WINS RUN...
_________________________________________________________________________________________________________________________
ENTRY & SL - FOLLOW YOUR RULES
RISK-MANAGEMENT
PERIOD - SWING TRADE
__________________________________________________________________________________________________________________________
If this idea helps with your trading plan kindly leave a like definitely appreciate it.
HAVE A GOOD ONE!


Bulls hopes on a 1D higher lowBulls hopes on a 1D higher low
Considering that the fast ema is above the slow ema I think its the most possible scenario in the short term. Closes below recent supports would negate this idea.
