Still holding on but our stop is nearRipple was the 3rd buy of the crypto space but has significantly lagged BTC and Litecoin. It still remains much higher then the previous range state but recent news hasn't helped the currency. Our model doesn't account for news stories so the recent SEC drama was never a factor in our decision making. If XRP cant hold 0.43 we are out of the position.
Continuation

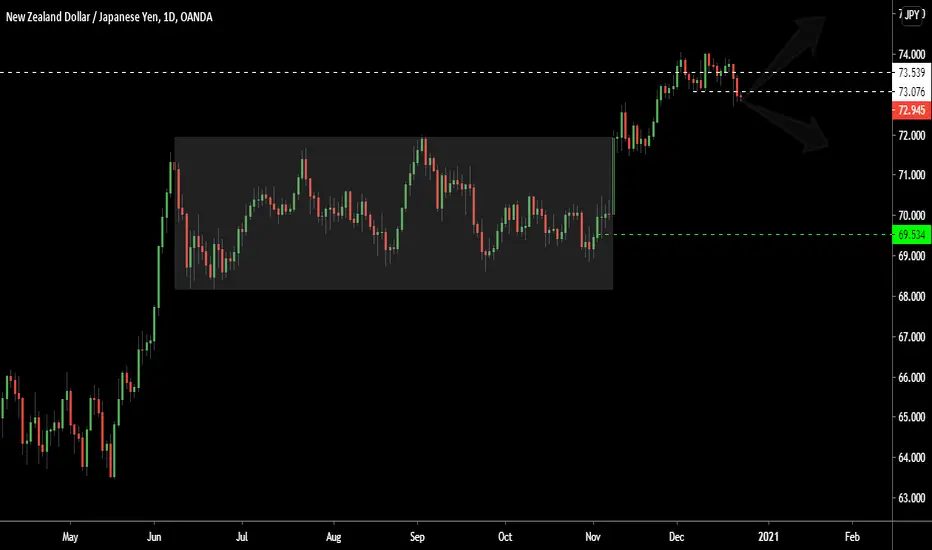
Make or break timeThe currency pair is hovering near a threshold point. Any solid break lower will bring it back into a range state toward the 72 area. If this recent continuation pattern is going to continue it needs to happen sooner rather than later. Broader risk trends like equity markets will have an impact so maybe the next move will be decided by how the stock market closes into the end of the year
Only clear skies ahead?Our range play has turned into a full continuation phase to the upside. We couldn't have predicted this strong of a bounce it has even outperformed AMZN. I could list a series of "fundamental stories" for why it has had a great run but when you trade with a model you don't have any. As long as shop holds above its previous range state and the net up vs down volume stays positive we will continue to hold.

Sell Signal: 1.7188Stop: 1.7300
Looking for the down wave to continue and test recent lows
Ingenuity Trading Model is an algorithm used in- Stock, Forex, Futures, and Crypto markets. The model is a Geometric Markov Model : Focuses on reversal and continuation wave structures
In probability theory, a Markov model is a stochastic model used to predict randomly changing systems. Markov Models are used in all aspects of life from Google search to daily weather forecast. The randomly changing systems we focus on are the equity, futures, and forex markets. The geometric element of the model is the fractal sine wave structure you can find on any chart you look at across any market and across all time dimensions.
Our model focuses on the current sine wave formation (current state)- geometric price formation along with its volume and volatility over a given time period and using that information to predict the future state- future price movement. For questions or more information feel free to contact me in the comment section or via private chat

Potential continuation? The jets etf and many of the airlines within it have broken out of there previous range state and now appear to be in an expansion or continuation phase. If price can hold above 20 then you can imagine the next move for the sector is back toward 2020 highs.

EURGBP 0.90262 +0.02 % SHORT IDEA * BREAKOUT & PRICE ACTIONHey everyone
Here's a look at the EURO / POUND one choppy chart perfect opportunity for aggressive traders and intra-day traders hope everyone is good and you're having yourself a good one, now the EURO / POUND has had some nice volatility coming from all fundamental aspects but the structure was the and the pair was trading in a ascending channel which saw a break and the retest of structure now looking for a continuation of this move, currently trading in a bear flag possibly signalling continuation with the bears,.
many stars must align with the plan before executing the trade, kindly follow your rules.
LET'S SEE HOW IT GOES..
HAPPY TRADING EVERYONE & LET YOUR WINS RUN...
_________________________________________________________________________________________________________________________
ENTRY & SL - FOLLOW YOUR RULES
RISK-MANAGEMENT
PERIOD - SWING TRADE
__________________________________________________________________________________________________________________________
If this idea helps with your trading plan kindly leave a like definitely appreciate it.
HAVE A GOOD ONE!

Double bottom forming in H1 If the second bottom close over the neckline = bullish. If it closes lower (as its right now) = bearish.
still in building phase, things are getting interesting.
If BTC drops, I aim for 618 fib (21 500) to buy the dip.
If it goes up, then everything is possible.
Happy trading (but be careful) XD

Potential bounce? As FXI enters back into its previous range this could be setting up for a continuation to new highs. The previous range was over 4 months and this is the first retest so barring a downtown in global markets the index should at minimum see a bounce

Buy Signal: 213.06Stop: 202.00
Looking for continuation out of range. Another healthcare addition to the portfolio and a non correlated stock to the broader economy


Nested bullishness: Wedge in triangle in a Cup and HandleMuch this should be no surprise to anyone. The cup and handle has been the talk of the crypto town for a while now and you may or may not believe it will perform, but the believe that we are in a bullish continuation pattern exist.
The handle appears to be another bullish continuation pattern, an ascending triangle.
The triangle has a falling wedge which is a reversal pattern. This reversal pattern is backed up by bullish divergence on the RSI and we are at the base of the bollinger band. I have shown another example from November of a time we saw the exact same set up and got almost 10% gains.
Now all of this upside potential occurs after we have the buy signal on the has ribbon. This signal went out all over cryptoverse when it flashed.
Every single one of these structures give you a different target, entry strategy depending on how aggressive you want to be and a stop strategy depending on how aggressive you want to be. The targets on the main chart don't even consider that this is a continuation pattern of a flag pole.
I created this chart because BTC is the benchmark for all of crypto. My biases is crpyto will pamp while bitcoin performs to the flagpole target. From there we will probably retrace and I'll look at buying dips. I am betting ethusd will overperform and since it is a collateral currency on my exchange my gains from margin trading to into there. XRP gives me the x5 and a high percent change so I will be long XRPUSD. I'll look for topping ETH, BTC, and XRP to help me make my decision on when to close.
I have linked some posts with some good calls. A lot of formation have strong predictive utility and you just need the patience to have them perform and that can take a while. The Cup and Handle is one of the most reliable chart patterns according to Bulkowski, and he basically wrote the book on TA. Remember, there is a lot of nested bullishness and will patience targets should get hit but that doesn't mean you abandon stop management or get reckless with your entries, especially with margin and leverage.
Find a system that lets your winners run. If your chart formation busts don't hold like a buster. This is time for fundamentals.

Model Watchlist: Potential continuation wave?WY could see new new 52 week highs if current formation holds. The play would be invalidated below 28.
Ingenuity Trading Model is an algorithm used in- Stock, Forex, Futures, and Crypto markets. The model is a Geometric Markov Model : Focuses on reversal and continuation wave structures
In probability theory, a Markov model is a stochastic model used to predict randomly changing systems. Markov Models are used in all aspects of life from Google search to daily weather forecast. The randomly changing systems we focus on are the equity, futures, and forex markets. The geometric element of the model is the fractal sine wave structure you can find on any chart you look at across any market and across all time dimensions.
Our model focuses on the current sine wave formation (current state)- geometric price formation along with its volume and volatility over a given time period and using that information to predict the future state- future price movement. For questions or more information feel free to contact me in the comment section or via private chat

GORO CONTINUATION LONGEnter at break of resistance and TP at designated area or when price starts stalling / crosses 13 period ma.

nzdcad oversold and ready to exhaust , possible continuationnzdcad broke structure very impulsively without any major pulls, which means the shorts are not ready yet.
so i see a continuation to the upside forming. market seems oversold


GBPUSD in ConsolidationThe annoying thing about being a swing trader is when the price is in consolidation. A lot of patience is needed to wait for the price to continue its trend. The uptrend hasn't ended yet. Let's be patient and wait for the price to continue the uptrend.

Naked Intraday Analysis on AUDCHFHere as you can see the market got to the descending trendline and got rejected by buyers strong pressure.
We are waiting for the continuation at least until the previous high.
Very good risk to reward ( 1:4 ).
Wait to buy from the dips.
CONFIRMATIONS:
--> Descending trendline as support
--> 88.6% Fibonacci level.
--> Indecision candlestick (Doji).
--> Strong bullish pressure

Potential Buy Continuation Sniper Entries Only Trying To Get A Super Setups with Low Risk large Rewards if It Doesn't reach The Horizontal Line to try clear the Old buys Will Not Jump in the opportunity. Going for a Trend Continuation which my bias is saying Longs. Always Check For Multiple Confluences Before taking Trades. Typical Risk per trade 0.5-1% Trying to aim for 1:2RR going to leave 80% To run Try Catch Some Extra Big Movements Will Move Trade To Break Even If It Hits 1st TP Above Structure.

Head & Shoulders Continuation pattern on $RVLV dailyBreakup and test of neckline begins next upswing

Trend continuation with pullbacksIf this MACD crosses up through signal while above zero line within an upwards trend, continuation will take place with minor pullbacks. Look for buy entry and hold.
Watch GBP index as well as DXY for significant reversals that may significantly interrupt the trend continuation

EURGBP Triangle Pattern: Bears BreakoutHi Traders!
Since the month of November started the bears have been in control on higher timeframes. We've seen EURGBP form lower lows and lower highs on most timeframes but recently the market made a strong push up (from point A - 0.88616 to point B - 0.90044) forming a lower high and continuing in the overall market direction. In the last two days the market formed a higher low (point C - 0.89147) and a lower high ( point D - 0.89637) again confirming the triangle pattern on the chart. As we head into this week the market has broken out and retested showing that it is still moving bearish in continuation with the trend.
Thanks for viewing.
Disclaimer: Analysis is subject to market changes.

EURNZD Clean structure break (SWING)Nice, clean and simple. We have the break of a very bearish 4 hour structure.
on the move to the downside, price failed to reach any relevant fib ext targets.
Im looking to the purple zone for scale ins to carry this pair to its final targets 1.74 & 1.72

CONTINUATION PATTERN IN EURCADHere we have an INTRADAY trade with an ABCDE correction pattern for CONTINUATION.
ENTRY: (1.5410 - 20 pips)
STOP LOSS: (1.5430 - 20 pips)
BE: (1.5390 - 20 pips) 1:1
TP1: (1.5370 - 40 pips) 1:2
TP2: (1.5350 - 60 pips) 1:3
CONFIRMATIONS:
1) The market is in general downtrend (trade with the trend ).
2) ABCDE correction pattern for continuation.
3) 1H resistance at the entry point (reversed the previous 2 times at this level).
4) 50% Fibonacci retracement of the drop.
5) 150 EMA works as resistance.
*If the market breaks the TP2, you can extend your take profit target.
**We don't have a clear price action sign so enter with 1/2 risk and if the market drop aggressive in smaller timeframes add on the other 1/2 risk.
