EURJPY - Continuation DownNo major fundamental drivers just some technical review. Lets see if there is momentum to the downside.
Continuation

GBP/USD: Great Continuation Level for Buy PositionThe demand below is a great level for buy position as a continuation position,
It seems the price on its way to reaching the resistance above.
I'll buy at the demand and the target will be the resistance.

NZDUSD Long ComingNZDUSD is forming a corrective pullback within a descending channel aka bull flag. On the fundamental side, New Zealand had their Monetary policy meeting last week which was concluded with no cut in rates and no sign of future cuts on the horizon for the time being which the market took as a hawkish hold. This boosted the Kiwi and after this corrective move it looks set to push higher in the near term. I'm looking for price to continue holding above support and breakout to the upside within the coming week. Great risk to reward. I am not a financial advisor. This is not financial advice. This is for educational purposes only.

{SWC}——PCCS, rally continuation? Thank you for your continued support :)
Strategy: Price Volume Analysis
Bias: Bullish. PCCS suffered from stock price declining in the past one month, the short term down trend seems reversed after the dragonfly doji formed on 3rd feb and the price started to rise. Today, PCCS recorded a big spike with significant volume. The closing price was 0.430, where a Bollinger Band Mid Band breakout was observed. If the momentum sustain, SWC believes there will be a positive movement in near term.
S: 0.425, 0.415
R: 0.450, 0.470

Netflix Breakout to All-Time HighSorry I've been away for a bit. Had personal things to take care of, but I have a lot in store for the upcoming weeks. Let's get right back into it!
In this chart we're looking at Netflix on the 1W chart as price has consolidated into a beautiful symmetrical triangle. Price is currently breaking through the descending boundary and is attempting to confirm breakout after a clear 1W candle close above the $373 area.
This symmetrical triangle has a price target of around $527 for about a ~45.5% gain.
This chart pattern breakout is occurring above the 200EMA, so the probability for price continuing to the upside is even higher.
If you would like to see more of these ideas on a regular basis, follow me as I will be posting many more exciting chances to earn on chart pattern breakouts this upcoming year!
Drop a like or comment if you found this idea informational or helpful in any way!
Cheers!

AUD/USD: Continuation opportunityAUDUSD seems to stay bearish until 0.6600, it is the next fresh demand that we can see on the weekly chart.
The supply above seems like a great continuation level for sell position.
I'll sell at this supply on the first touch and the target will be 0.6600 zones.

Long term View ETHUSDThe Crypto currency in my analysis is now looking very much like its heading north after half a year of south bound travel. I used a lot of tools during the analysis, in order to make the chart easier to understand I have omitted most.

INCREDIBLE BTC Here we go with my first analysis published here on TV, Hello people, i hope you like.
Ok btc closed below the range low close (h4), but now back into the range and above the range high close (h4), this mean 9.8k will be tested.
"THIS IS A LONG SIGNAL"
GOOD TRADING TO ALL

$BTC thoughts 2020Keep it simple
Monthly squeezing pattern
Likely continuation of 10 year uptrend
I'm wrong below $3.3K

LONG - BTC - Trading OpportunityExpecting a retest of the 3D support which makes confluence with the weekly level at 8738, we are going to long with 3 layer and a tight stop loss.
Layers: 8758 , 8856 , 8936.
Average entry: 8850
TP 1: 9324
TP 2: 9769
TP 3: 10039
TP 4: 10399
SL: 8684
CryptoCue is not providing investment advice and is not taking subscribers’ personal circumstances into consideration when discussing investments. Investment involves a high degree of risk and should be considered only by persons who can afford to sustain a loss of their entire position.
CryptoCue is not registered, licensed or authorized to provide investment advice and is simply providing an opinion, which is given without any liability or reliance whatsoever. The information contained here is not an offer or solicitation or recommendation or advice to buy, hold, or sell any security. CryptoCue makes no representation as to the completeness, accuracy or timeliness of the material provided and all information and opinions provided by CryptoCue are subject to change without notice and provided on a non-reliance basis and without acceptance of any liability or responsibility whatsoever or howsoever arising. You hereby irrevocably and unconditionally waive, release and discharge: (a) any and all accrued rights and/or benefits you may have against CryptoCue in respect of any opinion expressed or information conveyed by CryptoCue at any time; (b) any and all Claims you may have against CryptoCue arising out of any opinion expressed or information conveyed by CryptoCue at any time; (c) CryptoCue from all and any claims (whether actual or contingent and whether as an employee, office holder or in any other capacity whatsoever) including, without limitation, Claims you may have against CryptoCue arising out of any opinion expressed or information conveyed by CryptoCue at any time. ("Claims" shall include any action, proceeding, claim, demand, judgment or judgment sum of whatsoever nature or howsoever arising.) You hereby agree to indemnify and hold harmless CryptoCue in respect of any and all Losses paid, discharged, sustained or incurred by CryptoCue in the event of bringing any Claim against CryptoCue. (“Losses” shall include any and all liabilities, costs, expenses, damages, fines, impositions or losses (including but not limited to any direct, indirect or consequential losses, loss of profit, loss of earnings , loss of reputation and all interest, penalties and legal costs (calculated on a full indemnity basis) and all other reasonable professional costs and expenses and any associated value-added tax) of whatsoever nature and/or judgment sums (including interest thereon).

GBPCAD - Long off the 0.618 Fib GBPCAD - Long off the 0.618 Fib
GBP is still strong again the CAD and in an upward trend even with the big GBP sell off after comments form Boris on UK trade deals
Still waiting for an Entry signal however

EUR/AUD - LONG - 2. FEB. 2020High chance of correction followed by the continuation of an impulse to the weekly trendline
"Comment", "Like" and "Follow" are appreciated! Have a great week everyone!

GBP/CAD - LONG - 2. FEB. 2020High chance of correction followed by the continuation of an impulse to the previous resistance.
"Comment", "Like" and "Follow" are appreciated! Have a good day everyone!

Retrace to $9150 before continuationThe beautiful bullish hammer yesterday evening gave way to a 4% move overnight with BTC closing the day nicely above the 200 Day MA (1200 here on the four hour in orange).
It met resistance at $9400 which is unsurprising since this has been a very significant level for months.
I would not expect us to simply smash through from here since a little more of a pullback is needed for any bull worth their salt to enter a trade.
An area of high confluence is the 0.5% line of this most recent move, which also clusters up nicely with previous support, the EMA zone, and the .236 line of the bigger move of the last several days. Expect to see a strong reaction at around $9150. This chart shows how a long setup could look.
However it is pretty conceivable that BTC needs to correct a lot further before breaking through this significant resistance. We have many CME gaps still unfilled. This could lead to some kind of cup and handle forming. However outlook seems bullish ahead of the halving in May.

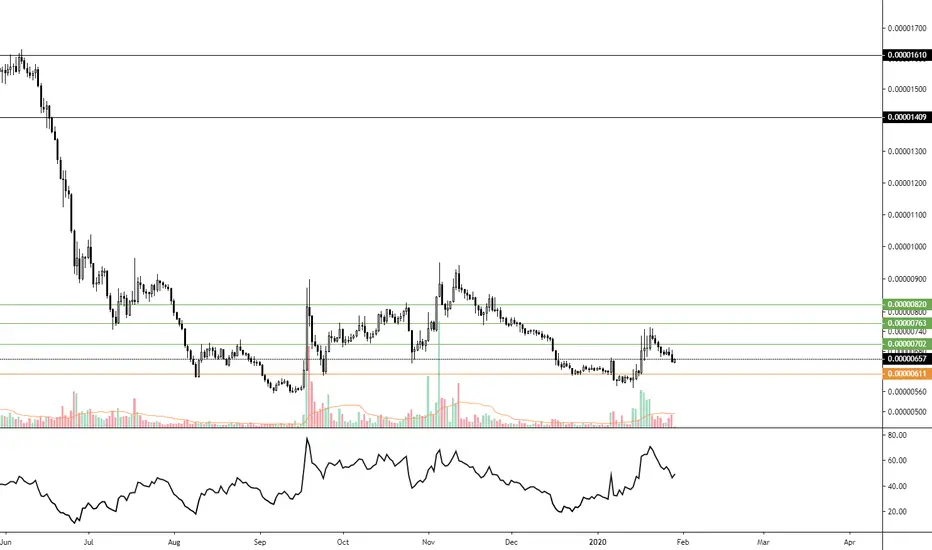
LONG - XLM- Trading OpportunityA retest of previous bullish divergence breakout, looking into watching this develop.
Entry: 0.0000657
Target 1: 0.00000702
Target 2: 0.00000763
Target 3: 0.00000820
SL: 0.00000611
CryptoCue is not providing investment advice and is not taking subscribers’ personal circumstances into consideration when discussing investments. Investment involves a high degree of risk and should be considered only by persons who can afford to sustain a loss of their entire position.
CryptoCue is not registered, licensed or authorized to provide investment advice and is simply providing an opinion, which is given without any liability or reliance whatsoever. The information contained here is not an offer or solicitation or recommendation or advice to buy, hold, or sell any security. CryptoCue makes no representation as to the completeness, accuracy or timeliness of the material provided and all information and opinions provided by CryptoCue are subject to change without notice and provided on a non-reliance basis and without acceptance of any liability or responsibility whatsoever or howsoever arising. You hereby irrevocably and unconditionally waive, release and discharge: (a) any and all accrued rights and/or benefits you may have against CryptoCue in respect of any opinion expressed or information conveyed by CryptoCue at any time; (b) any and all Claims you may have against CryptoCue arising out of any opinion expressed or information conveyed by CryptoCue at any time; (c) CryptoCue from all and any claims (whether actual or contingent and whether as an employee, office holder or in any other capacity whatsoever) including, without limitation, Claims you may have against CryptoCue arising out of any opinion expressed or information conveyed by CryptoCue at any time. ("Claims" shall include any action, proceeding, claim, demand, judgment or judgment sum of whatsoever nature or howsoever arising.) You hereby agree to indemnify and hold harmless CryptoCue in respect of any and all Losses paid, discharged, sustained or incurred by CryptoCue in the event of bringing any Claim against CryptoCue. (“Losses” shall include any and all liabilities, costs, expenses, damages, fines, impositions or losses (including but not limited to any direct, indirect or consequential losses, loss of profit, loss of earnings , loss of reputation and all interest, penalties and legal costs (calculated on a full indemnity basis) and all other reasonable professional costs and expenses and any associated value-added tax) of whatsoever nature and/or judgment sums (including interest thereon).
AAON Breakout to All-Time HighIn this chart we're looking at AAON on the 1D chart as price has consolidated into a rectangle. Price has broken out through the horizontal boundary at $52.50 and has confirmed the breakout by breaking through the $53.29 area.
This rectangle has a price target of around $61.67 for about a ~17.5% gain.
This chart pattern breakout is occurring above the 200EMA, so the probability for price continuing to the upside is even higher.
If you would like to see more of these ideas on a regular basis, follow me as I will be posting many more exciting chances to earn on chart pattern breakouts this upcoming year!
Drop a like or comment if you found this idea informational or helpful in any way!
Cheers!

SWN Breakdown to New Local LowsIn this chart we're looking at SWN on the 1D chart as price has consolidated into a rectangle. Price has broken down through the horizontal boundary around $1.78 and has confirmed the breakdown after printing a 1D candle through the $1.73 area.
This rectangle has a price target of around $1.11 for about a ~37% gain.
If you would like to see more of these ideas on a regular basis, follow me as I will be posting many more exciting chances to earn on chart pattern breakouts this upcoming year!
Drop a like or comment if you found this idea informational or helpful in any way!
Cheers!

PKI Breakout to All-Time HighIn this chart we're looking at PKI on the 1W chart as price has consolidated into an ascending triangle . Price has broken through the horizontal boundary around $98. After price prints a 1W candle through $101.28 breakout will be confirmed.
This ascending triangle has a price target of around $125 for about a ~27% gain.
If you would like to see more of these ideas on a regular basis, follow me as I will be posting many more exciting chances to earn on chart pattern breakouts this upcoming year!
Drop a like or comment if you found this idea informational or helpful in any way!
Cheers!

USD/CHF: Great Continuation Level for Buy PositionHigh probability that the price tends to reach the supply above.
Below us, there is a great demand for continuation trade,
I'll buy at this demand and the final target will be the supply above.

AUD/JPY: Great Continuation LevelAs we can see in the H1 chart, the price changed the momentum to bearish.
It seems the price now tends to reach the demand below.
At the moment, the price gets really close to touching the supply above which is a great level for sell position.
I'll sell at this supply at the first touch of the price and the demand below will be the final target.

NVO Breakout to All-Time HighIn this chart we're looking at NVO on the 1W chart as price has consolidated into an ascending triangle . Price has broken through the horizontal boundary around $58. After price prints a 1W candle (1 day left) through $59.77 breakout will be confirmed.
This ascending triangle has a price target of around $85 for about a ~46% gain.
Price has good momentum as it has found support on the 200EMA and is breaking out of its chart pattern boundary well above the 200EMA.
If you would like to see more of these ideas on a regular basis, follow me as I will be posting many more exciting chances to earn on chart pattern breakouts this upcoming year!
Drop a like or comment if you found this idea informational or helpful in any way!
Cheers!

EURAUDWe caught EA shorts up to, now we are eyeing pull back continuation opportunities to the downside!

$BDX Breakout to All Time HighIn this chart we're looking at Becton Dickinson & Co on the 1W chart as price has consolidated into an ascending triangle . Price has recently broken through the horizontal resistance around $263 with a strong weekly candle. Breakout was confirmed after price broke through $271. I just came across this company's stock this weekend, so I missed the initial breakout. Even though the initial breakout was missed, we had a small pullback and then another strong weekly candle to show this instrument has strength. There is still plenty of upside to be taken advantage of.
This ascending triangle has a price target of around $319 and we have already seen a small pullback before what seems to be continuation to the upside.
Nonetheless, if we see another larger pullback, I expect price to find support on the horizontal chart pattern boundary around $263.
If you would like to see more of these ideas on a regular basis, follow me as I will be posting many more exciting chances to earn on chart pattern breakouts this upcoming year!
Drop a like or comment if you found this idea informational or helpful in any way!
Cheers!
