BTCUSD - Bull FlagIf this lower time-frame Bull Flag breaks North as expected we should hit the next target between $9,800 - $10,000. Over another $1,000 from where we are now. The Flag pole was quick and strong which usually indicates there will be a continuation. We don't know when or where it will break along the top of the flag, but we do know by the length of the flagpole that the move should be at least $1,066 to the next target.
Let's see if it plays out.
Full Disclosure: Yes, I'm still very, very, very long.
Good luck!
Continuation

BTCUSD - Bull FlagIf this lower time-frame Bull Flag breaks North as expected we should hit the next target between $9,800 - $10,000. Over another $1,000 from where we are now. The Flag pole was quick and strong which usually indicates there will be a continuation.
Let's see if it plays out as expected.
Yes, I'm still very, very, very long.
Good luck!

BTC Bullish Continuation Pattern?! Big Move Soon!- Price contraction after bullish impulse up forming. Large move will take place on confirmation to up or down. Here are the simple measured moves for each.
Not financial advice just my own charting opions for entertainment only.


USD/GBP - One of Two MovesUSD/GBP = Overall the pair is in an uptrend according to monthly timeframe. Price is approaching a major key level. Price action suggests strong bullish movement. Overall I think bulls will tire at the key level and consolidate at this level. Price will then either do one of two things. 1st: Continue past the key level and further move up to the monthly uptrend line and once price hits Bears will take over immediately push price down heavily. 2nd: Once price hits the above key level consolidation will occur at this level for a bit and make a smooth transition down to the neckline of what could be a "double top". I think there is a high chance of price consolidating for a 2nd time; breaking the neckline, retesting and then move down with some momentum. Hopefully one of the two predictions will be correct in 2019. Happy trading and good luck profit hunters.
Trading Journal #7
-Austin S.

Trading styles. Part 3/5. Trend continuation breaks.Buying breaks / continuation in bull markets this strategy is usually a little "slow", but often winners the problem is it can go back before going up so a tight stop loss is likely to get hit often even when being right, in bear markets moves can be violent.
Those I can think of
* The triangle / flag pattern / falling wedge
These have always worked and still do. Pretty decent. Works really well on Bitcoin up to now.
This is my first post on trading view, I was still an innocent young buck (just kidding this was barely over 1 year ago)
Another one on Bitcoin, I bought before the break in the green area at the bottom because I just knew (market was extremely manipulated at that time & they showed me their hand), but a regular break buy at 9750 with a stop at 9150 (below swing low) and getting out at 11000 after resistance was rejected was still a reward to risk ratio of 2. Those continuation patterns carefully selected are wins at least 50% of the time. You do the math:
An example on gold
* The inside bar break
Some examples
You know what asset high timeframe trend following inside bar breaks have worked great with?
* Supply & Demand area breaks
I really do not know if this works. Literally 0 experience.
I do not like it. The idea joining the low timeframe trend and going against the higher timeframe one.
Not my thing. It may work, it certainly works under the right conditions and everything.
Going to throw some examples but these are just that.
(Shorted at the top btw - chart is reversed)
Here is a similar one on copper, retraced in supply area, then broke above actually pretty strongly but did not go very far and reversed:
(Shorted at the top btw)
My favorite stock here:
Bitcoin again:
Stock market 2016:
Such a strategy (buying supply area breaks) might work. I believe the odds are in your side if you don't or at worse just miss out, don't go buy once we are below demand area of course, but not short either; And vice versa.
Novice buyers buying because their 6 month lag indicator tells them too? LOL.
Ok these are the 3 types I know. I think this is it?
The head and shoulder being a reversal kind of break it is not described here.

Bearish Flag - Trend continuationOn the 4H chart, the pair is testing the previous high (PH) line and could potentially see the final wave of the bearish flag (possibly
test 110.60 or the R1 level,110.913) before the bearish breakout. Key confirmation area before trading would be if the pair broke the PH and the EMA,50.
After that confirmation, the trade set up
- Entry position: PH(110.228)
- S/L : 110.620
- TP 1: 109.90
- TP 2:109.625


Inverted Head and Shoulders as a continuation pattern ?Watch the moving average crossovers and the break of the neckline.. could get interesting

BIG 3 INDICATOR SHOWS THE PATHBig 3 Indicator helps determine retracement and continuation moves
Ma's and colored background helps visually see the ebb and flow of price
PM me & will help with any questions you may have


GOLD (XAU/USD) 4-HOUR TIMEFRAME SHORTThe price for gold is moving in a downtrend, making lower highs and lower lows. Price just made a bear flag pattern, and broke out of it. We should probably see a continuation to the downside since the correction has seemingly ended. If this setup is validated, prices should rock-bottom to the 1270 area. Remember, always take your profits earlier when they come.


Daily Market Analysis - BTCThe market exploded last night up to $192.01B. Dominance quickly followed and is up to 58.97%. The price of Bitcoin is at ~6400.
The price broke to the topside of the rising wedge confirming a continuation pattern. The next key levels of support are 6300, 6100, and of course 6000.
The RVI indicates high levels of volatility, but it also tells us that price action has elevated levels of momentum.
This is further confirmed by the ADX, which is sitting at 43, and that tells us the strength of the trend has legs to it.
Increasing momentum, volume, and volatility can lead to dramatic price swings.
At this point. There are market participants who are beginning to feel FOMO and hype buying into the price. These indiviuals wish they had been buying at 3.5-5.5k.
This is further driven by the fact that institutions such as Fidelity announcing their plans to roll out Bitcoin trading in the coming weeks.
In addition, the exchange, Bakkt, which is run by the NYSE owner, Jeffrey Sprecher, and partnered with Microsoft and Starbucks, has been working to launch their platform before the end of 2019.
These variables could lead the price to bubble up between 6700 - 8000, the next two point of major resistance.
Although I do not like predicting large movements, in the cryptocurrency market, there have been many times the price of Bitcoin has moved $2,000 in less than an hour of time. So, it's not impossible.
As always, trade safe!

USDCHF Trading Plan Naked Chart Education1. Sideway at Supply Zone (DISTRIBUTION)
==>> Place Sell Limit at resistance zone
==>> Stop loss should be 30-50pips above shadow
==>> BIG LOT advice = you must know how big your capital is and risk with lot equivalent to 100 pips
2. Breakout Tips (For Short Scenario on this USDCHF)
==>> Wait until break confirmed with new Lower Low
==>> 25% CHANCE price will continue its drop
==>> 25% CHANCE price will retrace and form Drop (Breakout) - base - rally (FTB First time back) - base - drop (elliot Wave correction)
==>> 25% CHANCE price will form Drop - Base - Drop
==>> 25% CHANCE priice will Break lowest low then Rally up again canceling bearish scenario (Fail to Break / manipulation / SL Hunter / Take Pending Order)
3. COMPRESSION / CONTINUATION
==>> its similar to these patterns = FALLING/RISING WEDGE, DESCENDING/ASCENDING TRIANGLE
==>> when price retrace or forming corrective move, that means Price already comeback to S/D to take Pending order and those areas considered as CLEAR no order placed again
HENCE there is no significant support/resistance and BIG DROP or Rally Likely are likely happen..
GoodLuck, Take your time to study MARKET BEHAVIOUR to refresh your mind and get clearer perspective what is market telling you....

Continuation Level At 0.50 Fibonacci On GBPUSD 07/05/2019In this 4H chart, we can see that GBPUSD is in bullish momentum, it seems that nothing can stop the price at least until the price will reach the resistance above, we can see that the demand Below is also the 0.50 Fibonacci level of the recent uptrend, the combination of the demand and the 0.50 Fibonacci makes that level a great level for buy position, the resistance above will be the Final target for this buy position, this opportunity relevant for swing forex traders.

Long at new support... BTCUSDBTC has formed new support, I'm longing here with a stop at 5828.
Damn this has been fun :)

XAUUSD Bulls Incoming >>From this analysis, we can see a bullish falling wedge has formed with a double bottom at support. This is giving me confidence for a strong bullish movement incoming.
Confirmations of Long Entry
Falling wedge
Daily Impulse Correction
Double bottom at support with the neckline at resistance
Break and retest of a double bottom or trend line for entry

BCH/BTC - retrace before continuation upwardsMy expectation for price action is indicated by the thin green and red arrows.
Blue triangle indicates the current range.
The large dotted green arrow indicates the overall trend.
Green box is buy.
Red box is sell.
Blue line indicates major support/resistance identified by the fib channels.
Green & Red lines indicate t/p.
Black dotted lines are fib retracements.
Thick white lines are fib channels.
The green arrow indicates the overall trend.
This is a log chart.
This is not financial advice. All charts shown on my page, including this one, are just for fun.
If you enjoy my ideas please give this post a like and follow my page if you would like to see future posts! :)

BTC/USD - what now?This setup looks similar to what BCH did before its 40%+ pump at the beginning of April. I expect a pullback to one of the lower green boxes before continued upside.
Blue triangle indicates the current range.
The large dotted green arrow indicates the overall trend.
Green box is buy.
Red box is sell.
Blue line indicates major support/resistance.
Green line indicates t/p.
This chart is made with fib channels.
This is a log chart.
This is not financial advice. All charts shown on my page, including this one, are just for fun.
If you enjoy my ideas please give this post a like and follow my page if you would like to see future posts! :)

BTC - Coinbase TriangleIs this Coinbase Triangle like the Bermuda Trianlge? A place where bad calls go to disappear?
Place your bets and take your chances.....

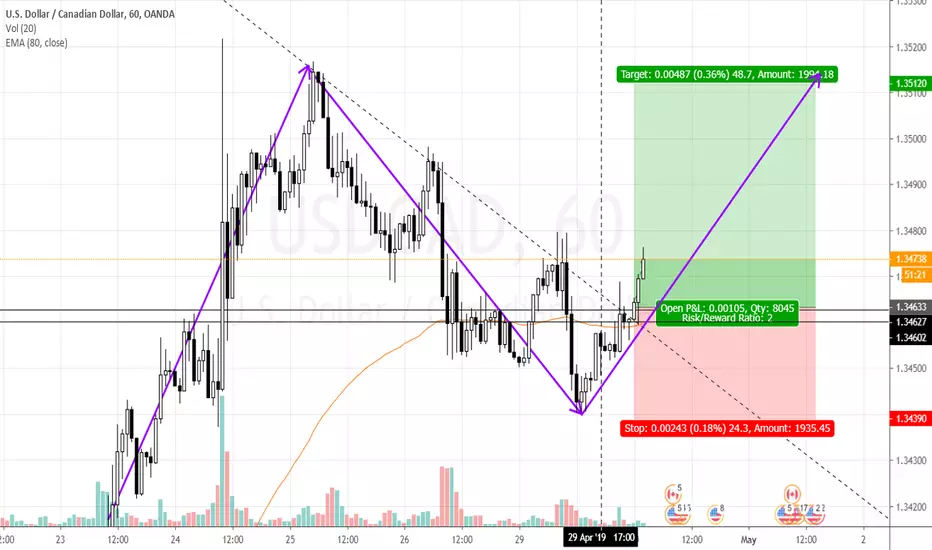
USDCAD ripping up!Price moved really quickly from my entry...
Analysis
-USDCAD looking bullish after showing signs of a breakout, pullback and continuation play. Buyers pushed price significantly past resistance wherein sellers came in and pushed it back down into resistance turned support.
The price action resulted in a daily spinning top setup AT SUPPORT before the daily candle close which is a bullish sign.
-On the 1H time frame, price just broke a bearish (correction) trendline to the upside.
-The reward/risk is good for the setup (given the distance between daily S/R levels)
Entry, Stops and Targets
-Long Entry: 1.34633 (Enter long after price pulls back, never chase a trade)
-Stop Loss: 1.3439 (Set stop below the daily reversal candle or swing low on the 1H chart)
-Take Profit: 1.3512 (Set target at a minimum of 2 times your stop, depending on entry)
= 2R
*Trade Safe and trade at your own discretion!*
BTC setting up for a move next weekWe've been grinding up against this tredline for awhile now, and if we can start off strong Monday I think we could see some nice volatility. BITFINEX:BTCUSD has also printed a nice consolidation pattern since the movement in the beginning of the month; these patterns are also known as continuation patterns, and as the name would imply they continue the movement of the previous trend.
The KRAKEN:USDTUSD broke on the 25th, and we had a 4.82% drop, but the .618 fib held us up nicely.
Looking at a trend line from a longer standpoint, we can see that BITFINEX:BTCUSD is coming to the end of a much larger trend, will we break up or down is the big question.
