GBPJPY | Short Position ContinuationAfter the previous analysis, we can see how GBPJPY entered the consolidation area before the continued drop. I am looking for further downside with my current short positions.
Continuation

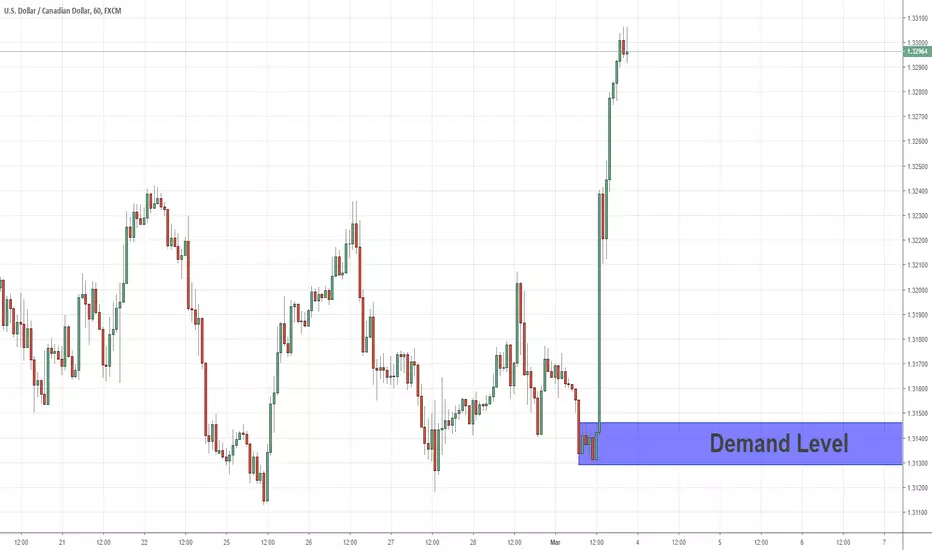
Continuation Demand Level For USDCAD 03/03/2019The USDCAD created a new fresh demand below, as we can see the price made a great rally from that demand, for now, it seems the price on his way to reach 1.3600, if the price will back to visit the demand below, I'll buy there and my target will be 1.3600 zones,
EURUSD LONG continuationAs described in the related idea, i think we can get to the green Trendline. But now we seem to have another ascending counter trendline to support the idea.
We have just retested the current support after a break, i think it could be a good re entry

GBP/USD - Uptrend Continues?Hello traders,
GBP/USD is bullish and we are looking to enter the uptrend on trendline and 0.5 FIB Level.
As always we only enter the trade after confirmation (bullish) price action.
We have a 3.05 risk/reward wich is good and good technicals also.
Dont forget to leave a like if you like this analysis!
Rodrigo FAC


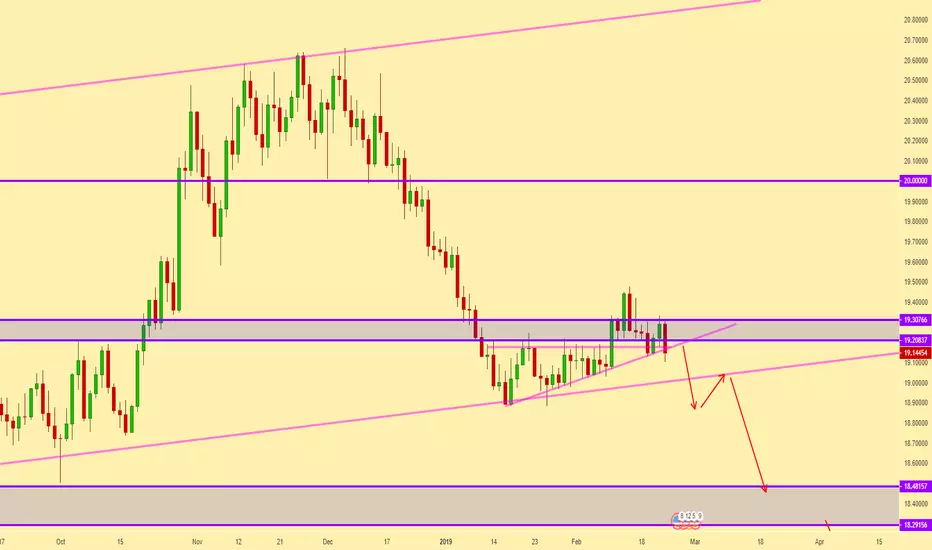
Short USDMXN inside monthly swingHi.
looks like USDMXN in a critical zone and the last daily upswing failed to comntinue after hitting very important resistance zone .
The purpose of this idea is to be aware of the potential big move ahead of us .
personally My plan is to take short using intraday techniques but you can use your own and take advantege from this big move .
best of luck :-)
BTC: Possible Bearish Continuation PatternBasic Trading 101
- Bearish pennants are continuation patterns that mark a pause in the movement of a price halfway through a strong downtrend.
- They occur just after a sharp drop in price and resemble a triangular flag as the price moves sideways, making gradually lower highs and higher lows.
- The downtrend then continues with another fall in price.
BTC seems to be forming a bearish pennant.
If Bitcoin breaks upwards from this pennant, we could expect the price to retest the 200 Exponential Moving Average.
If not, it could drop down the the blue area of the chart.
Looking at the 1 hour time-frame, we can see a bearish divergence on the RSI, indicating the possibility of a price drop to the lower line of the pennant, which would further indicate the validity of a Bearish Pennant.

GBPJPY - Long - Daily Chart - MACD Continuation TradeEntering on a bullish MACD cross while ABOVE zero-line , signaling bullish continuation.
Note that I use MACD ONLY for continuation and do not attempt to find reversals using the MACD as I do not find it to be very accurate in FX
Trade is on the daily timeframe and has a 1 ATR stoploss (148 pips), 1ATR target 1 where I take 50% of my position off and move stop to breakeven, then I use a trailing stop following the other 50% of my position setting my stop at the low of each subsequent daily candle that continues higher. These trades can take many days to play out and I often hold over the weekends, do not take this trade if you struggle to control your risk or are uncomfortable holding for weeks at a time.
I expect this setup to go against me over the next few days as this was already a strong move up and may need to cool off for a day or 2, I expect to hit profit targets sometime next week but don't trade based on time.
It is also important to note that I normally allocate up to 1.5% account risk on continuation trades however I do not risk over 1% when I trade GBP (due to the fundamentals around Brexit). A similar trade to this could also be expressed by shorting EURGBP although that pair has not made a signal on the indicators yet and is most dramatically news driven.
The historical probability of MACD continuations on the top 20 fx pairs (with my 1ATR parameters) is around 68%, please perform your own backtesting of this strategy as you can achieve higher or lower probability results using different stop losses and profit targets.
Best of luck traders.

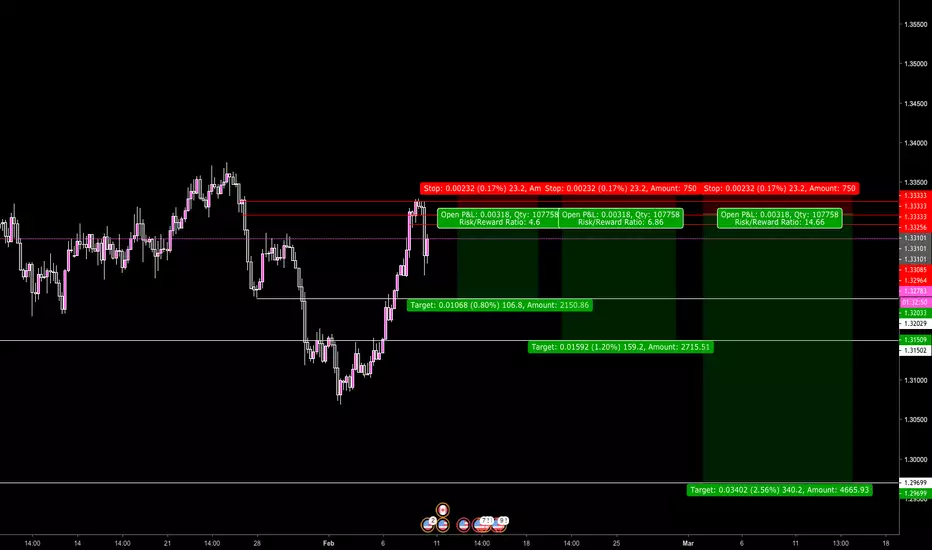
USDCAD short setupUSDCAD could not break higher, continued downtrend to be expected. Short orders are set at retest of the lower high. Targets at white lines.
DXY could continue long, following his bullish trendline/channelDXY just broke resistance, it's respecting a bullish trendline and bullish fan.
As this is a big bullish trend, we should expect it to retrace to Fib Retracement level 23.6 and continue his way to at least 97.40
Watch out for Sells in xxxUSD, buys in USDxxx and XAUUSD (Gold) short.


Continuation Supply Level In USDJPY 31/01/2019As we can see, the supply level I marked on the chart is a new fresh one, the price drop from that level which indicates on unfilled orders still waiting there, Therefore, if the price will That supply I'll sell there, my final target will be at 105.50 zones,


Demand Level For Buy Position In XAUUSD 27/01/2019After a long stamping, the price finally broke out the resistance at 1297.00 zones and creates a new fresh demand which I marked below, it seems the price tends to reach the supply Level from the left at 1315.00 zones, we can see that on a daily chart, the demand below is a great continuation level of buy position, as long as the price didn't reach 1315.00 zones, I'll Buy at the demand below and the target will be 1315.00 zones,

Demand Level For Buy Position In XAUUSD 27/01/2019After a long stamping, the price finally broke out the resistance at 1297.00 zones and creates a new fresh demand which I marked below, it seems the price tends to reach the supply Level from the left at 1315.00 zones, we can see that on a daily chart, the demand below is a great continuation level of buy position, as long as the price didn't reach 1315.00 zones, I'll Buy at the demand below and the target will be 1315.00 zones,

REV Symmetrical TriangleMarket order placed to go long with REV anticipating a continuation symmetrical triangle formation with a nice risk / reward.
If the lower boundary of triangle is broken decisively at a day close the analysis will be falsified.
1. Taking a position here before the next rally with anticipation of a breakout.
2. If the next rally bounces off upper resistance of triangle formation, this gives an opportunity to take profit and wait for bounce confirmation off the lower triangle boundary.


ETC 10% Short - Trend continuationETC got rejected by EMA100, bearish sign and downtrend continuation.
SELL now, buy back in the zone :)

Long Term Destination For EURUSD Based On Supply & Demand 10/01As a price action forex trader, my trading decision based mostly on Supply & Demand, the EURUSD now is bullish, and if we look at the daily chart, we can see that the next supply is Waiting at 1.1720, therefore I believe the price will tend to reach there, in order to join this bullish momentum, I'll wait for the price at the new fresh demand below, this demand is a Great continuation level for buy position, my target will be 1.1720 zones.

A false breakout in SMHSMH has falsely break out of the 98 double top resistance level on the back of some positive general market sentiment.
However, the break was short lived and it has been quickly auctioned back into the old trading range.
A false pattern is a powerful pattern in itself as a failure at one side of the range tend to fuel move to the other side of the range. Now I am eye it to break the 88 major support and open doors to a much bigger move to the down side.
The massive contracting triangle at the high would imply at least two legs down. Now we only have seen the first leg. The break of the 88 support would be the beginning of the second leg.
