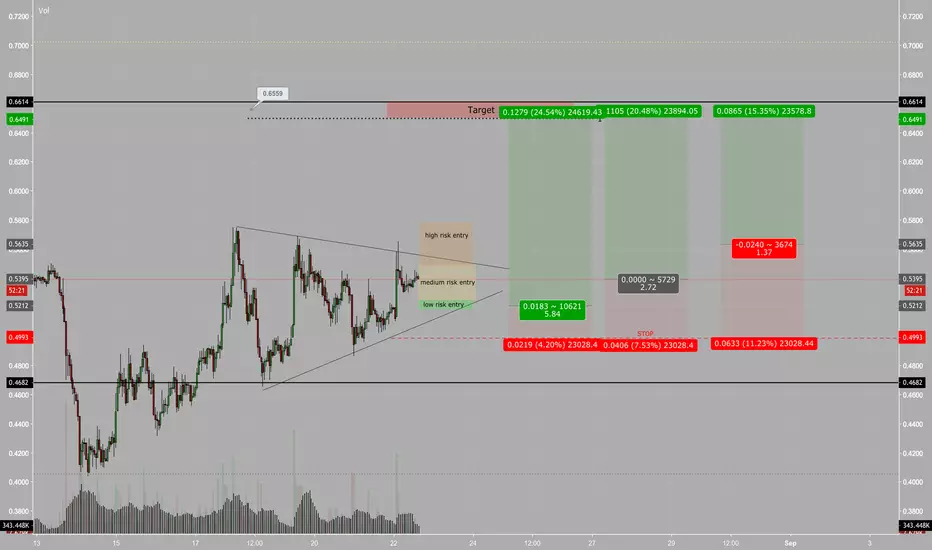
IOTA TRADE SETUP - SHOWING DIFFERENT ENTRY STRATEGIESHi guys, been a while.
IOTA just had its first initial impulsive leg up after a downtrend and is forming a continuation pattern. In this pattern i have layed out three different areas where you could go long with respectively their risk to reward ratios. As you can see the best entry is the one closest to the baseline of the triangle, but it doesnt reach this level too often. Depending on how aggressive / conservative you are as a trader, you choose at which point you would like to enter. Breakout trades are usually high in risk, but when done properly can give a higher succes rate.
Im looking to go long at the low risk level obviously, but when iota breaks out before it reaches that, i would take a smaller position size long at higher prices.
good luck
Continuation
inverted widening triangle, continuation of trend, read more-->as for right now indicators showing a very bullish signal on daily, rsi overbought rsi stoch bottom
However this time its better not to folow these view indicators as sentiment is overruling in favor for the bears.
regardless i think we are in a inverted widening triangle pattern, wich often leads to continuation of the trend, in this case downwards
we found a bottom at D sitting at the price of 5860 & just hitting the longer term support of previous bottoms at this zone marked as green
i am expecting bitcoin to move to 6.5k zone, 2 reason for that is daily rsi and stoch reset, it needs to get out of the oversold territory before
going down more, 2 it would fit in the pattern we discussed above here.
if this pattern finishes i do say we drop down more to the 5.3k zone were bitcoin can find some strong supports back from 2017,
it also puts bitcoin back to a spot before the big parabolic move started, so im tempte to say that this is as low as we will get this year for bitcoin.
if you like this idea please thumb up and follow me ;)
much appreciated!

Long-Terms Key Levels NZDUSD 14/08/18At the long terms, the NZDUSD pair is bearish.
It seems the price tends to reach 0.6350 zones.
The supply above seems like a great continuation level to join
This bearish momentum, if the price will hit that supply I'll sell there.
My target will be 0.6350 zones.

EURGBP LongRejection on support (pinbar 4h) could indicate trend continuation. Target is retest of previous high.

Day Trade Opportunity EURUSD 07/08/18EURUSD has created a great demand level below,
This demand can be a great continuation level of buy
Position as a day trade opportunity, if the price will reach
That demand I'll buy there, my target will be 1.1600.
The5%ers Proprietary Trading Fund will double your trading balance every 10% profit.

EURUSD 4H RANGE TRADESPair may be in a Bearish continuation breakout
Support levels shown
Sell Stop @ 1.1599
Sell Take Profit 1 @ 1.1586
Sell Take Profit 2 @ 1.1552
Place your own SL
Bearish continuation may fail
Price will move back into range
Buy Stop @ 1.1635
But Take Profit @ 1.1675
Place your own SL


KEEP IT SIMPLE!- ACCUMULATE IN KEY SUPPORT RANGE (7.0-7.3)A bottom for the year was established in July with the confirmed cup and handle followed by bull flag continuation formations that played out, with this in mind for maximum R/R, accumulation in area of price consolidation/excess demand in range of 7.0 and 7.3 - which corresponds with the right lip of the cup which represents significant support. Price bias should on the whole remain bullish until bearish pattern and confirmation is occurs.

EURCAD - S/R entryE-Wave asserting its presence here as we move beyond corrective wave C and enter continuation wave 2. Look to S/R (blue) for trend confirmation.
Look to commodities for more insight.

ETP easy win ! 10%Hello cryptoshaggerz,
Despite BTC drop earlier today, ETPUSD is still bullish as hell. It broke the previous top (2.13) and made a higher high.
It's now evolving in a short term ascending channel (starting July 26th).
If this channel holds, we AT LEAST, expect it go and test 2.3 (previous support becoming resistance) or 2.4 previous high.
Buy when u want, sell when u want, let's ride it.
NOT TRADING ADVICE, DYOR Shaggerz


Continuation Level EURJPY 27/07/18For the long terms, the EURJPY tends to reach 132.80.
After the current retracement, I'll look for buy position in order
To continue the bullish momentum, below there are 2 demand levels
Which can be a great continuation level for buy position, I'll buy at the
Demand below and if the price will break that one I'll buy again at the
Bottom one.

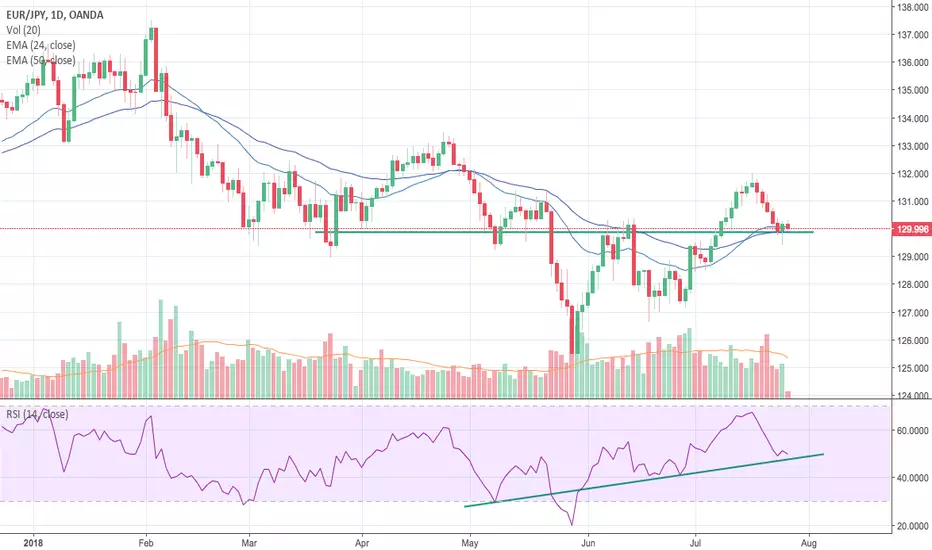
EUR/JPY Pullback with PinbarWe can see here on the daily that the EUR/JPY pair is looking at a nice set up for a continuation of it's recent break-out.
After forming something of a bottom it has broken out above previous resistance then pulled back making it new support.
We also have a lovely text book Pinbar candle that's wick crosses over the previous resistance (now support). This tells us that the new support is quite strong and there is more buying on the horizon.
Full disclosure, I am waiting for a stronger signal on the 1 hour to get an entry. I would like to see the 1 hour chart start to break-out again from here.
The RSI is also starting to trend up showing more strength to our bullish bias.
I am bullish on this but I am waiting for more confirmation before I pull the trigger.
I'm not a pro and I'm not suggesting you buy or sell. Just sharing my observations and making myself accountable!
Enjoy and trade smart!
JWB