ETH short term downtrend continuationIn coorelation to BTC, LTC, XRP and XLM, there is a significant downtrend. As shown on the chart, the two continuation candles show selling pressure. The two candles also bounced at support/resistance lines, which made them important.
In addition, there is a descending triangle looking to break downwards. Targets are indicated by the yellow arrows.
Continuationpatterns


GBPJPY D1- Continue Rectangle or Bullish Dragon Pattern?GBPJPY D1- Continue Rectangle or Bullish Dragon Pattern?
Currency Pair: GBP.JPY
Time Frame: Daily
Predicted Direction: Neutral
- Price bounced several times within PCZ
Entry:
I will open Sell if the price will make breakdown of @138.74 (SL = @141.41, TP = @130.59)
I will open Buy if the price will make breakout of @141.41 (SL = @138.74, TP = @148.73)
GBP.JPY updates will be available in the comments section below.
The brief trade analysis presented above is my predicted direction and requires multiple different indicators and confluence factors prior to validating a trade opportunity.

[ETHUSD] Descending Triangle Short Potential $75 TargetETH is back at it again. The small relief rallies we have seen off of the massive drop, all the way down to the low $80s, have started to become confirmation points for forming an upper bound of yet another descending triangle pattern. As you can tell in the chart, every rally has been stuffed off of the 100 ema (orange line), and while the bulls have mustered significant volume they cannot manage to hold any ground they have gained. The large hourly green candle with the spike of 84 to the 104 wick was a strong attempt from the bulls to regain control over the market. Unfortunately this candle wasn't met with additional buying volume and we can see the resulting negative price consolidation that followed. The bulls really needed to rally around that spike if they wanted the chance to continue driving the price up.
Unfortunately it looks like the bulls are just running out of steam to continue pushing a bullish trend. The 100 ema is a huge point of resistance. As we can see here the 100 ema is starting to coincide with the formation of the upperbound of a potential descending triangle.
A descending triangle pattern is a clear continuation pattern which, if confirmed, would suggest that ETH has further to fall before we can look for a solid bottom to start a long-term rally.
I am hoping to see another pump up to test the 100 ema resistance, this is where my target entry is for short positions. Entries on resistance have been very lucrative in the past as the bulls just cannot seem to gather enough strength to break these resistance points.
Suggest entries from 91+ up until 96, looking at movements above 95 as potential signals for bullish momentum and a denial of this pattern.
If this pattern is confirmed and ETH breaks the lower bound then we could expect ETH to test its annual low of $81 and below. A break below 81 would mean we have chewed up support (from May 2017 timeline) and could see ETH cruise on down to 75 or lower.
**This is educational advice, your investment decisions are up to your own discretion and risk tolerance. Do your own research and trade safe.**
Happy trading mates!

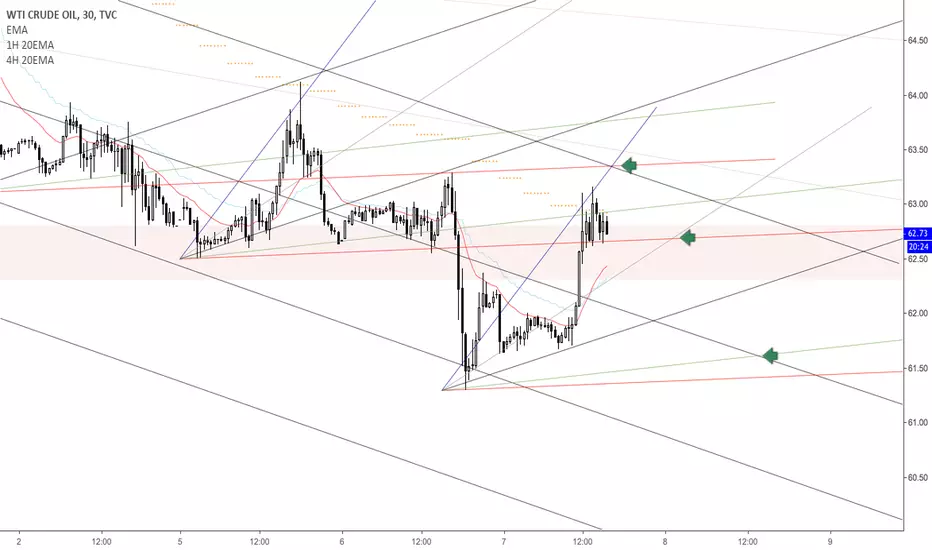
USOIL Possible Bear Continuation Targets USOIL is being well supplied after pulling back to the grand 45 degree line coming down from the top. If 5000-5050 area fails, the bear case becomes more relevant. Assuming pre mortem conditions, the inventory report turning this around and supply being dried up by incoming new demand, it is reasonable to look for entry opportunities on the lower timeframes. It's better to get out after being proven wrong shortly after entry than hold the bag for who knows how long.

GBPNZD DAY BEST LUCKY STAR DOJI STRATEGYTrading Doji candlestick as a stand-alone trigger signal is a bad idea. Price usually whipsaws around doji.
Note #1: In technical analysis, the Doji candle is a neutral pattern if it’s used as a stand-alone candlestick.
However, if the Doji candle it’s used in conjunction with the preceding price, we can establish a bullish or bearish bias.
A whipsaw pattern involves price moving chaotically above and below a certain key support and resistance level. Whipsaw patterns are also referred to as false breakouts. We have developed our Japanese Doji trading strategy around this price feature.
Step #1: For short trades we need a steady move downward, below the 14 –day MA
Even though most traders used this Japanese candlestick pattern as a reversal pattern, we have found out through some testing that the Doji candle performs best as a continuation pattern. So the first step we need to undertake is to determine the trend direction.
When we see the price moving steady downwards below the 14-day MA we have enough reasons to believe a downtrend is in progress.
Step #2: Look for a Doji Candlestick to develop near the 14-day MA and inside the previous candle price range.
Next, there are two more conditions that need to be satisfied for a valid trade setup. The first thing to consider is the location of the candlestick setup. We need the Doji candle to develop near the 14-period MA.
Secondly, we need the Doji candle to be contained inside the price range of the previous pattern. Basically, this will lead to the formation of another pattern called an inside bar.
So, we have a pattern within a pattern.
Step #3: Whipsaw pattern: Look for a false breakout above the previous two-bar pattern. Go short once we recover and break below the Doji candle opening price
Now, we’re going to bring to light how we use the whipsaw pattern to our advantage.
The Doji candles are very well-known candlestick patterns for producing a lot of false breakouts. We also know that a break of a level against the prevailing trend has fewer chances to success.
So, by putting all these pieces of the puzzle together we were able to develop one of the best Doji strategies, which eliminate the scenario where your stop loss is prematurely triggered.
After the false breakout, we wait for the price to recover and we only sell once we get price breakouts the bearish Doji candle opening price.
Note #2: We want everything to happen within the first candle after the Doji bar. So the false breakout and our entry should be immediately on the next bar following the Doji candlestick.
Let’s now determine an appropriate place to hide our protective stop loss and a proper way to exit our trade.
Step #4: Place protective SL above the current daily candle high. Take profit once we break below the inside bar pattern or a support level.
We aren’t going to stay in this trade for a very long period of time. That’s the reason why we exit our profitable trade once we break below the inside bar pattern or nearest sup/res. When it comes to placing our protective stop loss, we can hide it above the high of the candle that triggered our entry.
Long trade is just opposite setups.

UPDATE: [ETHUSD] Descending Triangle $100 TargetAhoy mateys,
Yesterday I published a chart looking at ETH dropping to $100 from a descending triangle pattern that I saw forming. I must admit my focus was on too narrow of a timeline, a triangle did form and did (slightly) breakout but my 30 minute interval chart did not do the best job at putting a more accurate timeline.
Regardless, my suggested entries of $133-134 ETH appear to be valid and I am sticking to my cannons there. On that idea I posted updates pulling out to further and further timeframes as trading progressed.
This update is a little more in depth look at the longer term, building off of my original chart and the updates I had made to it. I have updated my fib retracement points to better reflect current trend activity for the timeframe I am looking at. I am seeing very strong potential for ETH to bounce off of the lower bound of this pattern one last time, retest $133 for a final time, before confirming yet another continuation of this down trend we have been in.
We can also see that a bearish MACD cross may be approaching. In addition to that, a bearish crossover on the Stoch RSI indicator signals that we may be dropping out of this overbought territory, this does not come as a surprise to me as it seems very clear that buyers are still fleeing the market. ETH needs some serious bullish activity to prevent another breakout in my opinion, and this pattern isn't indicating anything bullish to me right now. Otherwise we are just going to continue falling as major support has been continuously broken and we are already in the middle of a large breakout of a larger descending triangle that was formed on the continuation of the downtrend from the peak ~$1500 ETH price, aka we are in shark infested water mates.
I signaled the larger scale breakout two weeks ago as you can see on this idea I published at ETH $215:
If this trend continues I believe a $133-134 entry again is ideal if you can grab it. Anything above 131 is arguably a good trade as well. ETH may eventually turn around, but I am much more comfortable trading along with the trend than trying to call a reversal. Some argue ETH may go to 0, I am not as sure about that, but if we hit my $100 target then we may see much more pain to follow for ETH and crypto in general.
Trade at your own risk, do your own research, blah, blah, blah.
Happy trading!

USDJPY 4H TRADESPair is in a possible range with price at the bottom
Price may return to the ma's (Long) or breakout of the bottom support (Sell)
Macd has crossed above the Red signal line Bullish bias
Long Trade
Buy stop at 112.85
Buy Take Profit at 113.20
Close trade if Macd crosses below Red signal line
Find appropriate SL
Short Trade
Entry breakout of bottom support on a 15m break-hook-go pattern
Sell Take Profit will be the 800 sma
SL above range bottom breakout candle
*Watch for Bearish failure move
If price moves back into range above bottom support
Aggressive Buy with candle close back into range
Also use Long trade signals

Lower Timeframe USOIL Sell Setup USOIL went through a decent pullback earlier today and can potentially reach 6335 as a result of another bullish swing. Limit sell order around 6335 with a 35 tick stop and 1R-2R targets is the current plan.
An apple a day keeps the profit awayWhats up Traders
Zoomed in look at a larger chart i posted previously. see link below.
Yellow Line - Broken Neckline of Head and Shoulders Pattern
Target Zone - is our options put take profit area, expiry 11/9
Looks coiled up , Symmetrical Triangle, with a little afternoon Volume, we are expecting price to take another leg down into the weekend.
Lets see how it plays out.

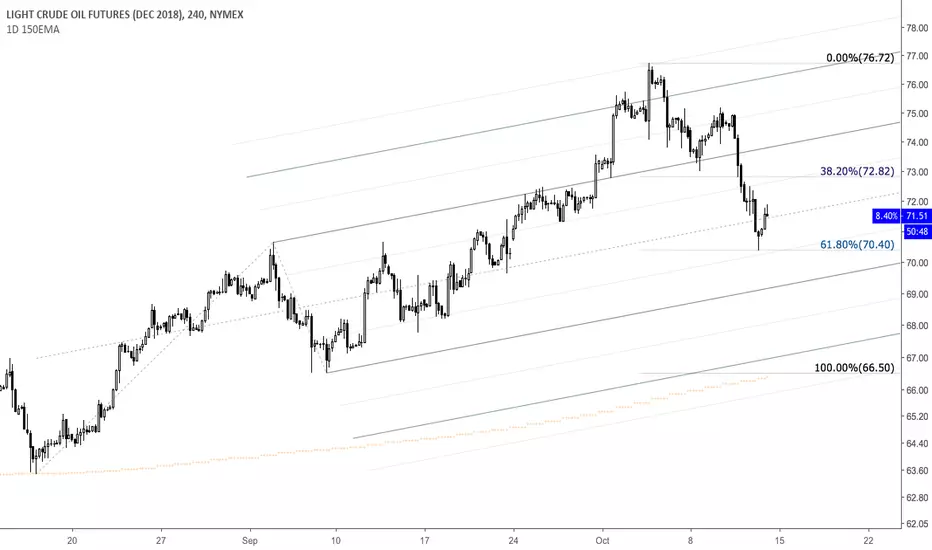
CLZ2018 618 Buy CLZ2018 just hit the 61.80% retracement point on its recent bull swing and found some support seemingly. Continuation players are taking this opportunity to add on to their long holdings. The Schiff set's Median Line is met here as well. A healthy pullback in a major bull trend that may lead to 127.20% extension. Short risk in oil is the preferred choice as long as the major higher lows and higher highs are intact. Trade with care!
GBPUSD Daily Chart- Hidden RSI Bearish DivergenceFX:GBPUSD
There's a Hidden RSI Bearish Divergence on the Daily Chart indicating a possible downtrend continuation.
A break below and daily candle close below the trendline and we may see price go as low as ~1.21700 ( Previous Low of March)
Short Entry: At close of Daily Candle below trendline
TP 1: 1.27000
TP 2: 1.21700
SL: 1.32600
This is longterm trade. Take profits as you wish.

EurUsd Sell continuationAs i'm a support and resistance trader i look at levels and trade bullbacks on the trend.. eurusd is currently simulating a comon continuation pattern

USDCAD 1H lONG TRADE FOUND ON 3 TSG INDICATORSAdvanced Triangle Breakout System Indicator 63 pips
5 Candle Mastery System Indicator 90 pips
Big 3 Trading System Indicator 131 pips
Each indicator finds trades setups based on
Triangle patterns breakouts
ATR breakouts
Continuation candle pattern breakouts
PM if you have any questions. I will be happy to help.

NOKSEK Reverse Head and Shoulders Pattern on 1D ChartAs you can see from this 1D chart, there is an inverse head and shoulders pattern and the neckline got broken a few days ago which signals that the pattern is complete and it is ready to go up. Moreover, the price is still above the moving average which tells us that the price is still in an uptrend. Therefore, we can buy NOKSEK at this pullback and aim for the price objective as shown in the chart

Continuation Pattern on CADCHFThere is a nice triangle/pennant on CADCHF forming after the last impulse wave we had. I trade triangles as continuation patterns. Put stop over triangle and wait for a break on H4 chart.
If you guys want more ideas like this one, feel free to follow!
Much Love <33

CHFJPY Continuation PatternWhat you Think Guys about this Pattern . i Think Price will go Down because of Pin Bar on Strong Resistance and also 2 time Price go down from previous 2 pin bar and 3rd Stochastic overall showing divergence well its my analysis just for Education purpose ... so don't take trade i just share my idea to get more helps from senior lean more and more thanks to everyone :) check and comments thanks

BUY ECHO on pullbackECHO has a zacks rank of 1 (strong buy). It pulled back to the 61.8 Fibonacci retracement level on the wick of a bullish candle. It is also consolidating around this price level. it has also closed above the 20sma.There is definitely some historical resistance overhead, however, I believe it can break above this level due to the fact that earnings have been doing well over the past couple quarters. It has experience a strong reversal and has a lot of potential. although this may be true, there is always a possibility of things not going our way so I will continue to move my stop loss up.

God and Bitcoin Conspires against meDO you see this shit? I thought of it while I was about to update one of my ideas. This is a head and shoulder continuation pattern, a very possible one at least. And it is a part of that big inverse head and shoulder pattern, what the hell is this what am I looking at... Only in crypto for real, this is absurd.
Okay so outrage aside, this honestly looks like continuation pattern for a bear market and it is a head and shoulder continuation pattern on the macro scale and I am going to break this possible head and shoulder down into the major components of a head and shoulder pattern.
1.) Its huge and there is a divergence of volume on the 4 hour time frame, about 6100 to 6200 appears to be the neckline and the neckline appears to be strong (the bottom of the right and left shoulders of the inverse head and shoulder).
2.) The neckline which can be seen in light blue is horizontal which indicates a weaker uptrend prior or weaker bulls.
3.) Since the left shoulder of the head and shoulder top is the right shoulder of the inverse head and shoulder, I expect the top of the left shoulder (the yellow estimation line) to be close to symmetrical to the right shoulder of this pattern. the right shoulder would not be invalidated until it hits the same price or at least close to the same price as the head, which I doubt would be the case. The higher the right shoulder would indicate bearish weakness. However, if the price of the right shoulder cannot even reach the left shoulder then to me it would indicate a bearish strength. I expect the right shoulder to hit roughly 6850 to 7200.
4.) For this pattern to be complete there needs to be a break out of the neckline on high volume and given the strength of the bears right now I do expect that to occur.
5.) I expect a return move to occur, but it is possible that it does not occur.
Key Points:
1.) If this is the case we are fucked for now.
2.) The Price objective of this continuation pattern would be 3800.
3.) At this point there isn't much that can invalidate this pattern from occurring other than a rejection at the neckline and or a strong push beyond the head on the right shoulder.
4.) If a break at 5800 occurs then we are going to blow down to 4800 easily and I suspect there will be pauses between 4800 and 3800.
5.) There will be a major panic sell off.
Best of Luck: Trade smart, hedge risk and make some money.
Previous Analysis:

EURCAD - S/R entryE-Wave asserting its presence here as we move beyond corrective wave C and enter continuation wave 2. Look to S/R (blue) for trend confirmation.
Look to commodities for more insight.

EURUSD (Short Position)Whats up Guys -
Most of my analysis can be found ON the Chart. I will be entering a short position now with stop and take at the areas indicated.
Give me ten likes and I will update the chart when I close out.
Ten Likes and I will update the chart
Intelligent disagreement welcome
Good Luck - See you on the trading floors
#Crypto #BTC #cryptocurrency #ADA #CARDANO #LTC #LTCUSD #LitecoinNation #XRPCommunity #XRP #Ripple #EOSUSD #BCH #BITCOINCASH #forex #EURUSD #AUDJPY #GBPUSD #USDCFH
-Nix
Good luck on the trading floors -

A rare continuation Pattern in BitcoinAfter yesterday's large drop in price, I found a couple of things; however, I do not know if the bullish sentiment has remained, I do believe that because bitcoin has broken 8000 again, there is a chance that the bulls may still have this and that yesterdays' price drop was just drop because of news but not a change in market sentiment.
Short term analysis: This the 45 minute chart and there are a series of chart patterns that can occur, and there are 3 highly probable situations, but I only drew two of them.
Considering that there was a significant bounce that drove the price up back into the daily bull flag, I wanted to understand what was happening on a micro level, and it looks interesting.
3 Possibilities:
1.) The most likely possibility I believe is the orange line, it is an interesting pattern and it is very rare, it is the inverse head and shoulder continuation pattern. So far, shape wise there would be a vague left shoulder and a prominent head; however, volume does not exactly fit the profile with the second drop being greater than the first, but it is still possible that this plays out like and inverse head and shoulder with another small drop that is similar to the left shoulder before a continuation of the uptrend. However, this is a rare occurrence and the inverse head and shoulder does not usually occur as a continuation pattern. Although the volume doesn't match, I still think that this will play out as an continuation pattern and on the longer time frame, it would still have the appears of a bull flag.
2.) Not drawn in is a movement down to test 7900 once more which I think is still possible, and I do think another strong test of 7900 would put the continuation of the uptrend at risk.
3.) The finial possibility I believe that is likely is a move up from this point because it does appear that bitcoin has made a small pennant in the 45min time frame; however, pennants have a high failure rate (roughly 50%), is it would be in question.

Iteksignal PRO V1 in BTCUSDT 1H chartNew Iteksignal with multiple point of entry with more Continuation Pattern and filters.
Iteksignal is based on pure price action.
Trend Confirmation Line help you to stay on the trend side (Green/Red line).
Short term Trend Line is mainly use for Trailing Stop (White line).
Same Setup rules as Classic Iteksignal apply.
Indicators
Iteksignal signal – Blue or Green letter B or S with an arrow (Red for Sell)
Trade Setup Details
Iteksignal “Continuation Signal”
Continuation Signal Trade is designed to take advantage of price action turning points.
It seeks to find near term support and resistance levels and then identifies places on the chart to entry off of, and take profit of the established trend.
Iteksignal “Reversal Signal ”
Reversal Signal Trade is designed to take advantage of price action turning points.
The indicators are designed to show us where the near term support and resistance levels are and to give us a possible entry point.
Definitions
Signal bar: It is the closed bar where the indicator is plotted (Blue or Red arrows) in the chart.
Breakout bar: The bar that closes above an important Resistance/Support level
Entry bar: The first bar after the signal bar that reach the high of the Signal bar
SETUP ENTRY RULES
1. Wait for the signal bar closes. Enter the trade 1-2 tick above the high of the signal bar.
2. If the high of signal bar is near an important resistance level
enter the trade 1-2 tick over resistance (Aggressive entry) or
enter the trade 1-2 tick over the high of breakout bar (Conservative entry)
To cancel setup
If any bar after the signal bar closes below the low of the signal bar, the signal is INVALID and the setup is cancelled.
