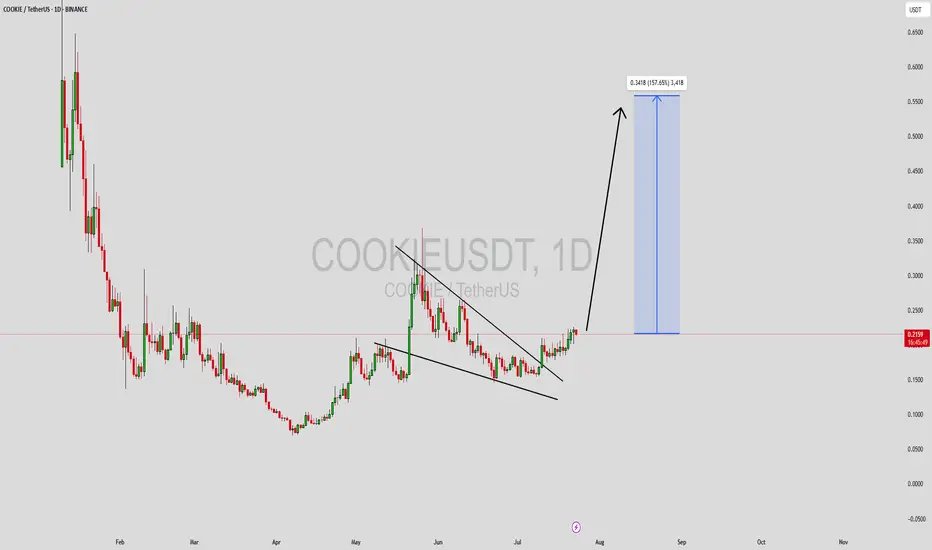
COOKIEUSDT Forming Falling WedgeCOOKIEUSDT has recently broken out from a bullish falling wedge pattern on the daily chart, a formation that typically signals a trend reversal and strong upward momentum. The wedge formed after a long consolidation and price compression, which usually results in a breakout supported by increased volume—and that’s exactly what we’re seeing. This breakout now opens the path for a potential move toward a 140% to 150% gain in the near-to-mid term.
The falling wedge breakout is accompanied by rising buying volume, which validates the pattern and confirms growing market interest in COOKIE. Price action has flipped from lower lows to forming higher highs, a technical shift that’s often the early phase of a parabolic move. COOKIEUSDT has established a solid support base, making this breakout structure more reliable for bullish continuation.
Investor sentiment around COOKIE has also been turning positive. With increased attention across crypto communities and favorable positioning on Binance, COOKIE is beginning to draw speculative momentum. The risk-reward ratio remains attractive at current levels, especially considering the technical setup and expected target levels projected around the $0.55–$0.60 zone.
Traders should keep an eye on short-term resistance zones for potential pullbacks and re-entry opportunities. As long as the breakout holds and volume remains strong, COOKIEUSDT could become one of the top-performing mid-cap altcoins in this cycle.
✅ Show your support by hitting the like button and
✅ Leaving a comment below! (What is You opinion about this Coin)
Your feedback and engagement keep me inspired to share more insightful market analysis with you!
COOKIEUSDT
COOKIE/USDT on the Verge of a Breakout? Descending Triangle
📊 Complete Technical Analysis
COOKIE/USDT has been forming a classic Descending Triangle since February 2025, indicating prolonged market consolidation. Sellers have been pushing the price down gradually (lower highs), but buyers have strongly defended the horizontal support around $0.16–$0.18.
Now, the price is testing the upper boundary of this structure, signaling a potential explosive breakout.
🔍 Pattern Breakdown
Pattern Name: Descending Triangle
Key Traits:
Lower highs compressing price action
Strong horizontal support zone holding steady
Typically a continuation pattern, but in this case, it can act as a reversal signal if breakout occurs to the upside
Formation Duration: ±6 months
Breakout Confirmation: A daily candle close above ~$0.22 with strong bullish volume
🚀 Bullish Scenario (Upside Breakout)
If COOKIE/USDT successfully breaks above the triangle resistance, here are the potential bullish targets:
Target Price Reason
🎯 Target 1 $0.259 Local resistance zone
🎯 Target 2 $0.299 Key breakout confirmation
🎯 Target 3 $0.407 Measured move from triangle height
🎯 Target 4 $0.626 – $0.700 Historical resistance range
🏁 Final Target $0.842 (ATH Zone) If bullish sentiment fuels momentum
✅ Volume confirmation is crucial. A breakout without strong volume might signal a fakeout.
🛑 Bearish Scenario (Rejection or Breakdown)
On the flip side:
❌ If the price fails to break the triangle resistance (~$0.22) and gets rejected again, we could see a retest of:
Support zone around $0.18
A breakdown below this level could drive the price toward:
$0.140
$0.120
Possibly as low as $0.095 – $0.075 if sentiment worsens
❗ Be cautious of fake breakouts or bear traps near key levels.
📚 Summary & Insights
> The current descending triangle is a textbook setup of “compression under pressure.” If the structure breaks upward with conviction, COOKIE/USDT may enter a powerful bullish trend after months of consolidation.
This setup is ideal for swing traders, breakout traders, or early trend investors seeking solid entries before momentum accelerates.
#COOKIEUSDT #CryptoBreakout #DescendingTriangle #AltcoinAnalysis #BullishReversal #TechnicalAnalysis #TradingView #CryptoTA #AltcoinSetup #ChartPattern

Cookie DAO price analysis😠 Those who like high-risk trading can take a closer look at #Cookie
📈 If buyers manage to keep the price of OKX:COOKIEUSDT.P above $0.25, then the chance for another powerful upward momentum will be very, very high.
📉 If the #CookieDAO price is fixed below $0.25, it may indicate that a corrective movement is starting, which, according to the red scenario, could be quite deep.
_____________________
Did you like our analysis? Leave a comment, like, and follow to get more

#COOKIEUSDT maintains bearish momentum📉 SHORT BYBIT:COOKIEUSDT.P from $0.2787
🛡 Stop loss: $0.2925
🕒 Timeframe: 4H
✅ Market Overview:
➡️ A Rising Wedge pattern has formed and broken down, confirming bearish momentum.
➡️ Price has broken below the wedge and the POC level at $0.2976, turning it into resistance.
➡️ Strong volume cluster at $0.2976–$0.2925 is now likely to act as a rejection zone.
➡️ Bearish pressure is visible through high-volume red candles.
➡️ Arrows on the chart indicate a continuation toward the take-profit levels.
🎯 TP Targets:
💎 TP 1: $0.2660
💎 TP 2: $0.2515
💎 TP 3: $0.2395
📢 Watch how price reacts BYBIT:COOKIEUSDT.P to TP1 — weak bounce may signal room for deeper drop.
🚀 BYBIT:COOKIEUSDT.P maintains bearish momentum — further downside expected!

COOKIE Looks Bullish (1D)We have a good setup on the chart. A bullish CH has formed, the trigger line has been broken, and the price is currently sitting on a support level.
The green zone has been tested twice and rejected, which has strengthened the bullish outlook for this asset.
The main supply zone is marked in red. It is expected that, with price fluctuations, the asset will reach the red zone in the coming days or weeks.
A daily candle closing below the invalidation level would invalidate this analysis.
For risk management, please don't forget stop loss and capital management
Comment if you have any questions
Thank You

COOKIE/USDT Short Setup Loading - High-Probability DropPrice recently pumped into a premium zone and gave us a clear Change of Character (ChoCh) — a classic signal that momentum is shifting from bullish to bearish. Now, we’re seeing a pullback into the 0.5–0.618 Fibonacci retracement zone, which often acts as a key area for entries.
📍 Trade Plan
Entry: 0.182 USDT
Stop-Loss: 0.191 USDT (above recent high / invalidation point)
Target: 0.173 - 0.1657 - 0.153
🔎 Why This Setup Stands Out:
✅ ChoCh Confirmed – Momentum has shifted, suggesting the bulls are losing control.
✅ Fibonacci Confluence – Price is pulling back right into the golden zone (0.5–0.618), offering a textbook short entry.
✅ Clean Risk/Reward – With a tight stop and a defined target, the setup offers solid R:R potential.
💭 Final Thought:
Now it’s all about confirmation. If we see a solid rejection in the zone, this setup could play out with strength. Patience is key — let the market come to you.

COOKIE Buy/Long Setup (4H)Looking at the chart, we can identify bullish signs for COOKIE.
On the CH chart, we see a bullish structure along with the clearing of resistance zones. There’s also a liquidity pool above the chart which is expected to be swept soon.
The only remaining resistance order block on the chart is the marked supply zone, which could potentially also be taken out.
As long as the demand zone holds, we expect a move toward the targets.
A daily candle close below the invalidation level would invalidate this analysis.
Do not enter the position without capital management and stop setting
Comment if you have any questions
thank you

COOKIEUSDT 1DCOOKIE ~ 1D Analysis
#COOKIE Buy gradually after successfully penetrating this resistant line with a short -term target of at least 10%+.

COOKIEUSDT 2DCOOKIE ~ 2D Analysis
#COOKIE High risk trading. This is the main support that needs to be maintained. Buy if you are still sure. with a short -term target of at least 10%+.
$COOKIEIn terms of charting, for the corrective movement to be complete, it is necessary for the price to correct to the range of $0.0832. After the price reaches this range, it is expected that the corrective movement will be complete, and the chart will form a base there from which the price will reverse. If the overall market condition is good, one can expect it to rise to the price range of $0.542. For now, this section of the analysis focuses on the continuation of the downtrend. If this occurs and the price movement progresses according to the presented analysis, further supplementary analyses will be provided based on the overall market situation.

IDUSDT UPDATEIDUSDT is a cryptocurrency trading at $0.3183. Its target price is $0.5000, indicating a potential 50%+ gain. The pattern is a Bullish Falling Wedge, a reversal pattern signaling a trend change. This pattern suggests the downward trend may be ending. A breakout from the wedge could lead to a strong upward move. The Bullish Falling Wedge is a positive signal, indicating a potential price surge. Investors are optimistic about IDUSDT's future performance. The current price may be a buying opportunity. Reaching the target price would result in significant returns. IDUSDT is poised for a potential breakout and substantial gains.
COOKIE Long Swing OpportunityMarket Context:
COOKIE is nearing a key support zone, offering an ideal entry for a potential bounce and continuation of its trend.
Trade Details:
Entry Zone: Around $0.15
Take Profit Targets:
$0.25
$0.36
Stop Loss: Daily close below $0.11
This trade provides a favorable risk-to-reward ratio if COOKIE holds at support and reverses upward. 📈

COOKIE is Bearish (2H)First of all, note that this symbol is highly volatile and risky.
From the point where I placed the red arrow on the chart, it seems that the COOKIE correction has begun.
Currently, it appears that COOKIE is in wave B of an ABC pattern or possibly a more complex structure.
As long as the red zone is maintained, it is expected to move toward the specified targets.
Closing a 4-hour candle above the invalidation level will invalidate this analysis.
For risk management, please don't forget stop loss and capital management
Comment if you have any questions
Thank You

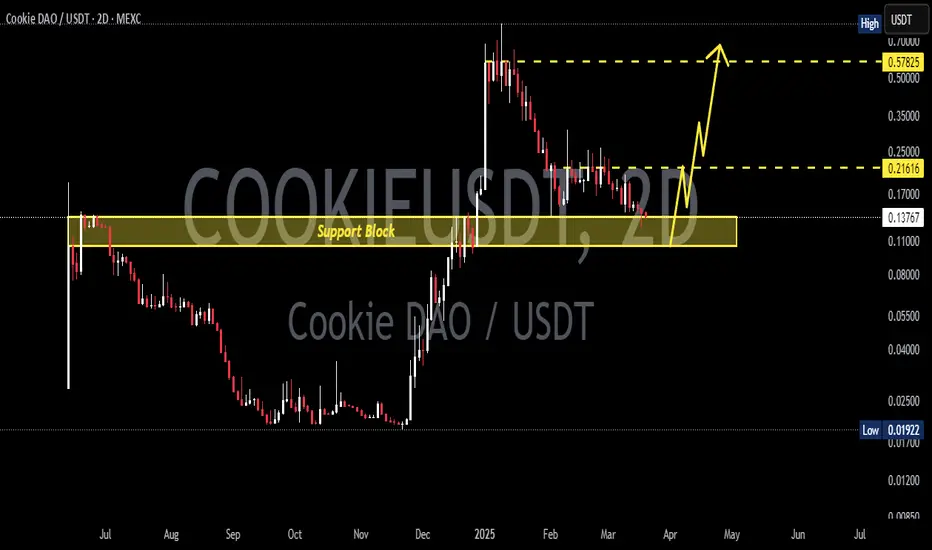
COOKIEUSDT(COOKIEDAO) Updated till 04-02-25COOKIEUSDT(COOKIEDAO) Daily timeframe range. fairly new PA here. so we got several opportunity for nice setups. buyers needs to defend 0.1478 or it will go back to price discovery. its a empty void below there. recent resistance at 0.2740.

Cookie / USDT: On the verge of a Breakout above trendlineCOOKIE/USDT: On the Verge of a Breakout Above Trendline Resistance
COOKIE/USDT is setting up for a major move 📈 as it nears a key trendline resistance zone 📊. After a period of tight consolidation, the conditions are aligning for a potential breakout 💥. If confirmed, we could see a strong bullish rally unfold 🚀. Stay alert and watch for confirmation before making a move.
Key Insights:
1️⃣ Trendline Resistance: COOKIE/USDT is testing a significant trendline that has historically acted as a barrier. A successful breakout could trigger a sustained bullish trend.
2️⃣ Volume Surge: Watch for a spike in trading volume during the breakout to confirm strong buyer momentum 🔥.
3️⃣ Bullish Signals: Indicators like RSI and MACD are showing bullish momentum ⚡, increasing the likelihood of an upward breakout.
Steps to Confirm the Breakout:
✅ Look for a clear 4H or daily candle closing above the trendline.
✅ A notable volume surge during the breakout will indicate strong buying pressure.
✅ A successful retest of the broken resistance as a new support zone adds credibility to the move.
⚠️ Be cautious of fake breakouts—wicks above the trendline without follow-through can indicate rejection.
Risk Management Strategies:
🔒 Use stop-loss orders to protect your position.
🎯 Adjust your position sizing to fit your risk tolerance and strategy.
This analysis is for educational purposes only and not financial advice. Always DYOR before making investment decisions 🔍.
