BHP holds steady as copper cracksCopper has been on a rollercoaster in 2025. It broke above US$5/lb in May, driven by strong demand signals from China and clean energy projects. Then came the reversal. US tariffs on Chinese copper goods triggered a sharp selloff. Futures dropped more than 20% in days.
Traders reacted to headlines. But the long-term story remains intact.
BHP, one of the world’s largest copper miners, just delivered record output—over 2 million tonnes in FY25, up 8% year-on-year. Its Escondida and Spence mines are performing strongly. Copper is becoming a key pillar of BHP’s future production and revenue.
The stock is currently trading on the ASX near its 200-day moving average, around AU$39. This is a technical and psychological level that often acts as support in long-term trends. It’s a point where value investors typically step in.
The investment case for copper hasn’t changed. Electrification, energy transition, and AI-driven infrastructure will need vast amounts of copper. Supply remains constrained. New projects are few, and development timelines are long.
Short-term shocks create long-term opportunities. The tariff-driven selloff may shake out weak hands, but it doesn’t weaken the structural demand for copper.
BHP offers a cleaner way to invest in the copper story. It has scale, operational discipline, and a strong dividend yield. Investors get exposure to copper without the risks that come with smaller miners or speculative plays.
We believe this pullback is an entry point. BHP near its long-term average, with strong fundamentals, looks attractive for medium to long-term investors.
Copper may stay volatile. But the direction is clear. BHP is well-placed to ride the next leg higher.
The forecasts provided herein are intended for informational purposes only and should not be construed as guarantees of future performance. This is an example only to enhance a consumer's understanding of the strategy being described above and is not to be taken as Blueberry Markets providing personal advice.
Copper

What a turnaround on copper futuresManipulation? Smells like it, but of course, this is just the market we are currently living in.
Let's dig in.
MARKETSCOM:COPPER
COMEX:HG1!
Let us know what you think in the comments below.
Thank you.
75.2% of retail investor accounts lose money when trading CFDs with this provider. You should consider whether you understand how CFDs work and whether you can afford to take the high risk of losing your money. Past performance is not necessarily indicative of future results. The value of investments may fall as well as rise and the investor may not get back the amount initially invested. This content is not intended for nor applicable to residents of the UK. Cryptocurrency CFDs and spread bets are restricted in the UK for all retail clients.

Copper: Trump Signs Tariffs on Imports Amid National Security...President Donald Trump signed a proclamation on Wednesday that imposes tariffs on copper imports, citing concerns over national security.
The White House announced that the new policy will introduce a 50% tariff on semi-finished copper products and other copper-derived goods that are highly dependent on the metal.
These tariffs are scheduled to come into effect on August 1, as outlined in a White House fact sheet.
In terms of market dynamics, copper is currently within a monthly demand zone, with a daily demand area also identified for setting pending orders. The potential impact on prices could be twofold: a possible upward movement driven by the discount effect on the metal, or continued decline following President Trump's announcement.
What are your thoughts on how these tariffs might influence copper prices moving forward?
✅ Please share your thoughts about HG1! in the comments section below and HIT LIKE if you appreciate my analysis. Don't forget to FOLLOW ME; you will help us a lot with this small contribution.

Long the copper for a potential breaking upWith the expectation of PPI bouncing back from the deep valley because China is launching a 1.3 Trillion infrastructure plan to build the largest hydro dam in the Yarlung Tsangpo Grand Canyon on the Qinghai-Tibet Plateau, the long term global demand of industrial copper is more bullish than last time.
In the aspect of currency, the bullish steepener yield curve of US T-bill is giving a continuous momentum to industrial commodities.
Imma entry in the bottom of the current consolidation and add position as the breaking in the next weeks

COPPER Top of 4-year Rising Wedge. Sell.Copper (HG1!) eventually followed the bearish break-out signal we gave on our last analysis (April 03, see chart below) and within 2 days it hit our 4.1250 Target:
Right now the price sits at the top of the 4-year Rising Wedge pattern and on the 1W time-frame it is a textbook technical sell signal.
With the 1W RSI also rejected on a Lower Highs trend-line, we are looking to aim for the 1W MA50 (blue trend-line) at least. Every Bearish Leg since the July 11 2022 Low, reached at least its 0.618 Fibonacci retracement level before rebounding again.
As a result, our Target is 4.700, which given a fair 3-month time-frame, should be at the time marginally below the 1W MA50, in line with all previous bottoms of the Rising Wedge.
-------------------------------------------------------------------------------
** Please LIKE 👍, FOLLOW ✅, SHARE 🙌 and COMMENT ✍ if you enjoy this idea! Also share your ideas and charts in the comments section below! This is best way to keep it relevant, support us, keep the content here free and allow the idea to reach as many people as possible. **
-------------------------------------------------------------------------------
💸💸💸💸💸💸
👇 👇 👇 👇 👇 👇

Bullish Consolidation After the copper market exploded higher on the Trump Administration’s 50% tariff headline, the market has been quietly consolidating above the breakout level at 5.33. While above this level the risk is higher, and in case of a break back below the 5.30 level, the risk would be a larger retracement. This would likely be caused by the Trump Administration abandoning that threat of a 50% tariff.

Copper: Event-driven Trade Idea on Recent TariffsCOMEX: Micro Copper Futures ( COMEX_MINI:MHG1! ), #microfutures
The Event
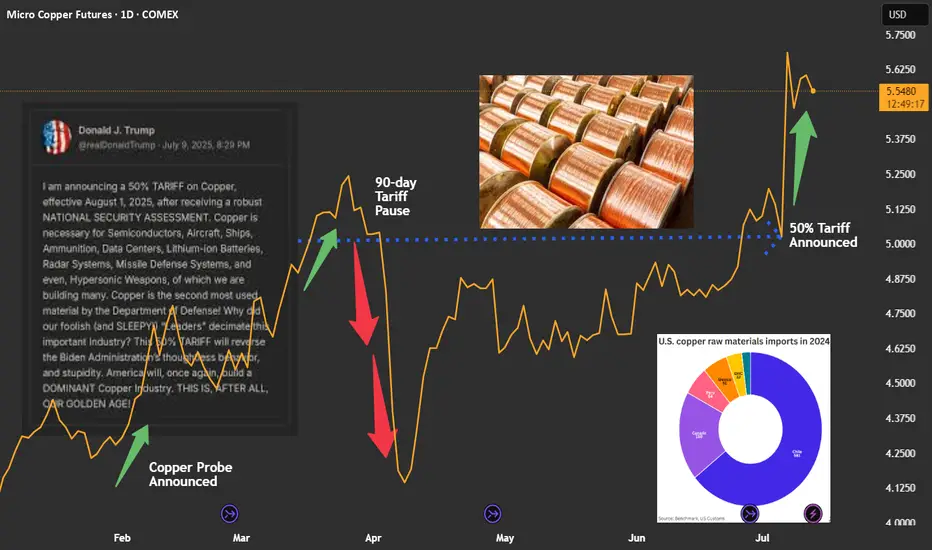
On July 9th, President Trump announced that he would impose a 50% tariff on imports of copper, effective August 1st.
The decision was based on national security assessment. Copper is the second most used material by the U.S. Department of Defense. The President intents to use tariffs to reduce reliance on imports and shore up support for domestic production.
Immediate Market Reaction
U.S. copper prices ended Tuesday’s session over 13% higher — the sharpest single-day gain since 1989. The September COMEX copper futures contract was settled at $5.584 a pound on Friday, up 35.7% year-to-date.
Due to tariffs, Copper in the U.S. is priced at a large premium over international markets.
• UK: LME copper contract was quoted at $9,660.5 per ton on Friday.
• China: SHFE coper futures was settled at RMB 78,420 per ton. It can be converted to $10,959.4 via the Dollar/RMB exchange rate of 7.1555.
• US: COMEX copper quote of $5.584 can be converted to $12,312.7 per ton.
• As of Friday, COMEX copper is priced at a 27.5% premium over LME copper, and a 12.3% premium over SHFE copper.
The U.S. Copper Market
The U.S. Geological Survey reports that the 2024 total refined copper consumption was 1.8 million metric tons. Of which, 850,000 tons were from mining, 150,000 tons were refined from scrap, and 810,000 tons from imports.
Chile is the biggest source of U.S. copper imports, accounting for 581,000 tons, or 71.7% of total imports. Canada is the second largest, for 169,000 tons, or 20.9%.
Copper is a widely used base metal, found in products ranging from machinery, electronics, household goods, housing, infrastructure projects, to aircraft and missiles.
Since President Trump announced a probe into copper in February, traders have been poised for a hike on copper duties, leading to major shifts in inventories away from Europe and Asia and into the U.S.
The Next Event: Will the Copper Tariffs get postponed or reduced?
The goal to increase domestic production of copper is very challenging. It will take years to ramp up and decades to fully meet demand — at a massive upfront investment cost.
Hiking the import duties would not help national security. It could not change the fact that the biggest copper mines are in Chile, Peru and Canada. A sharp increase in the cost of copper will quickly translate into wide-ranging inflation in the U.S.
In my opinion, once the Trump administration realizes the full impacts, we could possibly see a crawl-back from the intended copper tariffs. The effective date would be postponed, the tariff rate could be reduced, and many companies may get exemption/waiver. We have seen similar maneuvers happening multiple times in the past few months.
Overall, the actual impact of copper tariffs will be much smaller than the original announcement.
Shorting COMEX Copper Futures
Historically, the price difference between COMEX and LME coppers has been near-zero and was around the $150 level in 2024.
Since February, COMEX copper has been trading at $500-$1,500 premium over LME. As of Friday, COMEX copper futures have gone up 35% this year and are now priced at $2,652 per ton above LME copper.
In my opinion, these price differences reflect no economic fundamentals. It is purely due to the ever-changing global tariff conflict. If President Trump rescinds his tariff narratives, we could likely see a large drop in COMEX copper prices.
A trader sharing this view could explore shorting the COMEX Micro copper ( GETTEX:MHG ).
Last Friday, the September micro copper futures contract (MHGU5) was settled at 5.5910. Each contract has a notional value of 2,500 pounds of high-grade copper, or a market value of $13,977.5. To buy or sell 1 contract, a trader is required to post an initial margin of $1,100. The margining requirement reflects a built-in leverage of 12.7-to-1.
Let’s use a hypothetical trade to illustrate how to use a short futures position to take advantage a potential reduction on copper tariffs.
Hypothetical Trade:
• Short 1 MHGU5 contract at 5.5910, and set a stop loss at 6.00
• Trader pays $1,100 for initial margin
Scenario 1: Tariffs go into effect, copper rises to $6.57
• Futures reflect a 50% premium over current LME copper price, which is at $4.38 per pound
• Short order stop loss at 6.00, and the maximum loss is $1,022.5 (= (6-5.591) x 2500)
• The trader loses most of the margining fund, but owes no more
Scenario 2: Trump Rescinds Tariffs, Copper falls to $4.38
• COMEX copper will be priced at No premium over LME
• Short position gains: $3,027.5 (= (5.591-4.38) x 2500)
• The hypothetical return will be 275.2% (= 3027.5 / 1100)
The above scenarios show that
• When copper falls, short position will have higher returns due to its leverage nature.
• When copper rises, the stoploss will kick in to set maximum losses.
The above trade idea could be deployed using the standard-size Copper Futures contract. Its notional value is 25,000 tons, which is 10 times bigger than that of the micro contract. The initial margin is $11,000. The standard-size contract is more liquid. On Friday, it had a total volume of 60,313 contracts, and an open interest of 221,682.
Happy Trading.
Disclaimers
*Trade ideas cited above are for illustration only, as an integral part of a case study to demonstrate the fundamental concepts in risk management under the market scenarios being discussed. They shall not be construed as investment recommendations or advice. Nor are they used to promote any specific products, or services.
CME Real-time Market Data help identify trading set-ups and express my market views. If you have futures in your trading portfolio, you can check out on CME Group data plans available that suit your trading needs www.tradingview.com
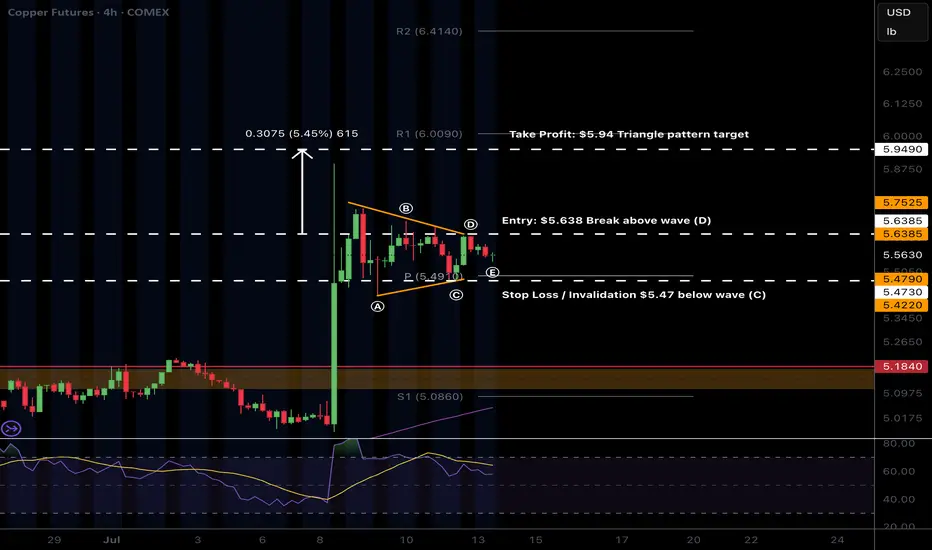
$COPPER triangle trade?CAPITALCOM:COPPER triangle has potentially printed and a triangle is an Elliot wave pattern that results in a terminal thrust up to complete a motif wave.
That would trap bulls as price terminates with a poke above the all time high keeping them believing they can capture the same gains already gone.
After the termination wave 2 often finds support at the triangle base.
Safe trading
XCU/USD: Low-Risk Loot Opportunity!🔥 THE COPPER HEIST: XCU/USD Robbery Plan (Swing/Day Trade) 🔥
🌟 Attention, Market Robbers & Money Makers! 🌟
(Hola! Oi! Bonjour! Hallo! Marhaba!) 🤑💰💸✈️
Based on the 🔥Thief Trading Style🔥, here’s our master heist plan for the XCU/USD "The Copper" Metals Market! This is a high-probability long setup, but we must escape before the police (bears) set their trap near the red zone! 🚨📉
📌 THE HEIST BLUEPRINT
✔ Entry Strategy (Breakout or Pullback)
✔ Stop Loss (Protect Your Loot!)
✔ Target (Escape Before the Cops Arrive!)
🚀 ENTRY: TIME TO STRIKE!
"The heist is ON! Wait for the ATR breakout (5.00000) before moving!"
Option 1: Place Buy Stop orders above the Moving Average.
Option 2: Use Buy Limit orders on pullbacks (15m/30m recent swing lows).
📢 ALERT! Set a breakout alarm—don’t miss the move!
🛑 STOP LOSS: PROTECT YOUR LOOT!
"Yo, listen up! 🗣️ If you're entering on a Buy Stop, DON’T set your SL until AFTER the breakout!
📍 Thief SL Placement: Recent swing low + Moving Average (5H TF) → 4.80000
⚠️ WARNING: If you ignore this, you’re playing with fire! 🔥 (Your risk, not mine!)
🎯 TARGET: CASH OUT & ESCAPE!
🏴☠️ First Take-Profit: 5.25000 (or exit early if the market turns!)
💰 Scalpers: Only trade LONG—use trailing SL to lock in profits!
📊 MARKET STATUS: NEUTRAL (But Bullish Potential! 🐂)
Fundamentals? Check COT Reports, Macro Data, Geopolitics, News Sentiment!
🔗 Links in bio0 for full analysis! 👉🌎📰
🚨 TRADING ALERT: NEWS = VOLATILITY!
⚠️ Avoid new trades during major news!
🔒 Use Trailing SL to protect open positions!
💥 BOOST THIS HEIST PLAN!
Hit 👍 LIKE & 🔄 SHARE to strengthen our robbery squad!
🚀 More heists coming soon—stay tuned! 🤑💎
🎯 FINAL WORD:
"Take profits, treat yourself—you deserve it! 💸🏆"

Copper Holds Above 14-Year ResistanceFrom a monthly time frame perspective, copper has broken above a major resistance zone defined by consecutive highs dating back to 2011.
The breakout above $5.40 marks a significant technical milestone. A clean move above the $5.87 high could open the door for further upside, potentially targeting $7.00 and beyond as bullish momentum continues to build.
On the downside, if copper fails to hold this breakout and closes back below the 14-year trendline, support may be retested near the $4.60 and $4.20 levels.
- Razan Hilal, CMT

Copper - the hot topic this weekUS is planning to implement tariffs on copper imports at a scale of 50%. It's an interesting move, which might not make much sense. Let's dig in.
MARKETSCOM:COPPER
COMEX:HG1!
Let us know what you think in the comments below.
Thank you.
75.2% of retail investor accounts lose money when trading CFDs with this provider. You should consider whether you understand how CFDs work and whether you can afford to take the high risk of losing your money. Past performance is not necessarily indicative of future results. The value of investments may fall as well as rise and the investor may not get back the amount initially invested. This content is not intended for nor applicable to residents of the UK. Cryptocurrency CFDs and spread bets are restricted in the UK for all retail clients.

Gap below… but copper’s breakout still in playCopper markets erupted higher this week following President Trump's proposal to impose a 50% tariff on copper imports. The price ripped from just above $5.20 to nearly $5.80 in a single 4-hour candle.
Now, copper could be forming a bullish flag or pennant on the 4-hour timeframe. After the vertical spike, price is consolidating in a tight, potentially downward-sloping channel between ~$5.45 and ~$5.60.
If confirmed with a clean breakout above the flag’s upper trendline - perhaps near $5.62—the next leg could project toward the previous high near $5.80
There’s also a gap below current price action, between $5.20 and $5.35, formed during the explosive move up. While gaps can act as support zones, they also tend to get revisited.

Sprott Copper Arbitrage against LME copper futures, discount 20%Currently COP.UN (traded on TSX, Toronto Stock Exchange) is showing some substantial discount again against NAV. Discount is more than 20% which basically means that you can buy copper on the world markets (LME) with a 20% discount! I expect discount will narrow again in coming weeks and wil go back to minus 10 or even better.
A more detailed description can be find below of all facts and figures.
Current Situation:
Discount to NAV: COP.UN is trading at just over a 20% discount to its net asset value (NAV). Essentially, this means you can buy copper exposure at a significant discount to the current market price.
Copper Storage and Transfers: The trust’s copper is stored in LME-approved warehouses and is increasingly being shipped to COMEX warehouses in the U.S. The reason is straightforward: copper prices on COMEX are currently higher than on the LME. By moving copper to COMEX, Sprott can sell inventory at better prices.
Mechanism for Payouts: The proceeds from selling copper at a premium on COMEX versus the LME can be distributed to unitholders as a special cash distribution (dividend). This provides a direct way for investors to benefit from arbitrage between exchanges.
Redemption Option: Institutional investors can redeem trust units for physical copper, subject to minimum tonnages and fees. This helps keep the trust price connected to physical copper markets and offers an arbitrage route if the discount remains wide.
The Opportunity:
This setup offers trading houses huge opportunities:
Arbitrage Play: Buy COP.UN units at a >20% discount, redeem them for physical copper, and sell the metal at spot prices, pocketing the spread (net of costs).
Dividend Upside: Hold COP.UN units and potentially benefit from future special dividends if Sprott continues moving copper to COMEX and realizing higher sales prices.
Useful Resources:
COP.UN Prospectus (Sprott Physical Copper Trust) cop-prospectus-en.pdf

Copper: Cycle TopLooking at Copper, is back near the highs due to tariffs. Miners are probably producing more, but industrial buyers won’t keep paying these high prices forever. That’s usually when investors get hurt.
Current phase its a cycle top IMO.
GH

Copper Trading Summary – Trump’s 50% Tariff ImpactCopper futures spiked—largest intraday gain in decades—after Trump announced a 50% import tariff.
Market fears supply disruption, especially from major exporters like Chile and Peru.
Bullish short-term outlook as U.S. buyers may rush to stockpile ahead of enforcement.
Risk of retaliation or broader trade tensions could limit gains if global demand weakens.
Watch for:
Tariff implementation details
COMEX/LME inventory shifts
China demand signals
Currency moves (AUD, CLP)
Trading bias: Bullish copper short term, but remain alert for macro trade war risks.
Key Support and Resistance Levels
Resistance Level 1: 9,780
Resistance Level 2: 9,900
Resistance Level 3: 10,000
Support Level 1: 9,580
Support Level 2: 9,500
Support Level 3: 9,340
This communication is for informational purposes only and should not be viewed as any form of recommendation as to a particular course of action or as investment advice. It is not intended as an offer or solicitation for the purchase or sale of any financial instrument or as an official confirmation of any transaction. Opinions, estimates and assumptions expressed herein are made as of the date of this communication and are subject to change without notice. This communication has been prepared based upon information, including market prices, data and other information, believed to be reliable; however, Trade Nation does not warrant its completeness or accuracy. All market prices and market data contained in or attached to this communication are indicative and subject to change without notice.

MR. COPPER GOES FUN. WITH DONALD TRUMP — IT IS A BULL RUNCopper prices in 2025 are up about 27 percent year-to-date, driven by a complex interplay of technical and fundamental factors, with geopolitical events such as the Trump administration's tariff policies and the escalation of geopolitical tensions in the Middle East having a significant impact.
Fundamental Outlook:
The main driver of copper prices in 2025 is the ongoing global surge in demand driven by the transition to clean energy. Copper is essential for electric vehicles (EVs), renewable energy infrastructure, and grid upgrades, all of which require extensive use of copper due to its superior electrical conductivity.
For example, EVs use about 2-4 times more copper than traditional vehicles, and renewable installations such as wind turbines contain several tons of copper each. This structural growth in demand underpins the optimistic outlook for copper in the medium to long term.
On the supply side, however, copper production is growing. The International Copper Study Group (ICSG) forecasts a global copper surplus of 289,000 tonnes in 2025, more than double the 2024 surplus. This surplus is driven by rising production, particularly from new or expanded operations in the Democratic Republic of Congo, Mongolia, Russia and elsewhere.
Capacity increases in these regions, coupled with smelter growth, could contribute to a supply glut despite strong demand.
Conversely, geopolitical tensions in the Middle East could disrupt bauxite and alumina supply chains, a region that is a strategically important supplier of raw materials.
Impact of Trump Tariffs:
The Trump administration’s threats and actions to impose tariffs on U.S. copper imports have added volatility and complexity to the market. The tariff announcement triggered a sharp sell-off in early April 2025 as concerns about the impact on US manufactured demand and global trade flows grew. London Metal Exchange (LME) copper prices fell to one-month lows following China’s retaliatory tariffs, before partially recovering after some tariff exemptions and reductions were announced.
The tariffs also distorted physical supply chains. Traders rushed to deliver copper to the US ahead of the tariffs, reducing copper availability in other regions such as China. This arbitrage resulted in a significant widening of the price differential between US CME copper contracts and LME copper prices, with US prices trading at a premium of over 10% to London. This premium reflects the tariff risk embedded in the US copper price and expectations of temporary domestic market tensions.
Technical Outlook:
Technically, copper prices have shown resilience despite the tariff shocks. Copper prices sold off after peaking in late March 2025 before the tariffs were announced, but have since begun to recover.
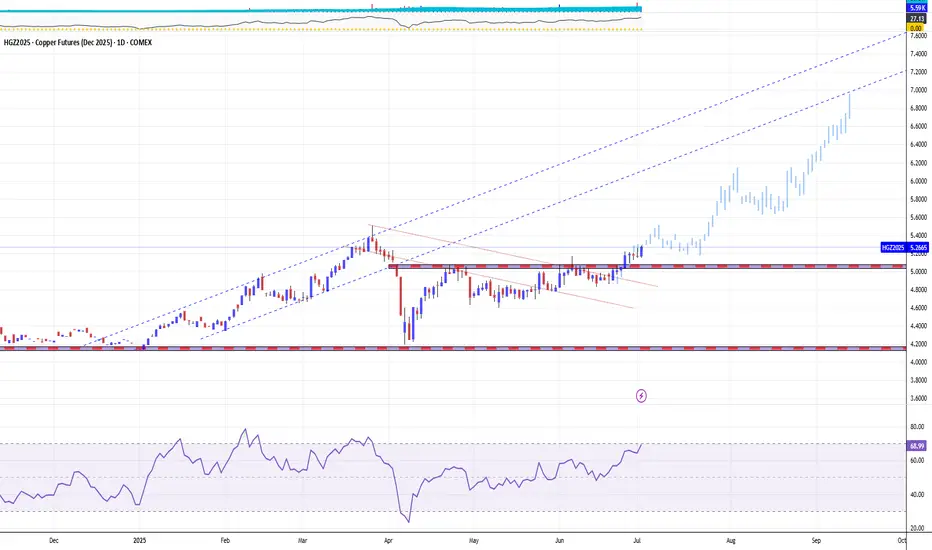
Long-term trendlines and moving averages remain supportive, with the 100-week and 200-week moving averages trending higher and forming a bullish crossover earlier in the year.
Long-term copper prices are once again attacking the 18-year resistance around $4.50/lb ($10/kg) that capped the upside in 2008 and again in the 2010s and first half of the 2020s, with a 1.5x rally in the next 1 to 3 years.
The technical main chart of the COMEX December 2025 copper futures contract COMEX:HGZ2025
points to the possibility of an upside move, all the way to the $7 mark (around $15/kg) as early as H2 2025.
Conclusion
Going forward, copper prices are expected to remain volatile but supported by long-term structural demand growth, with the impact of tariffs likely to cause episodic disruptions rather than a sustained suppression of increasingly hot prices.
--
Best wishes,
@PandorraResearch Team😎
Copper Cup & Handle Formation - Confirmed by Half-Yearly CloseIn a recent interview, Kevin Warsh, a former Member of Board of Governors Federal Reserve said: “External shocks like wars, pandemics, and supply chain disruptions may cause a spike in prices, that's not inflation. That's more like the weather. Inflation's more like the climate.
Weather refers to the day-to-day state of the atmosphere. A storm may come, but it will eventually pass.
Climate is the long-term average of weather patterns, typically measured over 30 years or more. If the underlying causes of climate change are not addressed, they are likely to affect future weather — for example, storms may become more unpredictable, occur more frequently, and intensify when they happen.
Going back to the financial markets. Have we address the underlying causes of inflation climate today? If not, then with every war or rumors of war or tariff or any unwelcome surprises.
They are likely to become even more volatile than before, some more bullish and the others more bearish.
What is the real cause of inflation climate the world is facing? Debt. At every pit stop, I will keep checking if there’s any chance that U.S. debt might start trending downward. If it does, my existing strategies would have to change. But for now, I’m maintaining these strategies. Here are some examples:
With fears of inflation still in sight, stocks have become more volatile. Since inflation hit a high of 9% in 2022, we’ve seen stock market swings widen.
With fears of inflation, bonds are under pressure. The drop in U.S. bonds wasn't triggered by the “Liberation Day” tariff announced on 2nd April alone. In fact, bonds peaked in 2020 and broke below their main uptrend support when inflation hit 9%.
With fears of inflation are also driving commodities higher — from “weather” to “weather,” so to speak. I’ve been covering gold, bitcoin, silver, and soybean oil. Today, copper looks interesting to me. Let’s dive into the technical. I find the half-year chart particularly interesting.
On this half yearly chart. We can see as the close on 30th June, copper settled firmly, closed above its $4.44 resistance that has been tested for years. This study indicates that copper could be at the beginning of an uptrend. I will be looking out for buying-on-dips opportunities whenever they arise.
What Began Well, Grew Risky — Yet Opportunity Awaits. Besides debt, there are two other key elements that may trigger fears of inflation from time to time. What do you think they are?
I would like to hear your thoughts on this.
Video version:
Mirco Copper Futures
Ticker: MHG
Minimum fluctuation:
0.0005 per pound = $1.25
Disclaimer:
• What presented here is not a recommendation, please consult your licensed broker.
• Our mission is to create lateral thinking skills for every investor and trader, knowing when to take a calculated risk with market uncertainty and a bolder risk when opportunity arises.
CME Real-time Market Data help identify trading set-ups in real-time and express my market views. If you have futures in your trading portfolio, you can check out on CME Group data plans available that suit your trading needs www.tradingview.com

Copper is gonna to complete the 2nd leg??Hi all trading lovers and copper buyers...
Seems that after BREAKOUT from Descending Triangle and Pullback to breakout level, price is going to complete the 2nd BULLISH Leg in Weekly uptrend with a round level target (5.5555)...
(Pullback could be a bit deeper...)
PLEASE NOTE THAT IS ONLY AN ANALYSIS AND COULD BE WRONG...
MARKET IS BASED ON POSSIBILITIES AND UNCERTAINTIES...
MANAGE YOUR RISK...
#Forex #Trading #Analysis #Copper #Chart #Spike #Wedge #Uptrend

What is Inflation Climate and Weather? Copper is NextThe key driver of most markets — and a major influence on their trends — is inflation.
Once we understand the difference between short-term inflation weather and long-term inflation climate, we can better recognize where risk meets opportunity.
On this half yearly chart. We can see as the close on 30th June, copper settled firmly, closed above its $4.44 resistance that has been tested for years.
This study indicates that copper could be at the beginning of an uptrend. I will be looking out for buying-on-dips opportunities whenever they arise.
Mirco Copper Futures
Ticker: MHG
Minimum fluctuation:
0.0005 per pound = $1.25
Disclaimer:
• What presented here is not a recommendation, please consult your licensed broker.
• Our mission is to create lateral thinking skills for every investor and trader, knowing when to take a calculated risk with market uncertainty and a bolder risk when opportunity arises.
CME Real-time Market Data help identify trading set-ups in real-time and express my market views. If you have futures in your trading portfolio, you can check out on CME Group data plans available that suit your trading needs www.tradingview.com

Copper breaks outFinally joining silver and platinum, copper has broken out above key $5.00 level. With prices making higher highs and higher lows ever since bottoming in April, dip-buyers will be keen to step in on any short-term weakness we may see moving forward. For as long as support now holds at $5.00, the bulls will be happy. The line in the sand is now at $4.79, marking the recent low.
The macro backdrop remains bullish, with global copper demand seen rising significantly in the coming years. This is primarily due to the global energy transition and technological advancements. Copper is used in electric vehicles, solar panels, wind turbines, as well as the more traditional uses like construction and electronics. With the AI revolution, another source of demand for copper consumption will be from data centers.
By Fawad Razaqzada, market analyst with FOREX.com

Could the Copper drop from here?The price has rejected off the resistace level which is a pullback resistance that aligns with the 61.8% Fibonacci retracement and could drop from this level to our take profit.
Entry: 4.8811
Why we like it:
There is a pullback resistance level that aligns with the 61.8% Fibonacci retracement.
Stop loss: 4.9661
Why we like it:
There is a pullback resistance level.
Take profit: 4.7176
Why we like it:
There is a pullback support level.
Enjoying your TradingView experience? Review us!
Please be advised that the information presented on TradingView is provided to Vantage (‘Vantage Global Limited’, ‘we’) by a third-party provider (‘Everest Fortune Group’). Please be reminded that you are solely responsible for the trading decisions on your account. There is a very high degree of risk involved in trading. Any information and/or content is intended entirely for research, educational and informational purposes only and does not constitute investment or consultation advice or investment strategy. The information is not tailored to the investment needs of any specific person and therefore does not involve a consideration of any of the investment objectives, financial situation or needs of any viewer that may receive it. Kindly also note that past performance is not a reliable indicator of future results. Actual results may differ materially from those anticipated in forward-looking or past performance statements. We assume no liability as to the accuracy or completeness of any of the information and/or content provided herein and the Company cannot be held responsible for any omission, mistake nor for any loss or damage including without limitation to any loss of profit which may arise from reliance on any information supplied by Everest Fortune Group.

Bullish rise?COPPER has reacted off the resistance level which is an overlap support and could potentially rise from this level to our take profit.
Entry: 4.7862
Why we like it:
There is an overlap support level.
Stop loss: 4.7410
Why we like it:
There is a pullback support level.
Take profit: 4.8881
Why we like it:
There is a pullback resistance level.
Enjoying your TradingView experience? Review us!
Please be advised that the information presented on TradingView is provided to Vantage (‘Vantage Global Limited’, ‘we’) by a third-party provider (‘Everest Fortune Group’). Please be reminded that you are solely responsible for the trading decisions on your account. There is a very high degree of risk involved in trading. Any information and/or content is intended entirely for research, educational and informational purposes only and does not constitute investment or consultation advice or investment strategy. The information is not tailored to the investment needs of any specific person and therefore does not involve a consideration of any of the investment objectives, financial situation or needs of any viewer that may receive it. Kindly also note that past performance is not a reliable indicator of future results. Actual results may differ materially from those anticipated in forward-looking or past performance statements. We assume no liability as to the accuracy or completeness of any of the information and/or content provided herein and the Company cannot be held responsible for any omission, mistake nor for any loss or damage including without limitation to any loss of profit which may arise from reliance on any information supplied by Everest Fortune Group.

Lundin Mining Outlook - Copper trade - Coming monthsIm getting really bullish on this stock. With a few copper mines left in the world with tiny lifespans, Lundin mining comes in with copper mines that will deliver for the next 15-20 years. Taking advantage of these high copper prices in the coming raging bull market.
If the price close above the upper resistance line then it will most likely take off. Eventually we will most likely get a pullback to make the resistance line to a support level. Im using DCA method for entry on this one.
Always make your own analysis and your own decision. Don´t see this as a financial advice. I only show you what I do. Nothing else.
OMXSTO:LUMI
CMCMARKETS:COPPERN2025
COMEX:HG1!
OANDA:XCUUSD
CAPITALCOM:COPPER
