COPPER Potential for Bearish DropOn H4, with the price moving below the ichimoku cloud, we have a bearish bias that the price may drop form the sell entry at 3.3747, where the swing low and 61.8% fibonacci retracement are to the take profit at 3.2362, where the swing lows are. Alternatively, the price may rise to the stop loss at 3.4543, which is in line with the 23.6% fibonacci retracement and overlap resistance.
Please be advised that the information presented on TradingView is provided to Vantage (‘Vantage Global Limited’, ‘we’) by a third-party provider (‘Everest Fortune Group’). Please be reminded that you are solely responsible for the trading decisions on your account. There is a very high degree of risk involved in trading. Any information and/or content is intended entirely for research, educational and informational purposes only and does not constitute investment or consultation advice or investment strategy. The information is not tailored to the investment needs of any specific person and therefore does not involve a consideration of any of the investment objectives, financial situation or needs of any viewer that may receive it. Kindly also note that past performance is not a reliable indicator of future results. Actual results may differ materially from those anticipated in forward-looking or past performance statements. We assume no liability as to the accuracy or completeness of any of the information and/or content provided herein and the Company cannot be held responsible for any omission, mistake nor for any loss or damage including without limitation to any loss of profit which may arise from reliance on any information supplied by Everest Fortune Group.
Copper

Metals Copper idea (01/09/2022)Copper futures
The rise of the metal depends on the support point 3.1315 to achieve the bullish movement, and we expect the metal to decline to end the correction in wave 2 before completing the rise again, and the decline may reach 3.3450 prices or it may extend to 3.2510

copper longlooking for a long set up in copper with confirmation. this chart doesnt give you signals but a way i see the market and suits my trading style.


Metals Copper idea (29/08/2022)Copper futures
The rise of the metal depends on the support point 3.1315 to achieve the bullish movement, and we expect the metal to decline to end the correction in wave 2 before completing the rise again, and the decline may reach 3.3450 prices or it may extend to 3.2510

XCUUSD - 240 MINS CHARTThe Structure looks good to us, waiting for this instrument to correct and then give us these opportunities as shown on this instrument (Price Chart).
Note: its my view only and its for educational purpose only. only who has got knowledge in this strategy will understand what to be done on this setup. its purely based on my technical analysis only (strategies). we don't focus on the short term moves, we look for only for Bullish or Bearish Impulsive moves on the setups after a good price action is formed as per the strategy. we never get into corrective moves. because it will test our patience and also it will be a bullish or a bearish trap. and try trade the big moves.
we do not get into bullish or bearish traps. we anticipate and get into only big bullish or bearish moves (Impulsive moves).
Just ride the bullish or bearish impulsive move. Learn & Know the Complete Market Cycle.
buy low and sell high concept. buy at cheaper price and sell at expensive price.
Keep it simple, keep it Unique.
please keep your comments useful & respectful.
Thanks for your support....

Copper on buy mode Copper may be bought on above 640 target may come as shown in chart ..Get out of all long position if goes below 598..
Happy Trading...
For next week from 25th July to 29tj July 2022
Idea expressed for analysis and tutorial only..

Sell setupThe narrative: There has been a lot of talk about inflation and a china reopening but coppers recent collapse indicates something more ominous may be brewing.
The model-
Sell: 3.6525 or higher
Stop: 3.7200
The Ingenuity Trading Model is a Geometric Hidden Markov Model with specific inputs related to Price, Time, Volume , and Volatility. The model attempts to predict local minimums and maximums (reversals) on a daily and weekly basis... stay curious

Metals Copper idea (22/08/2022) Copper futures.
The rise of the metal depends on the 3.1315 support point to achieve the bullish movement, and we expect the metal to rise in the near term and also in the long term, it may rise from the current prices and the second wave has ended or the decline continues to the 61% level at prices of 3.3440 and the second wave ends there

Copper to 3.40 ?"Head and Shoulders" formation on the 4H Chart
Measured Target 3.4 which, if you are a fan of fibs, is also a 1.61 level.
Invalidation ~3.60

Copper analysis: Has the bear market rally ended already?After a 37% decline from its peak of $5.03 per pound in early-March 2022, copper has risen 14% since July's lows.
However, the metal has recently been unable to overcome key resistance levels represented by the 50-day moving average and the descending channel trendline, as fresh worries about global growth slowdown and monetary policy tightening reemerged this week.
Key macro events of the week:
China, the world's largest consumer of copper, unexpectedly lowered lending rates in an effort to boost demand after reporting weaker-than-anticipated July numbers for industrial production (3.8% vs 4.6% expected), fixed asset investments (5.7% vs 6.2%), and retail sales (2.7% vs 5%).
In the United States, the New York Empire State Manufacturing Index plunged to -31.3 in August of 2022, from 11.2 in July. This is the lowest reading since May of 2020, and it indicates that business activity is weakening as a result of a collapse in new orders and shipments.
Germany's ZEW economic sentiment index has fallen to its lowest level since October 2008, and the UK inflation rate has risen to double digits, the highest in 40 years, adding fuel to the fire and reigniting fears of a global recession.
Ultimately, the Minutes of the FOMC's July meeting revealed that there is still a long way to go before declaring the war on inflation won, with members indicating that adopting a more restrictive policy stance was critical to avoiding a worsening of inflation expectations. This implies that the Fed's tightening is far from over.
Copper technical analysis
A bear market rally that is nearing exhaustion can be seen on the copper daily chart. The price action this week has been unable to break above both the bearish channel and the 50-dma, the RSI has tilted to the downside, and the MACD is getting close to a bearish crossover.
A similar pattern occurred earlier this year, in the first week of June.
After a 14% rebound from May's lows, copper briefly surpassed the 50-day moving average before beginning a severe, steep decline that lasted until mid-July. The RSI and MACD indicators both showed similar patterns to what we are seeing now.
Bottom line, a copper's short-term pullback to the bearish channel's midline in the $3.2-3.3 area seems more likely, given the current technical setup. Breaking decisively the 50-dma and bearish channel resistances would invalidate the thesis and raise the odds of a $4.00 per pound test.
Idea written by Piero Cingari, forex and commodity analyst at Capital.com

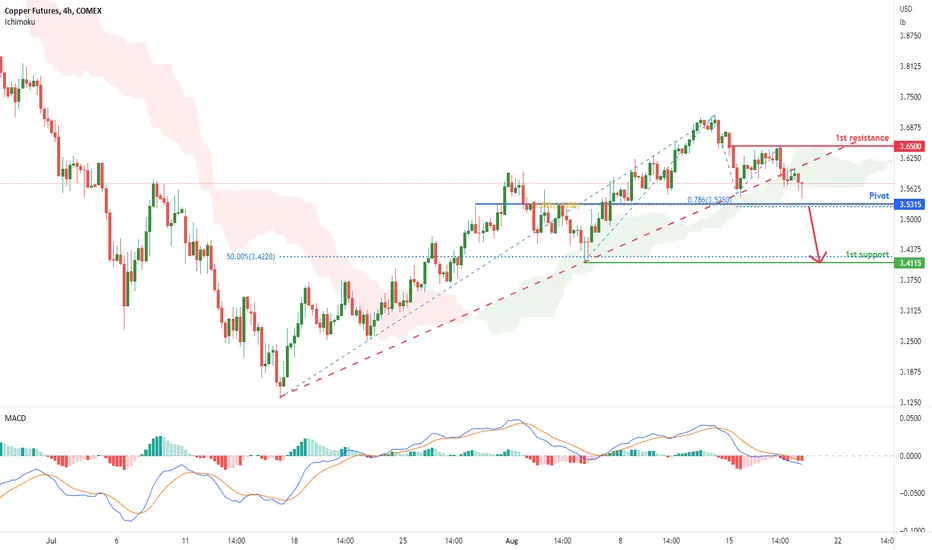
Copper Futures (M6E1!), H4 Potential for Bearish DropType : Bearish Drop
Resistance : 3.6500
Pivot: 3.5315
Support : 3.4115
Preferred Case: On the H4, with the price breaking the ascending trendline and ichimoku cloud, we have a bearish bias that the price may drop from the pivot at 3.5315, which is in line with the 78.6% fibonacci projection and 61.8% fibonacci retracement to the 1st support at 3.4115, where the 50% fibonacci retracement and swing low are.
Alternative scenario: Alternatively, the price could rise to the 1st resistance at 3.6500, where the pullback resistance is.
Fundamentals: The copper price fell as the market worries about demand in China surfaced due to weak economic data and a firmer dollar. Meanwhile, Chinese property developers sharply cut investment in July, while new construction starts suffered their biggest fall in nearly a decade.
NGAS:H2Important levels are drawn on the chart
.The price is at a resistance level
.We are looking for a SELL position
.As each trend breaks, the target will be the next trend
.📢 Please follow your strategy, , this is just my idea
.🙌Please do not forget the ' like' button & Share it with your friends
.✍ I will be glad to see your ideas in this post
.🧲Follow me to see more analysis

COPPER PENNANT CONTINUATION TRADEWe have stuck religiously to the support trend line and are now seeing a break of resistance, once we break short term trend line upward, there will be perfect entry for bullish trade

Copper Trading The Corrective SequenceIn this update we review the recent price action in Copper and identify the next high probability trading opportunities and price objectives tot target

Copper Daily : Elliott wave analysis, potential target rangeIf copper price action respects my Elliott wave count in daily timeframe, expect the 5th wave to start sometime sooner. Please refer to my previous analysis of copper in 60 min time frame.
Looking at Elliott wave counts, wave#3 was greater than wave#1, so I am expecting wave#5 to be at least equal to wave#1 (see the vertical yellow bars), based on this assumption the target range for wave#5 is : 2.96 to 3.02
I am using two technical indicators 1) Monthly and Weekly Pivot Points and 2) Fib extension, on top of Elliott wave counts to decide when to get in a short trade and when to get out.

copper short or longcopper is forming a descending triangle and ready for break out.
waiting for break out either down or up.

Copper glimmerJust broke my downtrend boundary, MACD looks promising, 28 MA coming down for the challenge....first day of a break in copper for a relief rally?

I'm not saying it is Aliens, but...GOLD/COPPER vs TLT
They have a history of correlation as per the chart, but the TLT is way above the ratio... Could be nothing, or it could be the bond bulls are off-side. The chart doesn't go back to the 90s, so I would take it with a grain of salt. This is something one should be cognitive of when they are making big macro picks.

How To Go Short Copper (HG)Hi Traders,
This post takes a look at how we can go short on copper. There is a very simple setup to take if price does what I expect it to do. On the daily time frame, Price has managed to give a deeper rejection than I had anticipated in my last copper post, You will see that we are currently rejecting a resistance level on the daily, If you wanted to, you could add fib tool in order to add more confluence. We also have confirmed lower lows and lower highs and I would like to see the current structure price shorting opportunities to go with the overall trend.
On my trading time frame, Price is now facing a minor support level at 3.3800 which could give a short-lived rejection. I would then like to see the break below the level and retest so we can start looking for shorts. Because I am anticipation a new low on the commodity I will be holding my position all the way to 1.3100. The basic break and retest setup is what I will be waiting for on this one.
Looking at the flip side, the current near-term trend is still bullish and It could break the resistance shifting structure all the way bullish. Remember the smaller time frames eventually build into the higher timeframes. I will only be interested in buying above 3.4470.
be sure to keep an eye out on this one. Untill the next post.
Renaldo Philander.

COPPERFollow me to get profit from the market
After the pullback, we can enter the long position. We place a stop of 30 pips
You need to check for yourself
This is a suggestion
Trading is risky

copper can buy for fiboretracementfiboretracement now can buy for copper
Anglo copper output down year on year
Anglo American’s copper output is still suffering from lower grades and water shortages in Chile, while diamond guidance was lifted thanks to strong demand and operations.

MR.COPPER .618 MAJOR SUPPORT 4 now Chart posted is that of copper . we have 3 legs now down in the bear market . a natural target for support as it hit a 618 at BEST you can look for an ABC or abc x abc up until aug25 to sept 2 then CRASH
