Famine and food shortages. How do we invest? RJA and RJIFamine and Food Shortages are the talk over the last month as Russia invades Ukraine. How are we playing this? Where can people look to hedge inflation and war? Here are two simple methods we take a look at to play commodities and agricultural commodities. RJA and RJI by Jim Rogers we believe will continue to rise due to inflation and war. A little fast recently due to war but we expect more corn, wheat, oil, and safflower oil shortages in the next year or two simply based on this war. These commodities will and some are, being used as weapons at this point. I would ask myself, what's more important? Access to a world financial system that I can work around or food for my citizens? I would go with the latter as those with real "stuff" usually have the upper hand. I am not allowed to advertise other social media on TradingView but I can say there is a longer version and more detail out there.
Watch, like, share, comment.
Copper

$SCCO Bullish Copper ChartSCCO is a nice setup in my opinion. After a nice +250% rally, SCCO has formed a solid VCP pattern with nice rounded base and appears to be ready for the next leg up.
Started a position here and will add on a break above 80.
For those looking for less, risk can alarm the breakout and go long there, as we may get one more dip to shake out weak hands before more upside.
I'm long the JUN 90 calls to give this trade time to work , with 2,300 OI
First price target $96

Copper: Classic Trend-Following Setup
Copper is trading in a sharp bullish trend.
Recently the price dropped nicely.
The market reached a strong confluence area:
the blue zone is based on 786 retracement of a major impulse leg and a horizontal structure on the left.
From that zone, I will expect a bullish movement to
820
848
❤️Please, support this idea with like and comment!❤️

Vox Royalty Smoothes Out VolatilityHaving multiple royalties within a portfolio means Vox Royalty has enough diversification to clearly smooth out the volatility.
High inflationary environments are great for commodities and equities, but for miners, there is an increase in costs and CapEx. Not so with the royalty company.
Their expenditure doesn't change but they have access to the widening profit margins when each of the producers realise their gains.
TORONTO, ON / ACCESSWIRE / March 8, 2022 / Vox Royalty Corp. (TSX.V:VOX)(VOTCQX:VOX) ("Vox" or the "Company"), a high growth precious metals focused royalty company, is pleased to provide recent development and exploration updates from royalty operating partners Gold Standard Ventures Corp. (TSX:GSV) ("Gold Standard Ventures"), Genesis Minerals Limited (ASX:GMD) ("Genesis"), Develop Global Limited (ASX:DVP) ("Develop"), Norwest Minerals Limited (ASX:NWM) ("Norwest"), and Alamos Gold Inc. (TSX:AGI) ("Alamos").
Spencer Cole, Chief Investment Officer stated: "The past month of royalty operator newsflow includes the exciting release of the South Railroad feasibility study, ongoing exploration success at Sulphur Springs, Puzzle North and Bulgera, capped off by consistent development guidance for Lynn Lake. Each of these projects are being aggressively progressed by well-capitalized operators towards near-term resource updates and development decisions. 2022 continues to be shaping up as a record year for the Vox royalty portfolio based on these developments."
Key Development Updates
Robust feasibility study released for the South Railroad gold project in Nevada by Gold Standard Ventures;
Exceptional drilling results set to underpin growth at Puzzle North gold project by Genesis;
Strong drilling results at the Sulphur Springs copper-zinc project by Develop are likely to result in a significant resource upgrade;
Positive drilling results at the Bulgera gold project by Norwest; and
Significant capital budget planned in 2022 by Alamos for the Lynn Lake (MacLellan) gold project.
South Railroad (Pre-Feasibility) - Robust Feasibility Study Released(1)
Vox holds a 0.633% net smelter return royalty with advance minimum royalty payments over key portions of the South Railroad gold project, which is located in the prolific Carlin Trend of Nevada;
Vox has been receiving advance minimum royalty payments from Gold Standard Ventures since October 2021;
On February 23, 2022, Gold Standard Ventures announced the following feasibility study results:
After-tax IRR of 62% and NPV5 of US$487M at Spot Gold Price (US$1,899.20 per ounce) and after-tax IRR of 44% and NPV5 of US$315M at US$1,650 per ounce gold ("Base Case Gold Price");
Payback of 1.6 years at Spot Gold Price and 1.9 years at Base Case Gold Price;
29% increase in Mineral Reserves to 1.6 million gold ounces;
10.5-year operating life with total gold production of over 1 million ounces, with an average gold production of 152,000 ounces over the first four years;
Launch of construction financing process, targeting 75% from non-equity sources, to be completed this year in advance of final construction permits; and
Orion Mine Finance to provide Gold Standard Ventures with a term sheet of up to $200 million to support the construction of the South Railroad Project.
Vox Management Summary: These compelling feasibility study results closely match Vox management's estimates formed during due diligence for the South Railroad rancher royalty. This high-return project is being fast-tracked towards a first production target in 2024, based on Gold Standard Ventures management guidance.
Kookynie (Pre-Feasibility) - Exceptional Drilling Results at Puzzle North Discovery
Vox holds a A$1/t production royalty on part of the Kookynie gold project(2);
On February 3, 2022, Genesis announced:
Outstanding new results from reverse circulation ("RC") drilling across multiple areas, confirming potential to expand the mineral resource at the Ulysses Gold Project near Leonora in Western Australia;
Broad, high-grade zones of gold mineralisation intersected from shallow depths in RC drilling at the Puzzle North Discovery, including:
21USRC1186: 27m @ 8.18g/t Au from 30m;
21USRC1190: 34m @ 13.36 Au from 42m, including 1m @ 382.6g/t Au from 68m; and
21USRC1192: 29m @ 2.91g/t Au from 52m;
Drilling at Puzzle North has now defined mineralisation over 600m of strike and up to 100m width, with the mineralisation remaining open both at depth and along strike;
Mineralisation at the southern end of the Puzzle pit extended over 200m south with results including:
21USRC1114: 11m @ 2.20g/t Au from 82m;
21USRC1119: 4m @ 9.07g/t Au from 92m;
21USRC1123: 5m @ 5.98g/t Au from 79m; and
21USRC1127: 47m @ 1.07g/t Au from 95m;
A large drilling program is currently being planned for the Puzzle North to Puzzle corridor.
Vox Management Summary: This exciting gold exploration royalty that Vox acquired for less than A$150k in 2020 is being rapidly drilled to include the royalty-linked Puzzle North discovery in an expanded feasibility study at the Ulysses gold project. The potential development timeline for this project from exploration to development continues to exceed Vox management expectations.
Sulphur Springs (Pre-Construction) - Strong Drilling Results Point to Significant Resource Upgrade
Vox holds a A$2/tonne production royalty (capped at A$3.7M) on the Sulphur Springs copper-zinc deposit and an uncapped A$0.80/tonne production royalty on the Kangaroo Caves deposit, which is part of the combined Sulphur Springs project;
On February 10, 2022, Develop announced:
It has now received ~60% of the assays from the A$10M resource infill and exploration drilling program at Sulphur Springs;
The drilling has been highly successful, with numerous high-grade mineralisation intersections of more than 50m, significantly thicker than anticipated and with two of the intercepts being the thickest intersections achieved in the project's history;
The results point to a substantial conversion of Inferred Resources to the higher confidence Indicated Resource classification;
The upgrade in Indicated Resource classification will pave the way for Develop to update reserves, mine development plans, project costings and to finalise funding options;
Exploration drilling has also returned outstanding results, paving the way for an increase to the total resource;
A resource update is scheduled for mid-2022; and
Preparations for construction of the exploration decline are proceeding rapidly with the approval request submitted. This will be pivotal because it will enable drilling to be conducted faster, and cheaper and brings forward capital/access to the underground deposit.
Vox Management Summary: Under the new leadership of Northern Star Resources founder Bill Beament, the Sulphur Springs project is on track to be expanded in resource size and fast-tracked into underground decline development within the next 12 months. This drilling success indicates that the potential economics of this high-grade copper project are improving month to month.
Bulgera (Exploration) - New High-Grade Drilling Results
Vox holds a 1% net smelter return royalty over the Bulgera gold project;
On February 3, 2022, Norwest announced:
The first three of seven diamond drill holes extend new high-grade gold lode to beyond 400m down dip of the shallow Bulgera open pit;
Drill results included:
BDD21003: 11.3m @ 3.25g/t gold from 260m (downhole), including 4m @ 4.5g/t Au from 260m and 3.3m @ 5.3g/t Au from 268m;
BDD21001: 16.5m @ 1.20g/t gold from 128m and 3m @ 4.10g/t gold from 166m;
BDD21002: 6m @ 2.07g/t gold from 195m;
It is sourcing a drill rig to undertake the Phase 2 diamond drill program (targeting March/April 2022) which will test mineralisation to ~700m down-dip of the Bulgera open-pit; and
Norwest's CEO, Mr. Charles Schaus commented: "Assay results from the first 3 diamond holes confirms that strong gold mineralisation extends beyond 400 metres down dip of the shallow Bulgera open pit. Once the gold assays from the remaining 4 diamond holes are received (over the coming weeks), the Company will commence re-modelling the Bulgera gold resources which should add considerably to the current, 94,000-ounce, gold resource reported in April 2020".
Vox Management Summary: Norwest management are now guiding towards a remodelled and expanded resource estimate for the past-producing Bulgera gold project which would increase the value of Vox's royalty. Oxide ore from Bulgera was last processed at the nearby Plutonic gold mine in 2004 and given the haul road remains in place, credible near-term development options are available for Bulgera.
Lynn Lake (MacLellan, Feasibility) - 2022 Capital Budget
Vox holds a 2% gross revenue royalty (post initial capital recovery) on part of the MacLellan deposit at the Lynn Lake gold project;
On February 23, 2022, Alamos announced:
the total capital budget for Lynn Lake in 2022 is US$14M, including US$11M for development activities and US$3M for exploration;
Development activities will be focused on environmental work in support for permitting detailed engineering and other site access upgrades; and
The approval of the Environmental Impact Statement for the project is expected in the second half of 2022, following which Alamos expects to make a construction decision.
Vox Management Summary: Alamos management has been very consistent in guiding towards a 2022 construction decision at Lynn Lake and is currently guiding investors towards 2025 first production in its corporate presentation. Alamos' 2022 capital budget further supports its consistent project development guidance.
Qualified Person
Timothy J. Strong, MIMMM, of Kangari Consulting LLC and a "Qualified Person" under National Instrument 43-101 - Standards of Disclosure for Mineral Projects, has reviewed and approved the scientific and technical disclosure contained in this press release.
About Vox
Vox is a high growth precious metals royalty and streaming company with a portfolio of over 50 royalties and streams spanning eight jurisdictions. The Company was established in 2014 and has since built unique intellectual property, a technically focused transactional team and a global sourcing network which has allowed Vox to become the fastest growing company in the royalty sector. Since the beginning of 2019, Vox has announced over 20 separate transactions to acquire over 45 royalties.

FCX Cup and Handle? Targeting $68 for ~48% gain!Copper looks like its making strong moves and FCX is one of my top interests in the metals sector
Possible Cup and Handle with measured move targeting $68 for ~48% gain!

✅COPPER BULLISH BIAS|LONG🚀
✅COPPER is trading in an uptrend
With the pair set to retest
The rising support line
From where I think the growth will continue
LONG🚀
✅Like and subscribe to never miss a new idea!✅

THREAD #2 : Commodities Update ‼️How it works ?
Ask me in comment my chart analysis of the asset you want if it didn't have already done under. If I find something intersting to say and show, I will update the idea with it. A comment of each asset expose will be post under, come react about it or debate.
Before to start I want to remind that we are in a period of conflict and news can emerge at any moment with strong effect and reaction on market. So invest carefully on this hard times and reduce your loss exposition on market when you can. Don't forget to take profit too.
"Making money in trading is math and respect of strategy, so never let your emotions guide you in uncomfortable positions"
As I've already done ideas on copper last months, let's start with it.
COPPER ✅
First of all, if you follow my ideas you can see it's the same chart than the 29th of December when I posted it and the 20th of January for the trade. It is attached under and I invit you to see it because it will be the continuation of these analysis.
So we are always in the Wyckoff Accumulation which have been developped, pullback on creek is done, and SOS too. Unfortunetly SOS failed so for me it's an end of the pattern. By consequence major part of my position have been closed and I will explain next why I keep a little which I not do usually. Why SOS is a fail ? Simply because we have selling volume, on the resistance area, on a primary resistance (yellow line) and because we have also selling pressure in it. The work have been done for the pattern, we took profit but can't project anymore in a term of "Wyckoff accumulation" of a bull continuation. So what to expect now from it ? The standard expectation after a failed SOS is to go back on the support area, usely rapidly and strongly, and invert the pattern in a way that we will now test the buying strenght on support. So we can expect a retest of support with an SOS to see, if it succeed, a bear continuation. That my scenario (a), and technically the most probable for me. BUT we have to live with our time and with the macroeconomic dynamic that we deal with. I will not hide that if the conflict between Russia-Ukraine continu and maybe gets worse, this will be a boost for every metals assets. That why I closed only 80% of my position, I can't advise to take long position anymore but it's could be wise to take profit and keep a part of your position if you are already in it. We can handle the technics evolutions but we can't handle the macroeconomic evolutions. If it this scenario (b) happen, we will see the construction of an LPS around $4.60 before to break up to the target around $5.70 in a first time. Take care of volatility, it will swing.
GOLD ✅
Like for the copper, the chart don't have change since the commodities update of the 20th of January. We are coming to the end of the bull scenario. I invit to take profits on the conjoncture of the resistance area and the (2c) resistance. There is no interest to sell a refuge asset like gold, even more in this time of conflict. So if there is selling signals take it like an opportunity to buy it lower. Especially here, we will wait for buying signals on the (1b) or (1a) support and the best case would be the support area of $1,700 - $1,675 but far from now. For peoples already exposed on it, if it continu is bull movement and breakout the resistance area, we will be in price discovery so it's always hard to find targets in it because of volatility, but I don't expect it to go higher than $2,500 - $2,600 where we will probably find a big selling pressure.
SILVER ✅
Like targeted in the last commodities update we are now on resistances of the downward channel. I don't expect a breakout of (1b) and the resistance area, so for me we will see the construction of a range between them around $27 and $29. The biggest probability for me is a bull outcome of the range to target the (1c) resistance (scenario A) and probably more after. If we reject the resistance strongly after lateralization I expect price to go deeply retest the (1a) support around $20 (scenario B). And finally if we see a reject of (2a) / (1b) soon, we could expect a short consolidation to (2b) before to go back again to the resistance area (scenario C). Like every metals, It would be dumb to expose yourself on the bear side in a period of conflict. More wise to wait consolidation and signals around the orange circles areas.
PALLADIUM ✅
Palladium is another successfull prediction we had in the last commodities update. In term of evolution now it is very close from the copper analysis because we made an SOS which has also failed. So technically, the biggest probability is to see it go down on the (2b) line in a first time (scenario A) maybe more with (1a) before to retest the resistance (1b). If the macroeconomic dynamic bring it higher we could see an interesting area to enter on a buying signal on the pullback on (1b) (scenario B). Else we could go straight to (1c) around $4,500 - $4,600 before to see a strong selling pressure on price discovery.
PLATINUM ✅
Platinum is also targeting the prediction of the last update. In term of perspective now it's more blurry for it. The most interesting pattern that we could see is for me a reject of (2a) to go down to (2b) which could be a nice entry on signal around $950. Else, probabilities to see it continu on the bull side are strong but I'm not confident on any areas, except the support of $860, to target entries once we will reach the resistance area of $1,340 - $1,270.
CRUDE OIL ✅
I said in last update : "If I had an advice to give : stay away or be on short timeframe on this asset. Too much risk to see price manipulated by news on this public interest asset." and so after +30% in a week we have to look back on montly timeframe to search resistances. I believe in the fact that it will fall as rapidly as it surged and I also believe in the fact that we will not stay a long time at this level. Oh .... wait ! Just don't take care of what I just said, like the last commodities update it's just a manipulated asset and price will go where OPEP want to see it. So stay away of it.
For those who really want my technical analysis it is : I think we can do an ATH just to say : "It's all time high !" but we will find a strong selling pressure because of (1b) and fall down rapidly.
WHEAT ✅
Similar to oil technically, boosted by the macroeconomic context we did a new ATH and seen a strong selling pressure. However I don't think it's wise to sell it. We totally outbreak the range we was looking to in the last update, now if we break the resistance it could go really high but you will be attached to macroeconomic news so I advise to also stay away of it in both side.Take profits if you are exposed on it.
SUGAR ✅
Rectification from the last update : we are always in the Wyckoff reaccumulation. I thought it failed because of the candle of the 10th of January but it seems to be an anomaly of market and the structure around the 28th of February confort me in the fact that it is a spring. Now we have jumped over the creek so the best area to target entry is, like for the copper pattern, the pullback on the creek. It's exactly the same pattern that we had on copper now, so just wait signals. If it go straight without pullback just let it go and don't buy in the resistance area before a breakout, there is a lot of resistances which will bring many pressure I think for the SOS.
🛑 Like, follow or comment if you like, it give me some strength to continue! 🛑

One of the best spot of 2022 already here AND commodities updateFirst this idea is attached to another idea I've posted last year, you can find it attached to this one and it explain all the pattern we are working here: the Wyckoff Reaccumulation on Copper (HG1!). So you will find here, my entry, my plan for this trade and the update about the related idea. I will also do an update about the materials market, expectations and targets in form of a thread in comment so don't forget to follow the idea to see it.
So first the update of the related idea. I said for the end of the Wyckoff reaccumulation pattern that I didn't expect a spring, and my poisition about it is always the same. It will be interesting to see if buying volumes continues to grow, but if it's the case it will be the confirmation of that statement. For the moment, I think we are targeting the resistance area and an SOS to see if we could expect the confirmation of the global pattern and so a bullish continuation. I also said that I will aim for an entry on the retest of the creek. Retest happened exactly on the January 6th for the bottom and I didn't find interesting setup to entry on it, so that why I waited a little to find a setup that could satisfied my interest:
We can see on chart two channel, which have already both gave their target (a is the base support, b is the resistance, c is the target). What interest me here is the reaction on the pullback of (b) resistances of each one. Pullback on (2b) is a perfect V-Turn and pullback on (1b) is an accumulation (I would have preferred if it was an U-Turn but we have an akward double bottom in it).
The structure in volume in this accumulation range is good, we have nice exhaust volume before, buying volumes are bigger than selling volumes (that what we want in a range and also when volumes are impacted by sessions to read them, typically on hourly timeframe) and to finish we have a nice breakout with buying volumes so the setup is completed.
Now in term of plan, in a question of regularity in profitability, I'm looking for a ratio of 2:1 which bring us in the resistance area (which is good with our plan of Wyckoff pattern which expect an SOS around here). Exception here, because of the Wyckoff Reaccumulation pattern I don't expect a full target, but only around 40%, then 20% on the first SOS and to finish (if the SOS setup is convincing of course, else it will be out before) last 40% on the 1st objective of the Wyckoff pattern around $5.688 .
It's really important to take multiple profit when you are on long term timeframe. The more you are on market the more there is risk to see change in patterns, in dynamic macroeconomic ... And so, less your probability of success is high. So take profit, fix targets/price and don't be afraid to take profit at the top, don't wait market to fall back.
Else, secure your earnings, you can't lose money on winning trade! That why for my trades, I'm mostly breakeven at 1:1 ratio.
Another time, I invite you to check the first idea I posted, attached to this one.
Now I think we made the turn for copper, if you have questions be free to ask me in comments.
I will now update the idea with other commodities perspectives. I will comment only those where I have identify patterns in my strategy with area to target for entry.
I think metals assets will be one of the key of 2022, most of charts are well oriented to see bullish progression, macro-economically it is also oriented in that way.

Coppe (Comex) - Weekly UpdateComex Copper - Weekly
Bottom Line : Adjusted wave count: Comex Copper may complete a flat correction by rising to a new high.
Comex Copper may be rising in wave (C) of a flat correction developing as wave X (circled) of an ongoing bear market from 2011.

Oil $ 150? T.F(1MONTH) (3/7/22)📉📈We expect the price to be $ 150 after forming a pattern on the floor and shoulders and breaking the neckline
⚠️ This Analysis will be updated ...
📊 #OIL (BRENT OIL )
💹 Time Frame :MONTH
👤 hosein alizadeh
📅 3/7/22
❤️ If you apperciate my work , Please like and comment , It Keeps me motivated to do better ❤️

COPPER new highs Copper is reaching new all time highs faster than we can blink.
The price of everything will go up, triggering a global recession.
NO FED can control this

Copper is ready for higher pricesCopper's been trading tightly above the 50d/200dsma and is joining the commodities boom seen in agriculture and energy
Here's a view of the weekly chart with the 50 week moving average. That tightness in price action is exactly what you want to see before a major move higher. Measured target is at least mid 5s

Mar 2, 22 Copper on a tear-Buy or Sell?What is going on with Copper? Price is skyrocketing yesterday and today but why?
We are coming into a world recession sometime this year, inflation is the highest its been in 40 years, interest rates are going up everywhere, all signs that copper price is 'supposed' to be going down.
Any ideas?
Heiko

New Century Resources Optimistic TimesNew Century Resources steps into optimistic times.
With the equity raise done, they are practically debt free, shortly before break even, Zinc prices are high and treatment charges are low, considering paying dividend, consolidated the share price to a better looking number, likely starting to mine copper is Tasmania soon, discovered more resources on their local turf. Not even considering these facts, the stock was highly undervalued before the equity raise. Just need enough people realize that the 2022 target price should be around 4.5AUD - 6AUD instead of the current 1.99AUD.
The trend is visible on the chart..

2/27/22 FCXFreeport-McMoRan, Inc. ( NYSE:FCX )
Sector: Non-Energy Minerals (Other Metals/Minerals)
Market Capitalization: 67.415B
Current Price: $46.34
Breakout price: $46.00 (hold above)
Buy Zone (Top/Bottom Range): $44.45-$41.10
Price Target: $45.90-$46.20 (reached), $56.00-$57.60 (2nd)
Estimated Duration to Target: 100-107d (2nd)
Contract of Interest: $FCX 6/17/22 60c
Trade price as of publish date: $1.16/contract

Jiangxi Copper (USA: $JIAXF) Could See A New Peak In 2022 ⛰️Jiangxi Copper Company Limited engages in exploring, mining, smelting, and refining copper in Mainland China, Hong Kong, and internationally. It offers copper cathodes, copper rods and wires, sulphuric acid, and other products, as well as deposit, loan, guarantee, and financing consultation services. It is involved in the processing and sale of copper and hardware electric products; collection and sale of scrap metals; production and sale of non-ferrous metals, rare metals and non-metals, electrolytic copper foil, spiral and copper tubes, copper and enameled wires, other copper pipe products, and cast iron grinding balls; provision of repair, consulting, and transportation services; exploration, mining, selection, and smelting of gold and chemical; project, industrial, and fund investment, investment management, and investment and economic information advisory services; metallurgical chemistry; equipment manufacturing and maintenance activities; and development and production of thermo-electronic semiconductors and appliances. In addition, it engages in the development of chemical technologies; contracting for mining constructions; production and sale of casting products; maintenance of mechanical and electrical equipment; installation and debugging of equipment; sale of building materials; production of copper sulfate and electrolytic copper; scrap of base metals; and geological investigation and survey, and construction and engineering measurement. Further, it is involved in the sale of mineral processing, fine chemical, and other industrial and domestic products; trading of metal products; machinery processing; manufacture and sale of wear resistant materials; corporate asset and operation management, exhibition services, etc.; and trade and settlement of import-export business, offshore investment and financing, cross-border RMB settlement, and research and development activities. The company was incorporated in 1997 and is headquartered in Nanchang, China.

COPPER Hrly Short | algo tradingCopper hrly short
shortstop @ 4.4788
TP #1 @ 4.4541 75% wr
TP #2 @ 4.4271 50% wr
SL @ swing high 4.5395 17.50% hr
WR and HR determined from past trades on this metal
More trades like this on my profile and on Bifrost Trades.

Copper: Long to mid-term overviewCopper is still building a triangle for wave (4) of of V.
We expect rising to around 6.80 level for wave (5) of of V.
Alternate, declining for current level and break the lower boundary of the triangle as a first move of downside of wave

Copper Futures : H1 Short (Price Action : LH + LL)Copper Futures HGU2021 H1 chart shows series of LOWER HIGHS + LOWER LOWS from July 26 2021. Contrarary to fundamentals (strike in copper mine would create shortage in supply, etc) the technical analysis shows there is a room for some more down side towards 4.285. The downtrend would end if the price trades above previous HIGHER HIGH.

Copper Futures Analysis Aug-17-2021If copper futures price breaks below the lower trend line there is a possibility it will touch 3.8 level in few weeks.

Copper Futures : H1 Short Bearish Flag PatternThis is second Bearish Flag Pattern in Copper Futures chart. Enter a short position now or when it touches the resistance area.

Copper Futures : Technical AnalysisCopper has broken the lower trend line second time, it made lower high on Aug 30 2021. I think it is heading towards 3.7 - 3.8 area to make another lower low.

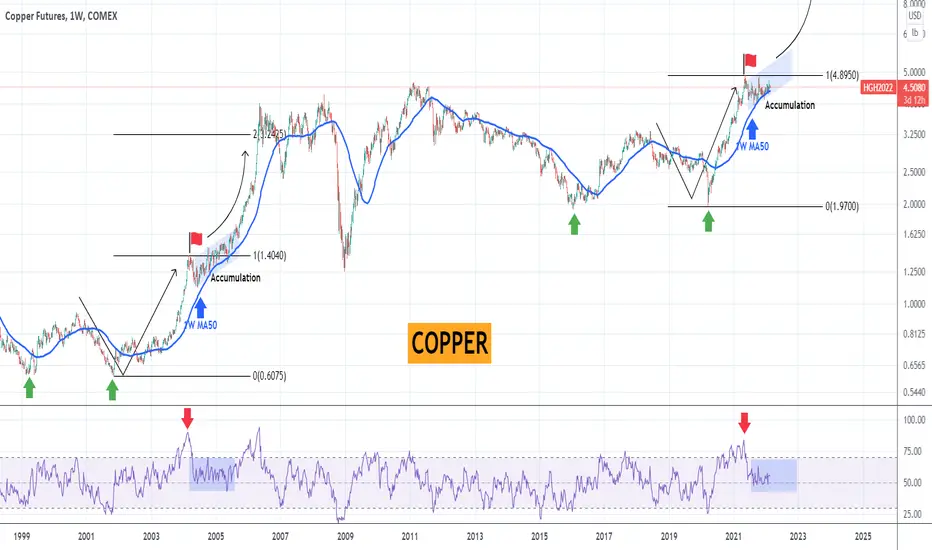
COPPER is one of the best investments on a 2 year basisInvestors looking for value long-term better have a look at Copper, which has been consolidating ever since its May 2021 All Time High (ATH). The 1W MA50 (blue trend-line) has been supporting all this time, indicating that the market has found a new long-term demand zone where buyers step in.
The last time a similar demand level on the 1W MA50 took place was half-way through Copper's historic parabolic rally of the 2000s. In particular, in February 2004, the market made a similar High (red flag), then turned sideways into a +1 year accumulation period, when again the 1W MA50 was supporting. Eventually that demand level initiated the last and more aggressive part of this rally during 2005-2006. The 1W RSI sequences between the accumulation phases of today and 2004 are also identical.
The 2006 rally peaked a little higher than the 2.0 Fibonacci extension. That should be a solid benchmark for long-term investors looking for value.
--------------------------------------------------------------------------------------------------------
** Please support this idea with your likes and comments, it is the best way to keep it relevant and support me. **
--------------------------------------------------------------------------------------------------------