Copper Futures Sell to BuyPrice is approaching to weekly demand zone, so i expect bullish move..there will be a sell move first ...look for LTF BOS before taking trade
Copper

COPPER (XCU/USD) – Week 46 – Heading towards the resistance.In the coming week, we anticipate the price to reach the resistance area highlighted on the chart. We expect this move to have corrective nature.
Trade with care.
Best regards,
Financial Flagship
Disclaimer: The analysis provided is purely informative and it should not be used as financial advice. Remember that you need a plan before you start trading; so, take this knowledge and use it as a guidebook that will ultimately help you understand the market and easily predict your next move.

No brainerYou dont need brain to buy teck here You dont need brain to buy teck here You dont need brain to buy teck here

XAU/USD GOLD Playing out Massive 10 Year Cup and Handle! The gold chart is setting up a beautiful cup and handle since 2011. The target is around $3700 for the measured move of the cup but I dont think it will stop there, I think it will probably continue to run up for years. Indicators on the monthly are about to tear upward in a big move. Gold luck and happy trading. Thank you for checking out my charts and if you have a chart you want me to analyze then let me know. Not financial advice, just what Im doing.

Buy on Copper Price Rally aggressively Towards main resistance
Price lifts from main resistance and then
hovers on cloud on a higher resistance
Lifts from higher resistance
attack cloud and test main resistance
if(above cloud){BUY}

Silver-Copper Ratio breaking outThe breakout of the Silver Copper Ratio suggests Precious Metals outperforming Base Metals over the coming weeks

Five down on gold/copper ratio, into the multi-year support zoneFive waves down on gold/copper ratio into the multi-year support zone, may increase buyers interest in metals.

COPPER (XCU/USD) – Week 45 – Consolidation expected.In the coming days, we are expecting the pair to start a consolidation that has the potential to the resistance level.
Trade with care.
Best regards,
Financial Flagship
Disclaimer: The analysis provided is purely informative and it should not be used as financial advice. Remember that you need a plan before you start trading; so, take this knowledge and use it as a guidebook that will ultimately help you understand the market and easily predict your next move.

Vox Royalty continues towards C$5 million revenue targetTORONTO, CANADA – November 2, 2021 – Vox Royalty Corp. (TSXV: VOX) (“Vox” or the “Company”), a high growth precious metals focused royalty company, is pleased to announce that it has realized preliminary quarterly royalty revenue of C$1,558,800 (US$1,223,400)(1) for the three-month period ended September 30, 2021.
Quarterly revenue benefitted from record royalty-linked gold production by Karora Resources Inc. (TSX: KRR) from the Hidden Secret and Mousehollow deposits at Higginsville covered by the Dry Creek royalty and record royalty-linked iron ore production volumes by Mineral Resources Limited (ASX: MIN) at Koolyanobbing, and consistent royalty revenues from each of the Company’s Janet Ivy gold royalty and Brauna diamond royalty. Royalty revenues relative to Q2 2021 were in line in spite of a significant reduction in realised iron ore pricing at Koolyanobbing.
Quarterly, year to date, and annual revenue guidance figures are summarized in the below table:
Kyle Floyd, Chief Executive Officer stated: “We are pleased to announce another quarter of strong royalty revenue and multiple royalty-linked production records at Higginsville and Koolyanobbing. The Vox portfolio remains on track to deliver revenue at the higher end of our expectations, even in light of revenue guidance doubling in July 2021. Further, we anticipate the first royalty revenue from our Segilola asset during Q4/Q1, following the achievement of commercial production at Segilola in October. The coming quarters present even more value accretive developments for Vox shareholders to look forward to, as we continue our industry-leading organic growth trajectory from 5 to 10 producing assets by late 2023.”

Copper to resume trend higher? resting on 50dmaNice retest of the breakout area. Consolidating and holding above the 50dma for the 3rd successive day. RSI still strong and with the 50dma > 200dma, i expect the positive trend to continue higher shortly..

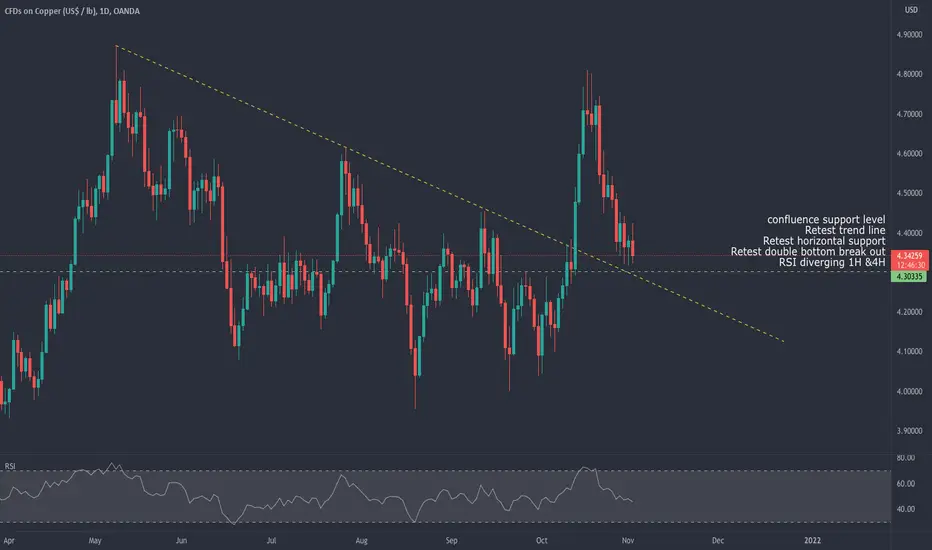
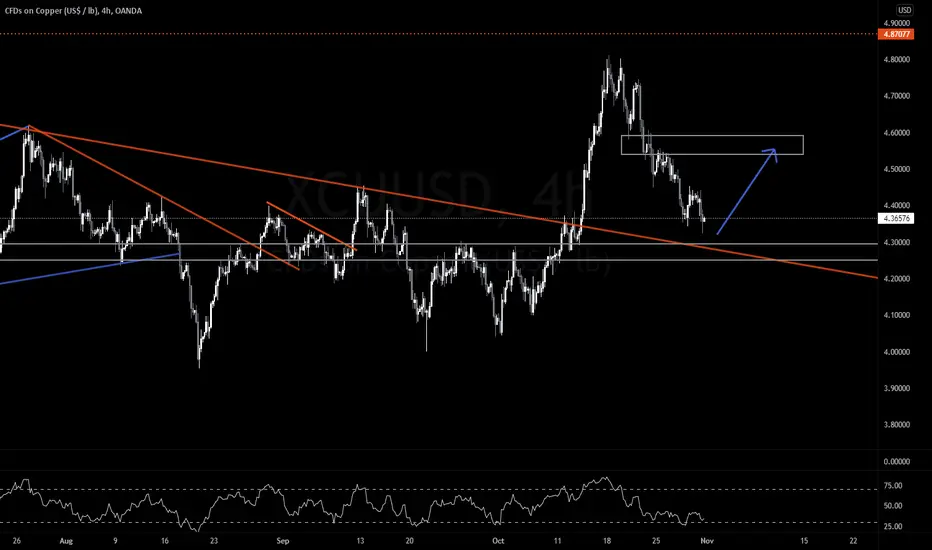
Copper - Confluence level/zoneconfluence support level
Retest trend line
Retest horizontal support
Retest double bottom break out
RSI diverging 1H &4H
All time high break!In my "Copper could go to $8, $20 even" idea published on March 13th I explained I was looking to buy copper, and expected it to go up over more than a year.
I wanted to see the price consolidate over a longer time than what it did and ideally closer to all time high.
It is still possible that it will, just like gold did, after going up significantly above ATH, just like gold did.
I missed out on buying during consolidation but I FOMO'ed on the ATH breakout, I'm a bit mad because I went in with only half size; I have no problem taking bad trades with full size but when I FOMO I take smaller bets even though I keep winning, the margin restrictions do not help also to be fair, once again thank you useless regulators.
In the long term as I said in previous ideas, Copper $8 easy, even $20. If Yellen & the FED follow the example of Rudolf Havenstein copper $20,000,000 why not 😀
How does the CME limit up work when there is hyperinflation? Or strong inflation and strong price appreciation?
NOW is the time to ask this question, it's like with negative Oil prices, you had to think about it BEFORE the events, not AFTER.
Prices could get frozen. We are far from this happening, it will not happen overnight and implied volatility does not simple go from 0 to 100 overnight.
For now we keep an eye on volatility and when it starts getting extreme we look for answers. And we never go all in so even if prices get frozen all our capital won't be.
With Oil I was relieved to see the CME made an announcement that prices could go negative, days before it did. I checked before buying (I was trying to take advantage of the contango).
What happens when prices keep going up is not clear, but if and when volatility starts increasing dramatically the CME and maybe our brokers will let us know.
Remember Oil volatility increased very progressively.
The second question is in the short term, meaning the next couple of weeks or even months, where could the price be heading?
Will it just continue higher and higher or will it do a spike as it's doing now, then have a big correction around ATH?
To help answer this question we can look at other commodities, first gold.
But copper is not gold, it is an industrial metal, used for real, no one is accumulating copper as a store of value.
So next let's take a look at lumber which everyone knows has been going and going and going.
Lumber: retest, but only after going ridiculously high. I copper did this... I'd be happy.
We can look at a couple more examples, the price action is repetitive.
And what best to compare to copper than copper itself?
The price before the 2005-2008 copper bull run was choppy, and it stayed choppy for a while after going past all time high.
It's logical and obvious. Participants do not magically go from uncertain to mega bullish overnight, and the public (nobs) do not simply all "hear about copper" AND buy overnight.
Everyone I think knows about Bitcoin, most of the public heard about it progressively over september-december 2017, mostly the last 2 months.
Some day someone might have heard from a colleague "hey have you heard about this Bitcoin thing?", it's progressive not instantaneous.
And then the public, "mainstreet", joined Bitcoin from late 2017 to early 2019, so over a 1 and a half year period.
The price of copper was vertical before passing all time high. So I expect it to continue on the same trajectory. Simple. Just like Lumber last year.
It's funny to compare copper and lumber, when Lumber past ATH in 2020 it did a doji on the daily chart, with the body in the middle, and copper just had the exact same candle on ATH last week on the 4 hour chart.
Lumber is a MACHINE which has been offering the rich a crazy risk to reward.
Most of us are poor plebes that cannot afford to buy a full lot of lumber (worth $100K-$200K you have to multiply the price by 110) with a risk of $10,000 and potentially much more on a gap. Plus most retail brokers do not even offer lumber.
But we can buy copper mini or even micro lots. Which brings us to the third question. Where to buy?
We already started to answer this question and looked at some examples.
In reality I see only 2 ways to buy (be it spot or a call):
- On a retest of ATH
- FOMO, for example on a 1 hour red candle
There is nothing in between for me, if the price reverses then I would expect it to go all the way down to ATH (implied volatility, support and all).
Considering how the price has been behaving I'd expect something similar to lumber daily chart but on the 4 hour chart.
I would buy any inside bar for example. Possibly even any 1 hour red candle. And as it goes up keep buying more.

Copper could go to $8, $20 evenPushing the price up:
- High demand for EVS, renewable energy production, the Green New Deal, means copper production is below demand and expected to be in shortage for years
- Stimulus spending and inflation of industrial goods
- Producers cannot increase supply fast enough, examples: Freeport CEO "It will take 7-8 years to get new production to the market", "Oyu Tolgoi (Mongolian super mine) is set to bring a further 480,000 tonnes of copper into the market from 2028"
www.mining.com
www.proactiveinvestors.co.uk
Stopping (or slowing) the price from going up:
- Traders taking profit (short term)
- An end to all the renewable projects
- A total collapse of civilization?
This is what happened with the previous price explosion in the 2000s
As the price consolidates around ATH we might want to bet on the price going up up up in usd terms
I'd just go for the DEC 2022 contract, or a DEC 2022 call:
There is a discount on that contract too (backwardation).
At a price of $4 1 contract = $100,000. A 10% stop is a risk of $10,000.
So maybe we'll just take short term trades on the way up. Unless we all become millionaires in a few months with Cryptos?
There is an e-mini for copper but no one trades that, I don't even know if I have access to this and where/what broker? Plus I don't see DEC 22 :(
www.cmegroup.com

Remember Copper? Time to buy (not advice)Hello. I talked about Copper back in March, and then in May, ideas linked below.
It has been 6 months, and after patiently waiting well here we are.
From a "George Soros investment tips" article:
"Short term investing, it must be stressed, is not like day trading. Day trading is really kind of a myth. You can’t just sit at home, follow stock trends and expect to turn a profit from one day to the next. Short term means waiting for months to expect any return on your investment."
Well I did wait 6 months. George Soros waits to buy for months, then he buys, waits for weeks, and then his gains happen over a few days. This is more what I'd expect. Seems like it always works this way.
Don't have much to add about the price going up, now is just the time to buy for me, not much has changed.
Wyckoff spring? Upthrust? Something something. Doesn't matter.
In the short term there was some FUD about China demand which helped create the down movement (typical).
In the medium term USD goes down, commodities go up, maybe energy makes it worse, green transition demands lots of material...
There is a lot we can read about copper, well a bit, not a lot compared to Oil or Bitcoin but still, enough. They talk much about the risk, it could not go up and so on. Great, noob retail gamblers, hedge fund managers, industrials and other hedgers are being careful, wait and see. Best to wait and see, because of the risk. But me? I want the risk, someone has to take it. Yes please give me the risk that's my job. Not for hedgers or gamblers. I'm as close as it gets to being stopped or winning without a greedy entry that would cause me to always miss out. Top inflexion point. Here if it goes to ~$5 I think I'll be making 10 times what I'd lose if stopped. I'm here to enter at the maximum risk, maximum "we don't know let's wait and see", I'm here to take hits.
Once there is certainty we'll probably be close to the top, and there might be a big violent correction with the gamblers snatching profits, also of course the miners want to sell, then the hedge funds that want certainty will be looking to get in on that correction. Not sure what I will do, probably weak hands once I'm at a high multiple of my risk. Probably just take another hit though.

COPPER (XCU/USD) – Week 44 – Market bound for a pullback.In our last week’s analysis, we anticipated the pair to finish the consolidation and make a new top. Instead, the price made a deeper than expected pullback.
For next week, we could see a bullish move developing, at least for correction.
Trade with care.
Best regards,
Financial Flagship
Disclaimer: The analysis provided is purely informative and it should not be used as financial advice. Remember that you need a plan before you start trading; so, take this knowledge and use it as a guidebook that will ultimately help you understand the market and easily predict your next move.
COPPER (XCU/USD) – Week 44 – Prepare your buy setups.In our last week’s analysis, we correctly anticipated the pair to pullback.
For next week, we foresee the pair finishing the consolidation and making a new top.
Trade with care.
Best regards,
Financial Flagship
Disclaimer: The analysis provided is purely informative and it should not be used as financial advice. Remember that you need a plan before you start trading; so, take this knowledge and use it as a guidebook that will ultimately help you understand the market and easily predict your next move.


Copper ready to go down in 2022As we can see copper is in the oversold zone. It can be expected correction 30% or more in 2022.

COPPER is Very Bullish Now! Buy ↗️
Copper dropped to a key level.
Because the market is trading in a bullish trend,
a trend-following movement is anticipated from the underlined cluster.
Be ready to buy!
Please, support this post with like and comment!

Elliott Wave View: Copper (HG) Looks to Extend HigherShort Term view in Copper suggests the rally from September 21 low is unfolding as a 5 waves impulse Elliott Wave structure. Up from September 21 low, wave ((i)) ended at 4.3175 and pullback in wave ((ii)) ended at 4.0545. The metal then extends higher in wave ((iii)) as another 5 waves in lesser degree. Up from wave ((ii)), wave (i) ended at 4.3955 and pullback in wave (ii) ended at 4.3050. The metal extends higher in wave (iii) towards 4.781, wave (iv) ended at 4.7025, and wave (v) of ((iii)) ended at 4.823.
Pullback in wave ((iv)) is proposed complete at 4.537 as a double three structure. However, the metal still needs to break above wave ((iii)) at 4.823 to rule out a double correction. Down from wave ((iii)), wave (w) ended at 4.5935, wave (x) ended at 4.7575, and wave (y) ended at 4.5370. This completed wave ((iv)) in higher degree. Up from there, the metal should end wave (i) of ((v)) soon with 1 more push higher. It should then pullback in wave (ii) before the rally resumes. Near term, while pullback stays above 4.537, and more importantly above 4.309, expect the metal to extend higher within wave ((v)).

$OZL - finishing up the bullflag. Nearly done.DOwn the lift and up the stairs
that SI70 red line is sagging down and needs a shunt from a steep drop to enable this to move up and exit the flag.
Won't be long before BO!

Copper stockpile crisisJust to add to the current global supply crisis, copper LME stockpiles have hit record low. Seeing what happens with this daily retracement.

gold to follow coppers lead?You can draw a bowl on anything.
Earlier this month I played with this idea of #copper because it had 4 touch points and bull flag.
#gold currently looks similar now, with the top of the bowl also being a neckline for a level head and shoulders.
