The relationship between gold, copper and the US10YFirst, can you tell me what you think the relationship between these two curves is? Clearly, these two curves have a strong negative correlation, meaning they move exactly opposite to each other. You can see in the image that their behavior is like a mirror image (from 2007 to before 2022).
You are familiar with the gold-to-copper ratio, right? Now, when this gold-to-copper ratio curve rises, it means that gold is giving better returns compared to copper. This indicates that the global economy is moving away from growth and heading toward a recession. Investors, instead of investing in production (where copper symbolizes production), choose to invest in a safe haven like gold. The opposite happens when this curve goes down.
The lower curve represents the yield on long-term U.S. bonds. When this curve is rising, it means that the supply of bonds is greater than the demand. People are selling bonds, which causes the bond yield to rise. When the curve is falling, it means people are buying bonds, which causes the bond yield to drop.
Why do these two curves move in opposite directions?
Now, let’s get to the main question. The answer to this question is simple: bonds, like gold, serve as a safe haven for investors. When the economy moves toward a recession (when gold offers better returns than copper, and the gold-to-copper ratio is rising), some investors shift towards bonds, and the yield curve drops. That’s why these two curves move in opposite directions.
To summarize the entire story: Movement toward recession = investors moving toward gold and bonds = rise in the gold-to-copper ratio and drop in bond yield curve.
Now it’s clear why these two curves move opposite to each other. The big surprise is coming👇
Since the beginning of 2022, the historical trend has changed. These two curves have started to show a positive correlation! Meaning, everything I mentioned above has gone out the window! Now, the question is: What suddenly happened? There are several analyses, but I believe what changed is that U.S. bonds are no longer a safe haven for investors, as they once were (the same fear signal I mentioned earlier). In fact, after the pandemic, the world has never been the same. This is an important development and it affects many things. I’ve addressed this topic from various perspectives before, and here’s a new angle on it.
For the past two to three years, contrary to the historical trend, investors have been buying gold but selling bonds, and these two curves have been rising together.
As you can see, the analytical situation has changed drastically compared to, say, 10 years ago, and many fundamental facts have shifted. For instance, many people expect the Federal Reserve to lower interest rates and gold to go up again, but after an initial short shock, the story will probably reverse.
#Gold #XAUUSD #HG1!
Copperanalysis

XCUUSD (Copper) hourly trend analysis from April 14, 2025XCUUSD may see a pull back on April 14th. Support zone is at 4.28526 and a bullish trend should be intact post pull back with resistance zones at 5.38 and 5.47176. For entries and exits, I suggest to use your own technical analysis and ensure to trade with Stop-Loss.

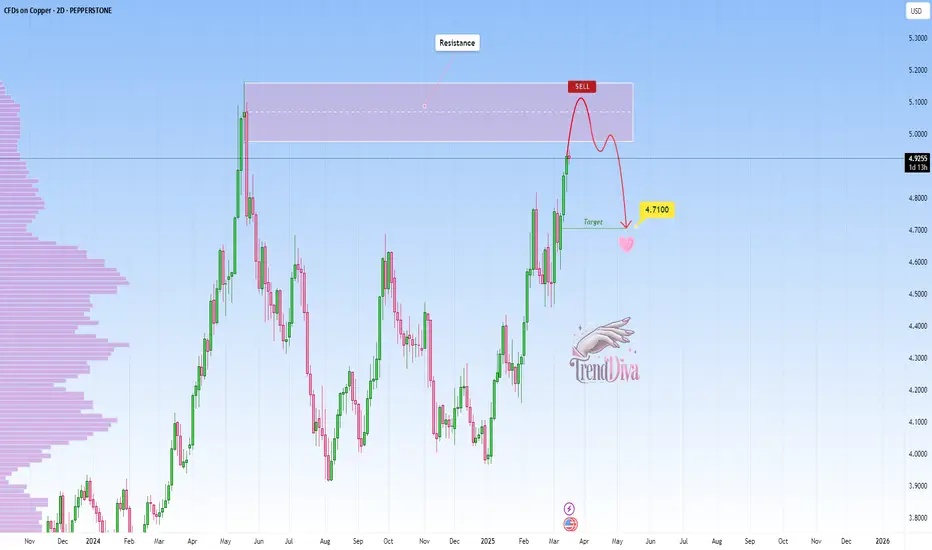
COPPER Approaching Key Resistance — Potential Sell SetupPEPPERSTONE:COPPER is approaching a significant resistance zone, highlighted by previous price reactions and strong selling interest. This area has previously acted as a key supply zone, increasing the likelihood of a bearish reversal if sellers step in.
The current market structure suggests that if the price confirms resistance within this zone, we could see a pullback toward the 4.7100 level, a logical target based on previous price behavior and current market structure. However, a clear breakout above this resistance could challenge the bearish outlook and open the door for further upside. It's a pivotal area where price action will likely provide clearer clues on the next direction.
Just my take on support and resistance zones—not financial advice. Always confirm your setups and trade with solid risk management.
Best of luck!
Copper The Week Ahead 17th Feb 25The COPPER price action sentiment appears bullish, supported by the longer-term prevailing uptrend. The recent intraday price action appears to be a corrective pullback. towards the previous consolidation price range and also the rising support trendline zone. .
The key trading level is at the 9260 level, the previous consolidation price range and also the rising support trendline zone. A corrective pullback from the current levels and a bullish bounce back from the 9260 level could target the upside resistance at 9445 (200-day moving average) followed by the 9650 and 9950 levels over the longer timeframe.
Alternatively, a confirmed loss of the 9260support and a daily close below that level would negate the bullish outlook opening the way for a further retracement and a retest of 9130 (50 Day Moving Average) support level followed by 9060.
This communication is for informational purposes only and should not be viewed as any form of recommendation as to a particular course of action or as investment advice. It is not intended as an offer or solicitation for the purchase or sale of any financial instrument or as an official confirmation of any transaction. Opinions, estimates and assumptions expressed herein are made as of the date of this communication and are subject to change without notice. This communication has been prepared based upon information, including market prices, data and other information, believed to be reliable; however, Trade Nation does not warrant its completeness or accuracy. All market prices and market data contained in or attached to this communication are indicative and subject to change without notice.

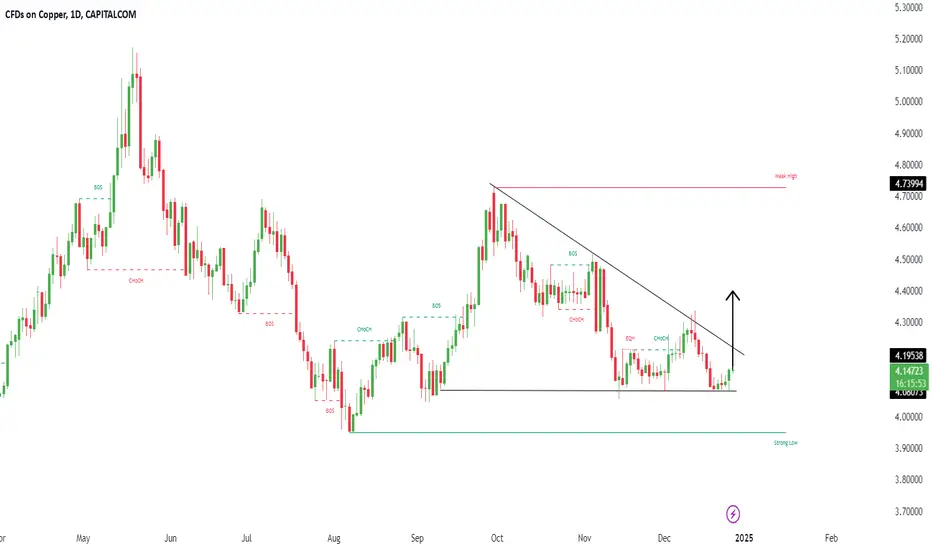
CopperXCUUSD ( Copper / U.S Dollar )
Change of Characteristics
Support Level
Descending Triangle as an Corrective Pattern in Short Time Frame
Break of Structure
RSI - Divergence
XCU/USD "COPPER" Market Money Heist Plan on Bullish SideHallo! My Dear Robbers / Money Makers & Losers, 🤑 💰
This is our master plan to Heist XCU/USD "COPPER" Market Market based on Thief Trading style Technical Analysis.. kindly please follow the plan I have mentioned in the chart focus on Long entry. Our target is Red Zone that is High risk Dangerous level, market is overbought / Consolidation / Trend Reversal / Trap at the level Bearish Robbers / Traders gain the strength. Be safe and be careful and Be rich.
Entry 📈 : Can be taken Anywhere, What I suggest you to Place Buy Limit Orders in 15mins Timeframe Recent / Nearest Low Point take entry in pullback.
Stop Loss 🛑 : Recent Swing Low using 1H timeframe
Attention for Scalpers : Focus to scalp only on Long side, If you've got a lot of money you can get out right away otherwise you can join with a swing trade robbers and continue the heist plan, Use Trailing SL to protect our money 💰.
Warning : Fundamental Analysis news 📰 🗞️ comes against our robbery plan. our plan will be ruined smash the Stop Loss 🚫🚏. Don't Enter the market at the news update.
Loot and escape on the target 🎯 Swing Traders Plz Book the partial sum of money and wait for next breakout of dynamic level / Order block, Once it is cleared we can continue our heist plan to next new target.
💖Support our Robbery plan we can easily make money & take money 💰💵 Follow, Like & Share with your friends and Lovers. Make our Robbery Team Very Strong Join Ur hands with US. Loot Everything in this market everyday make money easily with Thief Trading Style.
Stay tuned with me and see you again with another Heist Plan..... 🫂

The chart appears to analyze copper CFDs on a daily timeframeThe copper market is showing bearish tendencies, with price breaking below a critical symmetrical triangle pattern. Here are the key insights:
1.Technical Breakdown:
Price recently broke the lower boundary of the triangle, signaling a potential continuation of the downtrend.
Strong selling pressure is reflected by increased volume.
2.Support Levels to Watch:
Immediate support: $4.00 (psychological level near the 50% Fibonacci level).
Key support: $3.85 (61.8% Fibonacci retracement and ascending trendline).
3.RSI and Momentum:
RSI still hovers above oversold levels, leaving room for further downside.
Moving averages suggest sustained bearish momentum.
4.Risk and Opportunity:
Traders should watch for a retest of the triangle's lower boundary (~$4.20) as potential resistance before further declines.
Break below $4.00 could open doors for $3.85.
📊 What are your thoughts on copper's next move? Let me know in the comments!

Copper Breakout: Bullish Trend After 0.6Fib RetracementI’ve initiated a long position in Copper after a successful retracement to the 0.6 Fibonacci level, which triggered my entry. The bullish trend looks solid, and I am targeting the 0.7 Fibonacci level for my take-profit (TP), aligning perfectly with my point of interest around the 4.800 level. As of now, Copper is facing resistance in the 4.300–4.400 price zone, but a breakout here will prompt me to adjust the stop-loss (SL) and take partial profits. Until the breakout occurs, the trade criteria remain as shown in the chart.
Technical Analysis:
• Entry: Near the 0.6 Fibonacci retracement level.
• Target (TP): 4.800 (aligned with the 0.7 Fibonacci level).
• Stop-Loss (SL): To be adjusted after a clean breakout above 4.400.
• Market Structure: The price has respected the Fibonacci retracement levels and is set for a potential breakout to the upside. The bullish trend remains intact, supported by clean retracement patterns.
Fundamental Outlook:
Copper prices have been fluctuating due to external factors, including China’s economic measures, which have helped support the market. However, half of those gains have retraced as market participants begin to question the scale of the stimulus. Despite this, the long-term view for Copper remains bullish, especially with solid demand linked to the energy transition and rising input costs.
Additionally, factors like U.S. rate cuts and China’s fiscal policies will play a key role in driving future demand. The current short-term outlook remains dependent on stimulus from China, as well as the timing and impact of U.S. rate cuts. Should demand recover, Copper could potentially rally towards the 4.800 level as targeted.
Risk Management:
• The SL will remain flexible, adjusted accordingly based on the price action and breakout strength.
• Partial profits will be taken in the 4.400 range, with the remainder held for the final target at 4.800.
• The position is managed carefully to avoid exposure to market volatility in the lower ranges.
Always remember to Pay Yourself by taking partial profits when the trade moves in your favor!
Note: Please remember to adjust this trade idea according to your individual trading conditions, including position size, broker-specific price variations, and any relevant external factors. Every trader’s situation is unique, so it’s crucial to tailor your approach to your own risk tolerance and market environment.

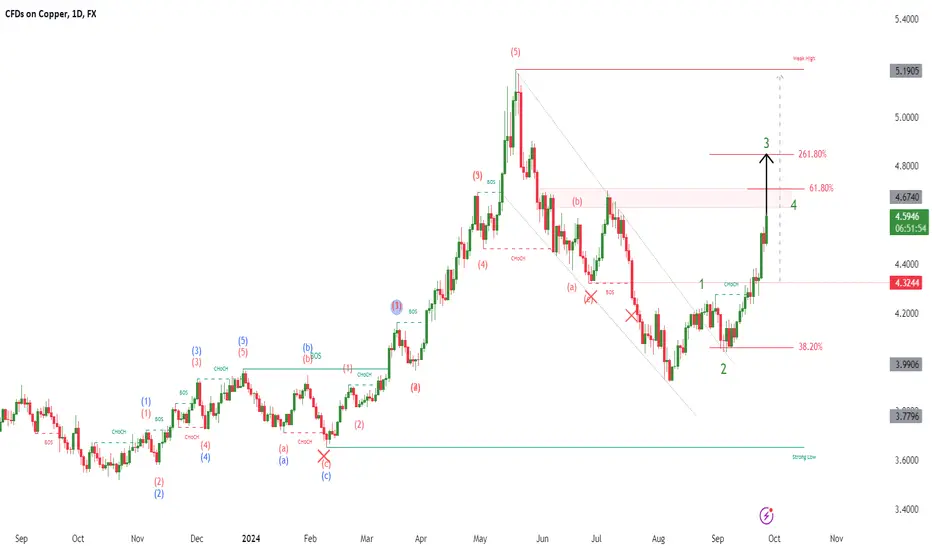
Copper 10-10Pair : XCUUSD ( Copper / U.S Dollar )
Description :
Resistance Level
Completed " 12345 " Impulsive Waves
Break of Structure
RSI - Divergence
Bearish Channel as an Corrective Pattern in Short Time Frame

Copper CUPair : Copper CU
Description :
Completed " 1234 " Impulsive Waves
Break of Structure
RSI - Divergence
Falling Wedge as an Corrective Pattern in Short Time Frame
Demand Zone
XCUUSDPair : XCUUSD ( Copper / U.S Dollar )
Description :
Completed " 12345 " Impulsive Waves and " ABC " Corrective Waves
Break of Structure
Fibonacci Level - 78.60%
Symmetrical Triangle as an Corrective Pattern in Short Time Frame
Demand Zone

CopperPair : Copper - CU
Description :
Completed " 12345 " Impulsive Waves and " AB " Corrective Waves
Break of Structure
RSI - Divergence
Rising Wedge as an Corrective Pattern in Short Time Frame
Demand Zone

COPPER CUPair : CU - Copper
Description :
Impulse Correction
Falling Wedge as an Corrective Pattern in Short Time Frame
Break of Structure and Retracement
RSI - Divergence
Support Level

XCUUSDPair : XCUUSD ( Copper / U.S Dollar )
Description :
Completed " 123 " Impulsive Waves
Consolidation Phase in Short Time Frame
Fibonacci Level - 38.20%
Demand Zone
Daily Support Level

Copper (HG) - Look for Longs?While the decline in copper persists, @HG is nearing areas of previous demand on intermediate-term timeframes. Specficially, we will be watching the industrial metal's action between the prices of 4.1130-4.0605 (with hypothetical stop lower @ 4.0250). Given the current momentum and potential add'l downside per larger timeframes, we recommend watching for micro-TF trend violation/reversal confirm signals before establishing positions. This idea is bolstered by a backdrop more broadly of metals having pulled back and a AMEX:USD that looks vulnerable vs. physical assets over the longer-term. Of course "Dr. Copper" is more closely linked to the global economy vs. GC (which we like better), but price, ultimately, remains undefeated + copper will become a value buy at some point...
Godspeed,
JHart

COPPER Pair : Copper - CU
Description :
Demand Zone
Completed " 12345 " Impulsive Waves and " A - B ( Irregular ) Corrective Waves
Break of Structure
RSI - Divergence
Fibonacci Level - 127%

Copper Pair : CU - Copper
Description :
Completed " 12345 " Impulsive Waves and " A " Corrective Waves
Break of Structure
Fibonacci Level - 38.20%
RSI - Divergence
CHoCH
Bullish Channel as an corrective Pattern in Short Time Fame

Copper Short Term Buy IdeaH1 - Bullish trend pattern
Higher Highs
Currently it looks like a pullback is happening
Until the strong support zone holds my short term view remains bullish here.

CU COPPERPair : Copper CU
Description :
Bearish Channel as an Corrective Pattern in Long Time Frame
Break of Structure
Demand Zone
RSI - Divergence
CHoCH
Falling Wedge in Short Time Frame

CopperPair : CU - Copper
Description :
Completed " 12345 " Impulsive Waves
Falling Wedge as an Corrective Pattern in Short Time Frame
Break of Structure
RSI - Divergence
Demand Zone

COPPERPair : CU - Copper
Description :
Bearish Channel as an Corrective Pattern in Long Time Frame
RSI - Divergence
Break of Structure
Completed " 12345 " Impulsive Waves
Consolidation Phase in Short Time Frame

COPPERPair : CU - COPPER
Description :
Falling Wedge as an corrective Pattern in Short Time Frame
RSI - Divergence
Break of Structure
Demand Zone
Completed " 12345 " Impulsive Waves

CopperPair : CU - Copper
Description :
Completed " 12345 " Impulsive Waves
Break of Structure and Retracement
RSI - Divergence
Consolidation Phase in Short Time Frame
Resistance Level
