Copper Buy / Sell Based on FIBO / Gann - INTRADAYAs per my analysis Copper is on Buy Trend So buy at 503.50 Stop loss at 502.20 and expected targets 505.70 / 509
Gann And Fibonacci Always rocks Follow us and support us and help us to grow
Copperfutures

Copper Buy / Sell Based on FIBO / Gann - INTRADAYAs per my analysis Copper is on Range bound So sell near 507.10 Stop loss level at 508.40 Target Expected 503.20 / 501
or Buy at 501.10 Stop loss at 499.80 and expected targets 505.30 / 507.10
NOTE : WHICH EVER ENTRY TRIGGERS FIRST BE ON THAT SIDE AND LEAVE THE OTHER VIEW
Gann And Fibonacci Always rocks Follow us and support us and help us to grow

Copper Buy / Sell Based on FIBO / Gann - INTRADAYAs per my analysis Copper is on Buy Trend correction So sell near 507 Stop loss level at 508.40 Target Expected 503.20
after correction buy at 503.20 Stop loss at 502.10 and expected targets 507.30 / 510.10
NOTE BUY IS THE MOST PREFERRED TREND/TRADE
Gann And Fibonacci Always rocks Follow us and support us and help us to grow

Copper Buy / Sell Based on FIBO / Gann - INTRADAYAs per my analysis Copper is on Buy Trend So buy near 509.30 Stop loss at 508.20 and expected targets 513.10 / 517.60
Expecting time to trigger our buy entry is 4 PM . If today"s high is safe before our entry .
Gann And Fibonacci Always rocks Follow us and support us and help us to grow

Copper Buy / Sell Based on FIBO / Gann - INTRADAYAs per my analysis Copper is on Buy Trend So buy at 503.90 Stop loss at 502.80 and expected targets 507 / 509.70
Gann And Fibonacci Always rocks Follow us and support us and help us to grow

Copper Buy / Sell Based on FIBO / Gann - INTRADAYAs per my analysis Copper is on Buy Trend correction So wait and sell at 499.20 Stop loss level at 500.30 Target Expected 497 / 495.80
after correction buy at 495.80 Stop loss at 494.40 and expected targets 501.80
Gann And Fibonacci Always rocks Follow us and support us and help us to grow

ridethepig | Copper Quarterly Update (via Supply Side Shortages)📍 Changing Directions...
Let us first look at the previous charts for the flows we were tracking in the typical Copper flows inside a crisis:
a) Confirming the correction, which is set from an abc retrace
b) Momentum is in play here
In the lows at 2.1 - 2.3 the clear move was loading on the lows. This was followed by an immediate slingshot out as smart money outguessed the shortages coming on the supply side. First to go as confirmed at the weekend, Chile, Covid has hit mines hard and most are back to 60% capacity AT BEST!! Chile is now a virus hot spot... it is sadly only going to end in one way.
The slingshot carried out here is going to be effective at taking out the highs - a commodity shortage is a prelude to the monetary crisis which is cooked for year-end. Those V shapers have clearly not checked the most important chart that ironically begins with a V... VIX above 30 does not imply everything is fine...
Thanks as usual for all those keeping the feedback coming in the comments... 👍 or 👎


Gap breakoutThis thing is likely shoot good. Good breakout with gap. Bullish rejection from monthly pivot.
When price breaks away the trend line with gap it rarely makes a trendline retest.
Does this mean that oil might rise? Copper and oil have had a strong positive correlation at 0.84.
THIS IS NO FINANCIAL ADVISE.


Copper Futures (HG1!) DailyDates in the future with the greatest probability for a price high or price low

Copper Futures (HG1!) WeeklyDates in the future with the greatest probability for a rice high or price low

Copper Futures (HG1!) MonthlyDates in the future with the greatest probability for a rice high or price low

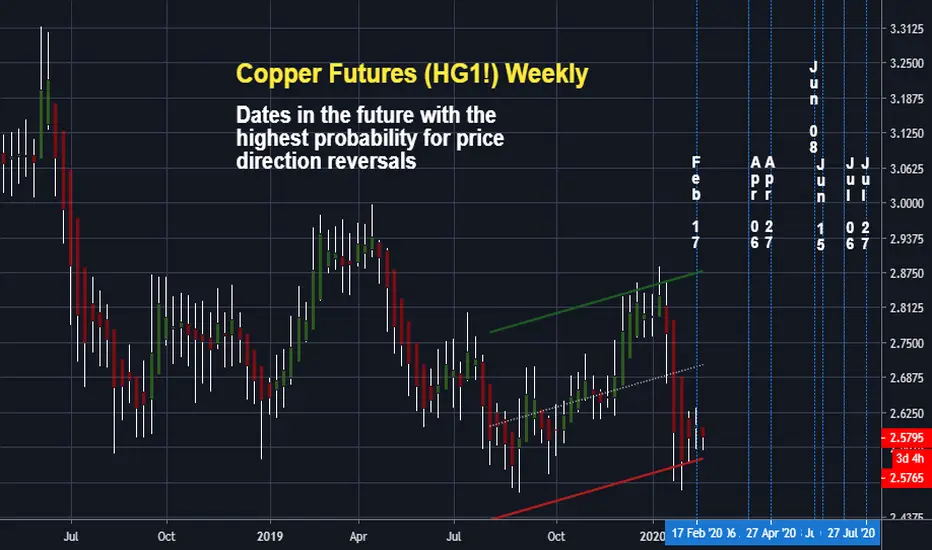
Copper Futures (HG1!) WeeklyDates in the future with the highest probability for price direction reversals
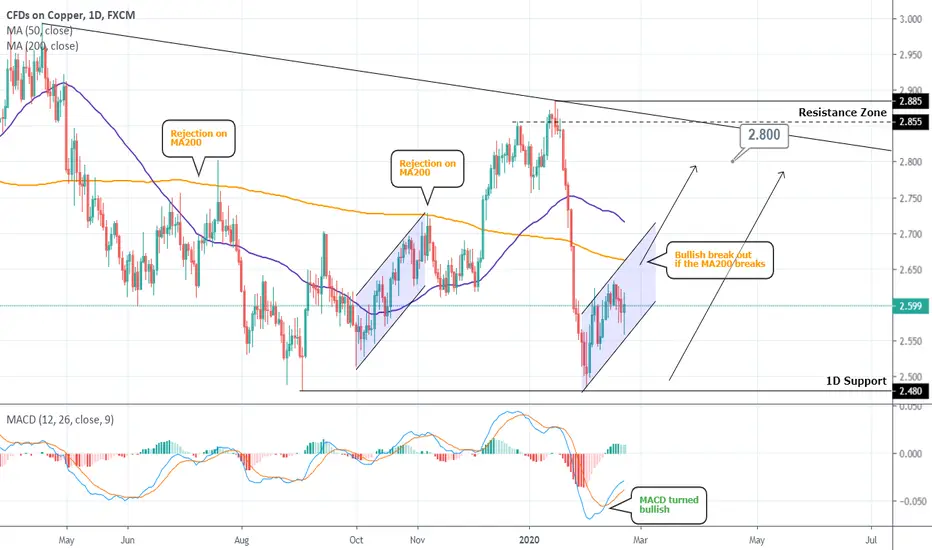
COPPER Buy SignalPattern: Channel Up on 1D.
Signal: Bullish if the price breaks the 1D MA200 or if it tests 2.500 again.
Target: 2.800 (right below the Resistance Zone).
Recent successful signal on Copper:
Copper: First Corrective Wave TargetIn "Copper Tempest" (see related ideas), I analyzed the macro-view on Copper. Now it's time to act.
My trade starts from 2.8462 with final target of 2.8125 (end of first corrective wave). Stop Loss set at 2.8537.
Disclosure: My ideas contain statements and projections based on assumptions on capital markets, and therefore inherently subject to numerous risks and uncertainties.
Before buying or selling any stock you should do your own research and reach your own conclusion or consult a financial advisor. Investing includes risks, including loss of principal.
I am not a financial advisor.

Copper Tempest: The Bear before the BullIf you like this idea, don't forget to hit the Like Button and to Follow Me!
Exciting days for Copper. The brown metal reached the $2.8575 level. I'm confident that copper price will rise in the long run if copper demand, especially for China (largest copper consumer), will continue to record highs (527,000 tons in December 2019).
However, we still live on planet earth, and we need to make a deal with technical analysis. I believe Copper has terminated an Elliot wave impulse, with wave 5 hitting today's high ($2.8575). I will expect in the next days the A, B, and C corrective waves.
This theory is enforced by Volume Profile analysis (performed on Elliot Impulse Range) that shows POC support at $2.6436, and an exciting volume development around $2.7947. I expect corrective wave C to touch this support to bounce back for a new impulse wave 1 (If the market will let it).
Stochastic still confirm this analysis. The indicator showed no reversal for this cycle, and it is approximating the overbought area, by the way, again with a bullish setting.
Disclosure: My ideas contain statements and projections based on assumptions on capital markets, and therefore inherently subject to numerous risks and uncertainties.
Before buying or selling any stock you should do your own research and reach your own conclusion or consult a financial advisor. Investing includes risks, including loss of principal.
I am not a financial advisor.


Copper (HG1) BuyJust my opinion on what market might currently be doing. Enter and exit at your own risk.
DISCLAIMER
Please note that this chart is an opinion based chart only. Please trade at your own risk

Copper Buy & SellCopper is currently a sell but not long before buyers come back in. My labelled zones are only a rough idea of where i think the market may touch before turning around. Decide on your own Entry & Exit. If you do decide to enter a sell from this point, then i would put a SL around 10pips about zone A because market can always go back up to A again before coming back down to B.
DISCLAIMER
Please note that this chart is an opinion based chart only. Please trade at your own risk
