Copperlong

Inverted Ascending Scallop ComparisonComparison of TOTAL2 and Copper
Similarities can be seen in the formation of a scallop
This may lead to a bullish C wave breakout on copper
I identify this structure as 'weak' due to its lacking of a strong double bottom and slight downward slope, however it is a good chart pattern for accumulation.


Copper Futures (HG1!) MonthlyDates in the future with the greatest probability for a rice high or price low

Short copper ETF about to breakout?Is this ETF about to break out? Needs to break 35 before it makes real gains.


Copper Breaks DowntrendCopper seemingly has broken its downtrend, with the presence of a strong linear regression uptrend on the daily chart (0.86) this upward movement will likely continue.

ridethepig | Copper Driving China Capital Flows As you can see the strong relationship Copper has with Chinese equities, you will notice what has been the case for these final stages of the economic cycle, metals have been moving miles ahead of equities.
We got the floor set in Copper as widely expected all year:
Any dips now look competitive:
Copper has been allowed to outperform Gold:
Bulls need to reclaim the highs in Chinese Equities after the -10% leg:
A weaker USD will help reinstate a bullish outlook for Copper, support clearly seen at $2.715, then $2.675 - which I expect to hold.
Thanks for keeping the support coming with likes and as usual jump into the comments with your charts and views to open the conversation up for all!

Copper: TARGET 3.00 on positive tariff Deadline newsDonald Trump set December 15 (this Sunday) as the date to impose more tariffs on China. If this date gets pushed back - or a phase one trade deal is achieved - Copper could move up to 3.0 on the prospects of more demand from China

Copper long Trend ContinuationTrend continuation on copper 1Hr timeframe. Bouncing of 150 and 200 EMA. Risk reward ratio 1: 2. Can possibly go uptop Fib Extension 100%.


"COPPER (XCUUSD): ready to go up" by ThinkingAntsOkDaily Chart Explanation:
- Price is against a Weekly Support Zone.
- Price is under a Descending Trendline.
- Bullish Divergence on MACD.
- If price breaks the Descending Trendline at 2.68, potential to move up towards the Resistance Zone at 2.96 and, then, to the Weekly Resistance Zone at 3.2.
Our Weekly Vision supports this potential long idea. Take a look!
Weekly Vision:
Updates coming soon!


"Top and Bottom Analysis" Copper (XCUUSD) by ThinkingAntsOk4H Vision Explanation:
- Price broke the Descending Trendline and started an up move.
- It has potential to go up towards the Major Resistance Zone at 2,96767, being careful with the Middle Support Zones.
- However, the Bearish Divergence on MACD could be anticipating a Pullback to the broken Resistance Zone that is now a Support Zone.
We are also long in our Weekly and Daily Vision.
Weekly Vision:
Daily Vision:

Copper XCUUSD Bullish 8H LongBuyLongSellIndicator UpdateCopper has bottomed and moved up from the long resistance level.
As per the LongBuyLongSellIndicator(Script Below) the Candle Become Black to Blue which is good sign for uptrend.
Good Upmove is possible from here.

Copper Bullish setupcopper making seasonal bottom, professionals open long & short positions, while bank profiting taking by closing both sides. price may go further dip to catch stop losses.


Copper (HG1) BuyJust my opinion on what market might currently be doing. Enter and exit at your own risk.
DISCLAIMER
Please note that this chart is an opinion based chart only. Please trade at your own risk

Copper Buy & SellCopper is currently a sell but not long before buyers come back in. My labelled zones are only a rough idea of where i think the market may touch before turning around. Decide on your own Entry & Exit. If you do decide to enter a sell from this point, then i would put a SL around 10pips about zone A because market can always go back up to A again before coming back down to B.
DISCLAIMER
Please note that this chart is an opinion based chart only. Please trade at your own risk

Copper Sell & BuyI think any pull back in copper is a sell until we reach target D and then buyers can come in and take in up. Could go further than my TP but those are my targets for now.
DISCLAIMER
Please note that this chart is an opinion based chart only. Please trade at your own risk

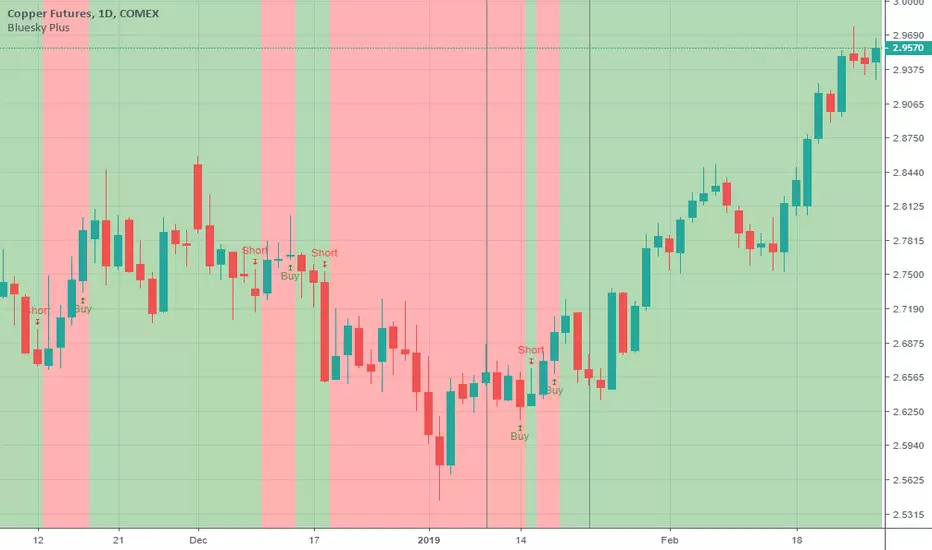
CopperCopper Trades using Blue Sky Plus Indicator. Message or Comment to get a free trial of the indicator.https://www.tradingview.com/script/lqS4a5pU-Blue-Sky-Plus-Day-Positional-No-Repaint-with-Alerts/
Copper in RiseIt is not new that this year 2019 with the rumors and the suspension of tariffs added to it the good perspectives on a possible agreement between China and the United States. pushed the red metal ( copper ) ,but approaching a great ressitencia, follow the good forecasts is not unreasonable the price continues to climb positions, but all this will be seen soon.
