AUDJPY long swing tradegood low risk high reward trade setup IF all play out
buy aud jpy 82.088
stop loss 80.339
take profit 1 84.242
take profit 2 86.096
Copytrading

gbpjpy sell trade swing trade hey traders, the price formed a double top on the weekly chart after reaching a major resistance zone.
Entry 156.350
stop loss 157.860
take profit 149.764
please use proper risk management, like and follow! Goodluck!

Important Copy Trading Metrics to AnalyzeHello Traders and Investors,
Today I want to talk about some of the important metrics pertaining to a live trading statement that you should assess before considering which traders to copy. For those of you that are not familiar with copy trading, it's the most revolutionized way for investors and traders to safely invest with professional traders in 2022.
== COPY TRADING SERVICE PROVIDERS ==
LEFTURN Inc.
eToro
collective2
ZuluTrade
FXTM
== WHY COPY TRADING EXISTS ? ==
Unfortunately in the past there's been lots of scams in this industry with fake traders or money managers where investors would give a professional actual cash. The fake trader would deposit the investor's funds in their own personal account, for the investor to then later discover the whole investment was a scam. Luckily however, copy trading was born to help eliminate the possibility of being scammed by fake traders or investment advisors.
---
Let's now review some important metrics pertaining to trading statements. For those of you that are not familiar with myfxbook or FXBlue , these are 2 great third party resources available for traders to showcase their past performance by connecting their MT4 or MT5 account to either myfxbook or FXBlue's API.
== IMPORTANT METRICS TO REVIEW ==
1. First and foremost, is the account verified via a third party vendor?
The first early sign of a fake trader is if their willing to showcase their past results of their live verified trading statement. Be cautious about anyone showcasing their results via screenshots or Photoshop files. Always ask for statements from either FXBlue or myfxbook.
2. Does the trader use his/her real name or an alias name?
We all know that our reputation is our most valuable asset. An early sign of a fake trader might be someone that goes by an alias name.
3. Is the account in which you intend to copy either a demo or live account?
This is very important since most traders can perform well on demo accounts, but can't perform the same on live accounts. When trading live accounts, it has a completely different psychological impact on the trader's mindset since he or she is now trading with live capital.
4. How much equity does the trader have in his/her master account?
Traders that trade with larger accounts tend to have more confidence in their own abilities to perform. Be cautious about traders that are constantly withdrawing large amounts or have little equity in their account.
5. How old is the trading history?
Some traders can perform well for several months especially if their using an EA or some sort of algorithm. Unfortunately for many traders that use fully automated systems, majority of them tend to have a doomsday effect every 6 months to a year. This is why it's important to request at least a year long statement
6. Understanding the trader's strategy
By understanding how the trader enters and exits positions, this will allow you to determine if their strategy works with your risk tolerance and level of comfort.
7. How easily can you contact the trader when you have concerns about the account?
We can't expect the markets to always perform perfectly according to the strategy. Maybe another major crisis is right around the corner that neither you (the investor) or the trader isn't expecting. What's the plan for when the markets are not trending according to plan? How does the trader manage risk in times of uncertainty? Traders that you can easily contact at anytime will give you great ease and peace of mind knowing they are working on adapting to the ever changing market conditions.
8. What is the maximum drawdown?
Knowing the maximum drawdown the trader has had in the past will inform you about how much risk the trader is willing to take on your account. However this metric should be discussed with your trader as they might not take on much risk at first to protect the investor's principal but then increase the risk once the account has significantly grown. Some traders will not risk any of the principal investment but are willing to risk some of the earnings already generated.
9. What are their average monthly returns?
This metric should be proportionate to the maximum monthly drawdown but should also be discussed with your trader to fit your level of risk tolerance
10. How do they manage risk in times of uncertainty?
Does your potential trader use stop losses, do they hedge positions, or close all trades heading into major risk events? Understanding how they manage all risk factors is critical for the life span of the account in which they will trade.
11. What are their fees?
Do they charge a monthly management fee along with a performance fee? Or do they just charge a performance fee? Trader's that only charge a monthly performance fee have greater confidence in their own strategy since they only get paid if the investor makes money first.
12. Which broker are they using?
Some traders want you to register with their broker so they can generate additional revenue through what's referred to as an IB program. Others allow you to use any forex broker and are more interested in generating returns for their investors and not so focused on IB commissions. Trader's that have IB accounts get paid based on the volume traded. Be cautious about traders that want you to register under their IB program with their broker.
13. How often can you request withdrawals?
If you're able to withdrawal funds as often as you like, that's a bonus and again shows greater confidence.

gold buy tradegold is currently trading above the 200 ma and also we have a cross of the 2 moving averages above the 200 ma which indicates a buying momentum and we may see price make a push from here higer.
entry 1814.03
stop loss 1798.40
take profit 1831.23
risk what YOU CAN AFFORD to lose or 1%

audnzd daily update sell trade.Hey Price is currently at the weekly resistance level and was rejected by the formation of the inside bar candlestick pattern signaling bulls are losing momentum.
Entry 1.06028
Stoploss 1.06554
Take profit 1.03364
Use proper risk management and goodluck.

BITCOIN about to make that push!wassup my peeps, yes u read right, bitcoin to the moon they say well that may just be the case here. BTC is currently rebounding off the weekly support, also on the daily chart above we can also see price is holding above the 200 moving average and also we saw a pinbar candle close to a major support level. With these confluences and price action signals i will open a long position on BTC.
entry 51022.5
stop loss 45606.4
take profit 65352.6

gbpjpy sell trade swing trade hello trader. Today we have a sell setup on the gbpjpy. Price recently broke out from a strong weekly descending trendline an formed an uptrend, the price is now currently at a major weekly resistance and price has now formed a harami pattern. we expect to see a drop in price.
Entry 153.225
Stop loss 154.176
Take profit 149.525
This is a very volatile pair that moves, so use good risk management. goodluck!


Nzdchf short setup entry 0.62268
stop loss 0.62455
tp 0.61860
Use proper risk management!!! Like, Follow and Support!!

Buy Eurusd price broke out of a descending channel and also a bullish flag signaling bullish momentum is growing.
entry 1.13162
stop loss 1.12958
take profit 1.13526
like and follow in support. thanks.

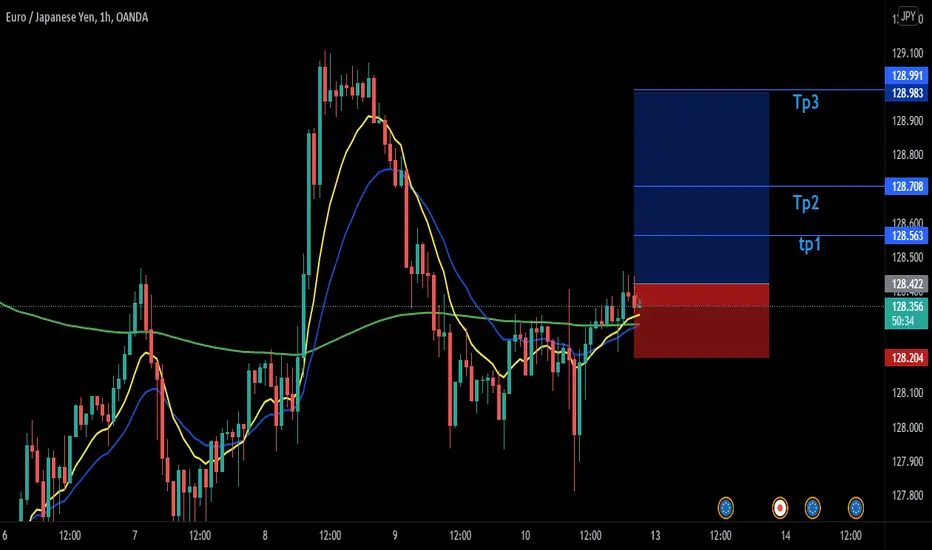
EurJpy buy set upEntry 128.357
Stop loss 128.204
Take profit1 128.563
Take Profit 2 128.708
Take profit 3 128.983
Use proper risk management!
Long🟢 Falling Channel, Descending Wedge, Zone Support, New ATH Deep AI detected Falling Channel.
Falling Channel is a bullish pattern.
Our Neuro-Fuzzy Botnet thinks breakout.
Also, Machine Learning detected Descending Wedge.
Descending Wedge is a bullish pattern.
Again:
Our Neuro-Fuzzy Botnet thinks breakout.
Linear Regression computed:
1st Target is the bottom white box.
In an optimistic scenario, Top white box is possible.
Fuzzy algorithms show a hidden uptrend.
- Whale Monitor detected zone support.
See cyan area!
RSI found support.
🚀 We think you can send Bitcoin .

WBA ready for take off ? 🚀Just a stock that could give a good profit if it continues this trend
but because its not all positive, then remember your stop loss
its all on the chart
Remember to do your own analysis

Long🟢Symmetric Triangle-Breakout, Descending Channel (Bullish)Neuro-Fuzzy AI identified positive breakout on Symmetric Triangle.
Symmetric Triangle is a neutral pattern.
Positive breakout signals bullish option until Triangle top.
The triangle top would be ATH, in this case.
Deep Learning Pattern Matching drew a descending channel around the current price.
Descending channel is a bullish pattern.
Potential positive breakout until the top of the channel.
#1 TP: Channel Top, $64k.
#2 TP: Triangle Top, ATH.
God's luck copy trading!

EUR/USD: DOWNTREND SCENARIO | PRICE ACTION LOW TIMEFRAME | SHORTWelcome back Traders, Investors, and Community!
Check the Links on BIO and If you LIKE this analysis, Please support our Idea by hitting the LIKE 👍 button
Traders, if you like this idea or have your own opinion about it, please write your own in the comment box . We will be glad for this.
Feel free to request any pair/instrument analysis or ask any questions in the comment section below.
Have a Good Day Trading !

AUDIOusdt on BinanceENGLISH
ENGLISH Audiousdt this is how a shitcoin doesn't look like?
Very sturdy and cleani price action to see here. clearly uptrending action seen here, and a perfect retest of the previous (first) ATH.
After the break of the first ATH we see a solid pump, followed with a pullback to the tick just from the first high.
Paternwise is forming a cup and handle (which is a bottom reversal pattern, and a handle that we are now working on, moreover fractal wise and in that handle we now form an inversed head and shoulder (also a reversal pattern).
To project our next run up, we take the measerment targets from the handle as the cup + a confluence with the FIB extension tool.
How we determine our entery stoploss and between TPs can be seen in this clear explanation video. Good luck with it and as always, this is not Financial advice, always do your own research and think / decide for yourself. Need help, you can reach us via tradingview/telegram or our webstite.
E: 2.455
S: 2.071
TP: 2.951 - 3.434 - 4.160 - 4.984 - 7.415
Trade safe and until the next, cheers!
Audiousdt
dit is hoe een shitcoin er niet uit ziet?
Zeer stevige en mooie prijsactie te zien hier. duidelijk uptrending actie te zien hier, en een perfect retest van de vorige (eerste) ATH.
na de breek van de eerst ATH zien we een stevig pump, gevolg met een pullback tot op de tick juist van de eerste high. Paternwise is zich een cup and handle aan het vormen (wat een bodem reversal patroon is, en een handle waar we nu aan het werken zijn, bovendien fractal wise en in die handle vormen we nu een inversed head and shoulder (oook een reversal patroon).
We nemen om onze volgende run up te projecteren de measerment targets van bij de handle als de cup + een confluence met de FIB extension tool.
Hoe we onze entery bepalen stoploss en tussen tp's kun je zien in deze duidelijke uiteenzettings video.
Veel succes ermee en zoals steeds, dit is geen Financieel advies, doe steeds je eigen onderzoek en denk/beslis voor jezelf.
Hulp nodig, je kunt ons via tradingview / telegram of onze webstite bereiken.
E: 2.455
S: 2.071
TP: 2.951 - 3.434 - 4.160 - 4.984 - 7.415
Trade safe en tot de volgende, cheers!

ADA close to its MA 50 support 💥📊Ada is fighting the support line as we speak - lets see where it wanna go to next.
I hold Cardano for "long term" so i dont care what happens in an day an week or 30 days.
This is just to keep track of my investment - remember to do your own analysis !
Marttin

WAIT for the breakout 📈Just to follow my investment and show you how i see the coin right now.
Remember always to do your own analysis since we all trade in deff ways .
This is just fro sharing
Marttin

BTC makes new bullish signs 💥Hi all
Remember we all trade deff, so its importent you make your own analysis so it suits your way.
This is just for sharing what i see on the daily chart as we speak.
Im not holding BTC but many other altcoins.
Hope you can use it
Marttin

GOLD :DOWNTREND | RETEST AND SHORT CONTINUATION...PRICE IS FALL⚡Updating previous Idea. Price have react at the Resistance 1800 / 1805.00 and now is falling down..
Welcome back Traders, Investors, and Community!
Check the Links on BIO and If you LIKE this analysis, Please support our Idea by hitting the LIKE 👍 button
Traders, if you like this idea or have your own opinion about it, please write your own in the comment box . We will be glad for this.
Feel free to request any pair/instrument analysis or ask any questions in the comment section below.
Have a Good Day Trading

FIOusdt on BinanceFIOusdt on Binance
ENGLISH
What do we all see?
The market structure tells us that we are still in an uptrend on macro vieuw, maw if we look at all the candles together it gives us the weather of an uptrending asset.
As a result, we automatically look for a long entery.
Short overview of our drawing tool layers:
VPVR indicates to us that we are on support
Momentum represents a ranging phase, (in favor of a long), ranging has a chance of a pullback (buy moment).
OBs put us that e are closer to support
Trading ranges, there we see an lvl that we are now trading for, close below it is high chance to pullback, close above it is high chance of further uptrending
As always, we are going to determine the most ideal entery - stop and branch proftits via our own layer system. given that the current market phase altcoin remains bullish tinged, we are also going to hunt for extend targets via the Fib; extention. Our extra layer of BIASlines (under construction) will allow us in the future to skip the fib, extension and prices to projects higher than the current trading area. as always, these will have the accuratity that we have gained from the MYpileus drawing tools.
Well now the game plan:
through the confluence strategy we arrive at the next lvl's - zones.
*attention, this is an obvious swing trade, respond appropriately with positionsizing!
Entery: Market - 0.0.2022 - 0.1834 - 0.1574
Stoploss : 0.1478
Take profit: 0.3268 - 0.4088 - 0.4744 - 0.5659 - 0.8145 - 1.2392
Wat zien we allemaal?
De market structure zegt ons dat we nog steeds in een uptrend zitten op macro view, maw als we alle candles samen bekijken geeft deze ons de weerspiegeling van een uptrending asset.
Hierdoor gaan we automatisch op zoek naar een long entery.
Korte overview van onze tekentool lagen:
VPVR geeft ons aan dat we op steun zitten
Momentum geeft een ranging fase weer, ( in het voordeel van een long), ranging heeft kans op een pullback (buy moment).
OBs zetten ons dat e dichter bij steun zitten
Trading ranges, daar zien we een lvl waar we nu voor aan het traden zijn, close eronder is high chance tot pullback, close erboven is high chance van verdere uptrending
We gaan zoals steeds via ons eigen lagen systeem de meest ideale entery - stop en tak proftits bepalen. gezien de huidige market fase altcoin blijven bullish getin, gaan we ook voor extend targets jagen via de Fib; extention. Ons extra laag BIASlines (under construction) zullen ons in de toekomst in staat stellen om de fib,extension over te slaan en prijzen te projecten hoger dan het huidige trading gebied. zoals steeds zullen deze de accuratheid hebben die we gewon zijn van de MYpileus tekentools.
Goed nu het gameplan:
via de confluence strategie komen we op volgende lvl's - zones uit.
*opgelet, dit i s een overduidelijk swing trade, reageer gepast met positionsizing!
Entery: Market - 0.0.2022 - 0.1834 - 0.1574
Stoploss : 0.1478
Take profit: 0.3268 - 0.4088 - 0.4744 - 0.5659 - 0.8145 - 1.2392

FLS back in the game ? 📈🤷♂️Just to share and to follow my own investment.
FLS is starting to look promising as there are more signs on the positive side then the negative and as i show on the map aswell
remember always to do your own analysis
Marttin
