"Short Setup on Corn (ZC1!)" by ThinkingAntsOk4 Hour Chart Explanation:
- Price bounced on the Resistance Zone (check it on the Weekly or Daily Vision).
- Price broke the Ascending Trendline.
- Price is, currently, on a Bearish Corrective Structure (ABC Elliot Count).
- If it breaks it at 4,215, the Short Move will be started.
- Our targets for that down move are the two Middle Support Zone and, finally, the Weekly Support Zone.
Check our Weekly and Daily Analysis. They can be really helpful for you!
Weekly Analysis:
Daily Analysis:
CORN

corn trading analysisthis is an idea based on fundamental and technical analysis, we are at a potential buy setup as the fundamentals(the report referred) suggest a minor supply and bad planting timing of the crop.
it has to be remarked to read the comment of the acreage report at the end of the document and understand how the crop grows.
if focused only on the first page of the acreage report (acreage of corn +3%) you can see that at the date the market receipted as a major supply(a sharp drop of price) but it did not account for the very late planting time and it can affect the developing of the crop.
all the important reports:
USDA acreage acrg0619 pdf (28/06/2019)
USDA crop progress prog2919 pdf (15/07/2019)
(search by your self)
the setup is a buy if do not drop significantly below the parallel channel and watch the further development of the crop to maximize the profits in the closing of the positions.
the latest report of the USDA indicate an improvement of the growing stage of the corn, but it is still significantly below compared year on year, also the crop quality has this deficit.


Nail reversals for high leverage tradesCOINBASE:BTCUSD
.. .. Tic by Tic Bitcoin Scalper
A groups of technical indicators to find entries & exits at exact reversal points..
The Mighty Doji along with decoding the visual data allows this...
( If only my TA & frame of mind could be up to the challenge! )
What else does one do after getting supremely REKT by the Corn
A pursuit of perfect scalps..
-new 2 charting and TA
Be kind and charitable with your feedback and reputation points.. :)
btc donate - Help a soul get back in the game
13zGwmtKRLxdSHDcVakWCMj6fbP1seFsF
//

Corn sell signalsCorn, weekly chart: 4 years long resistance zone + "Evening Star" candles pattern + Divergence on RSI(14) + "Shooting Star"/Pin bar candle pattern on monthly chart.


"Top and Bottom Analysis on Commodities: Corn" by ThinkingAntsOk4 Hour Chart Explanation:
- Price bounced on the Macro Resistance Zone and broke the Ascending Trendline.
- It is currently retesting the Resistance Zone (Pullback).
- If price starts its down path, we have two potential targets points: the Middle Support Zone at 3,782 and the Major Support Zone at 3,424.
Also, our Weekly and Daily Analysis are short views on the Corn.
Weekly Analysis:
Daily Analysis:

CORN LongCORN has broken out of a bullish descending wedge pattern to the upside, entered a bearish rising wedge, broken down and back-tested the previous resistance level before bouncing back. There are positive divergences on the charts which suggest a much longer up trend in play. These positive divergences can also be seen on the weekly and monthly charts of CORN which also firm up the thesis of a new long term uptrend. When measuring the height of the wedge pattern and adding it to the breakout point, the anticipated price coincides with a former support/resistance level.

CORN has reached exhaustion (for now)Yellow line is entry;
Stop loss is the red line;
Take profit are the green lines;

Corn Short OpportunityBias: Downwards
- Monthly pinbar
- Look for price to test the 200 day moving average (red)

Trade-war relief - July 2019Trump and Xi Ping have come to a tariff truce at G-20 this weekend.
Trump is now using Huawei (previously blacklisted, banned, etc.) as a bargaining chip, allowing TEMPORARILY, U.S. companies to continue doing business with China's Huawei.
Here is a list of Top 20 U.S. based Huawei suppliers . I believe most of them will rally this month (July 2019).
- Percentage number next to stock symbol is the revenue exposure to Huawei
Intel (INTC) - 1%
Advanced Micro Device (AMD) - 2%
Broadcom (AVGO) - 6%
Qualcomm (QCOM) - 5%
Microsoft (MSFT)
Nvidia (NVDA)
CommScope (COMM) - 2%
Texas Instruments (TXN)
Seagate Technology (STX) - 4%
Micron Technology (MU) - 2%
Qorvo (QRVO) - 11%
Flex (FLEX) - 5%
Skyworks (SWKS) - 6%
Corning (GLW) - 2%
Analog Devices (ADI) - 3%
NeoPhotonics (NPTN) - 47%
Western Digital (WDC)
Lumentum (LITE) - 11%
II-VI (IIVI) - 8%
Finisar (FNSR) - 8%
Maxim Integrated (MXIM) - 4%
Keysight Technology (KEYS) - 2%
Marvell Technology (MRVL) - 1%
Note: Trump can go back on the Huawei deal at any time.

CAN'T ADAM AND EVE IT...´´´´¶¶¶¶¶¶´´´´´´¶¶¶¶¶¶
´´¶¶¶¶¶¶¶¶¶¶´´¶¶¶¶¶¶¶¶¶¶
´¶¶¶¶¶¶¶¶¶¶¶¶¶¶¶¶´´´´¶¶¶¶
¶¶¶¶¶¶¶¶¶¶¶¶¶¶¶¶¶¶´´´´¶¶¶¶
¶¶¶¶¶¶¶¶¶¶¶¶¶¶¶¶¶¶¶´´¶¶¶¶¶
¶¶¶¶¶¶¶¶¶¶¶¶¶¶¶¶¶¶¶ ´¶¶¶¶¶´
´´¶¶¶¶¶¶¶¶¶¶¶¶¶¶¶¶¶¶¶¶¶
´´´´´¶¶¶¶¶¶¶¶¶¶¶¶¶¶¶¶
´´´´´´´¶¶¶¶¶¶¶¶¶¶¶¶¶
´´´´´´´´´¶¶¶¶¶¶¶¶
´´´´´´´´´´´¶¶¶¶

Corn short biasCorn just reacted to previous monthly supply and created short setup. We always need to enter when market gives us the way with small retracements. Trade always zone to zone.
Happy Trading.

Corn/USD Bearish Divergence- Corn have an exponential growth recent month. but i expect a consolidation after it hit the 2.618 fib line(golden ratio fib) area just like in 29 may 2019.
- Bearish Divergence sighted but it could be negated if the indicators could rise in a same level as a previous level high.
- expect a golden ratio fib, EMA and SMA as a potential support and resistance line.
peace.

Corn Weather Market Losing Steam?
In the ZCZ2019 chart, I see the potential for another leg up however I believe it could retreat down to test the current support line. On 4/30 I bought corn around $3.80 feeling the low had been put in, after a few discomforting days I was correct. Due to delayed plantings and not optimal weather looking forward the market exploded up. I exited this position around the $4.40 range and enjoyed the nice profit, skeptical the market could not bust through the $4.54 price level.
Now that the market has broken through that level of $4.54 I am not adding to a Spec long position, while there is certainly upside potential left, I feel the market will struggle in the coming days and weeks to continue the great run it has displayed over the past weeks. That does not mean I am ready to initiate a short position, I feel the upside potential of 8.5% to the upside is still greater than a potential selloff.
I will be keeping a close eye on the market in the coming days and weeks if we do continue to rise an additional 8.5% and reach $5.00 +/- I will be preparing to enter the market as a bear. I do not forsee a freefall taking place but do see the potential for significant price reductions if we reach these levels. For the time being, I remain patient, sitting on my hands.
**Educational purposes only**

ZC1! - What to expect on the 4hr - CORN FUTURESSo check my last chart to see where I told you what needed to happen to get here. Spoiler alert. I was spot on. Now we have a fresh high and fresh failed to gain. Not a bad place to get short with tight stop just above previous highs. BUT TO TRULY KNOW IF THIS IS THE TOP... you have to lose the high. Look for a close below the last leg that took you up and then get short on the pull back to test that previous local high. This could be the last pullback before the drop, if there are no closes above the top green line. But typically there is a significant pull back after it close below the last leg up and thats usually where I get in on trend reversal signals.

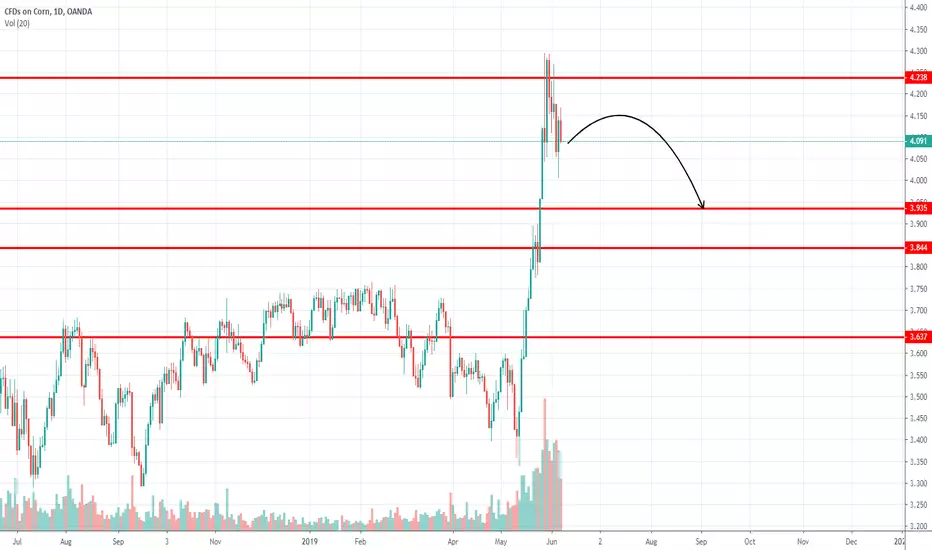
Bearish Structure on CORN 8 June 2019Market has failed to close above 29 MAY candle and is trading within this candle range for this past week. Bullish momentum is losing its steam as can be seen from the market structure and also the high volume candle. Waiting for confirmation to close below 29 May candle for trade entry. Watch 3.935 support very closely. I am expecting 3.935 to hold.
CORNusd CFd ; Long Term Perspective on the up Trend :Third EyeCORNusd CFd ; Long Term Perspective on the up Trend :Third Eye

Corn***Red bullIt has broken out the range, there's a potential IHS pattern.
Buy after pull back in lower fime frame

Not a farmer but corn could be ready to pick here. MMHVW - so apparently the adverse flooding and wet weather hitting certain parts of USA at the moment will have a negative impact on corn as the lands over waterlogged and therefore nothing is grow at the moment. Could see a break out from this descending wedge soon.
ETFS Corn is designed to enable investors to gain an exposure to a total return investment in corn by tracking the Bloomberg Corn Subindex (the "Index") and providing a collateral yield. The product reflects the performance of the Index such that, for example, if the Index were to rise in value by 5% over a period, the product would increase in value by 5% over that same period (before fees, expenses and adjustments) and if the Index were to fall in value by 5% over a period, the product would fall in value by 5% over that same period (before fees, expenses and adjustments). The product is an exchange traded product ("ETP"). Securities in this ETP are structured as debt securities and not as shares (equity). They are traded on exchange just like shares in a company. The ETP is backed by swaps with Citigroup Global Markets Limited and Merrill Lynch International. The payment obligations of the swap counterparties to the Issuer are protected by collateral held in a segregated account at an independent custodian, The Bank of New York Mellon.
Again - this should not be taken as financial advice.

It's bull alright, but deep correction is expected...30% or deeper correction lasting until the end of the summer.

Delayed planting progress is launching a bull market in CornA massive H&S bottom is unfolding in the Corn market due delayed plantings in the major Corn growing states. Corn has already completed a very rare V-extended bottom, accompanied by a series of potential breakaway gaps.

Corn, the Weather Drives the RallyFollowing the disappointment of the failed talks between the United States and China about two weeks ago, grains, particularly corn and soybeans, have fallen. The corn price dropped to a new low of the year (Monday, May 13). Since that time, the corn has started a steep rise due to the known meteorological problems.
If we take the chart of the futures contract delivery July, we can see how strong has been the rise over the last seven days, and that has led the price to break the trendline resistance of the bearish channel, within which corn was moving from July 2018.
When these situations happen, when an external factor (in this case the climate, the heavy rains) influences so strongly the price of a commodity, the best thing to do is to wait for the effect ends, and for the price to start a "return" towards a normal value.
Yes, because if we exclude the weather, the situation for corn (and all other grains) is not improved, on the contrary...
This rally of the price is a real breath of fresh air for American corn farmers. The collapse of the price has brought to their knees many of them. The trade disputes have already caused a $6.3 billion loss to corn farmers in 2018, and 2019 could be even worse.
It does not mean the rally has to stop right here. The forecast promises more rain the next ten days, and that will give new fuel to the strong bullish phase, but do keep in mind that the rallies, particularly short-covering rallies, can end just as abruptly as they began.
So, I repeat, we have to be patient, wait for the climate effect ends, and only then will we be able to open bearish positions, taking advantage of a return of the price to a value more consistent with the moment we are living.
A fundamental rule in trading is to never anticipate market entry. Remember that it is always better to take a small part of a big movement, rather than a large part of a little movement.
So never be impatient to click on buy or sell.
