Coronavirus (COVID-19)

Is SP500 ready to a corrective wave?Hello, traders.
SP500 is testing a major support zone after a 1 2 3 4 5 impulsive wave, and now the price is correcting on what can be the begging of a bigger A B C correction.
But is earlier to say because we must see the support of the pre-COVID all-time high playing.
Best regards.

Getting Nervous About Overbullishness1. Trendlines, no matter how you draw them.
2. ATR. Patterns!
3. Stochastic range. Likes hanging out at the top, but it eventually gives.
4. Election year. Federal reserve independence. What will happen when the money supply is affected?
5. Dark pool indexes showing steady uninvestment.

Stock Market Crash or Pullback?If you have been a follower of my work, I have been saying that stock markets will only be moving higher as it is the only place to chase yield in this world. We are setting up for a parabolic move higher.
The past two trading days, saw big drops on the US equity markets...amusingly, the perma bears are back, and the financial media quickly shifts their stance to "beginning of a bear market". A good example of why financial media is REACTIONARY. If what the financial media and mainstream media told you was true, then everyone would be rich! But the markets make their moves way before...and in my humble opinion, adheres to market structure which is the way I approach all markets.
After the S&P 500 broke out, we say money chasing the breakout. Perfectly normal. Likely a lot of daytraders, but you can make a good case that domestic funds started increasing their allocation of US stocks as the bond market was showing us that money was leaving the safety of the bond markets. Following the asset allocation model of stocks and bonds that funds utilize, we can predict that this money cannot remain in cash forever, and that it was going to the stock markets.
Certain fund managers did not chase US stocks higher because they believed the bottom in equities was not it. That there was another leg lower coming which would take us below February lows. Well, the stock market officially ended its shorted bear market in history, and started a new bull market with the new highs. If you were a fund manager who did not participate in that rise, you really have no excuse now. This money will enter US stocks, and I argue foreign money too, which will cause a parabolic move.
Back to the chart. After days of moving higher, you could just feel the euphoria and the FOMO. It just felt a pullback was necessary. In fact, this move down to me was just that. A pullback. Remember: when break outs occur, it is perfectly normal for price to retest the breakout zone before continuing higher! Ideally we want this to happen a few days after the breakout, but there are times when momentum carries price higher to another resistance level BEFORE selling off to retest the breakout zone.
Notice price action on Friday too. We had a large red day which broke below a major support level on the longer term charts. Many traders chased this move lower. They thought this was the big sell off. Look at how the candles closed. Large wick candles with the body closing above support. This is a fake out, or a bull trap. Look at the Nasdaq and the Dow too:
The Dow is still holding a major support/flip zone.
Two important lessons here: 1) This is why we look at the long term charts to spot market structure trends and key zones.
2) We wait for candles to CLOSE before entering positions or determining whether a break down/out is happening. This is very important as you many traders lost money thinking this was the large stock market crash.
I have said many times that stock markets are the only place to go for yield. The fundamentals have not changed. The real economy does not matter. There will be more cheap money for a very long time. In fact, the Fed and other western central banks cannot hike interest rates anymore. The amount of debt that government and citizens have had to take means a slight rise in interest rates will destroy them. This means interest rates will remain close to 0 for a very long time, and it is much more likely we cut interest rates to the NEGATIVE (following Europe and Japan and others) which would allow government to service the debt as it is likely more spending programs and benefits will be coming. Essentially, the monetary policy side has used all their ammunition. Sooner than later the Fed will announce they are actively buying stocks to keep markets propped. Now the onus is on the fiscal policy side, and we can deduce that governments will announce more programs to try and spur the economy and keep people afloat.
With all these things in mind, it is safe to say the party is not over. Will there be a time when markets crash? Yes. And it will be the largest wealth transfer in human history. Wall Street knows the party is not over. Central Banks will do whatever they must to keep markets propped, but there will be a time for the reversal. For our crash, our eyes will be on the bond markets. One day, bonds will sell off which will cause interest rates to spike (likely into double digits). This will be our signal for a stock market crash. Right now, most central banks are buying bonds and suppressing interest rates. When they are ready for the culling and an implementation of a new system, they will sell.
The other possibility comes from a black swan event. I think this will come mainly from some sort of geopolitical news regarding US and China. Although Turkey and India and China are other hot spots. If some sort of shooting war begins...markets would not like that. Maybe a second wave of Covid? I am not too sure, since we are seeing a lot of questions being raised about the testing and deaths being wrongly attributed. Also, a vaccine would cause markets to pop... we found out the Chinese have had one since July and have been innoculating the military, health professionals, and border guards.
Finally, what about the US elections? I do think that whatever side wins, the losing side will not accept the results. There will be major violence on the streets of America. This plays in with my confidence crisis scenario (a confidence crisis in central banks, governments, and the fiat money) and why you want to be holding hard assets like Gold and Silver. But the fact is, regardless of who wins, more cheap money is not going to change. I would even argue markets would shoot higher on a Biden victory because it would mean even MORE cheap money.
It is really going to be crazy times ahead, and I still do not think we have seen the parabolic move in equity markets yet. Once the Dow breaks out into all time new highs, we are closer on that road. But going forward, unless we see some sort of topping pattern from here, such as a double top or head and shoulders, do NOT short this market!


2020 Xmas Bull party I still believe the 2020 Xmas Bull party is a good possibility. Covid, stimulus, tad markets still kinda fckd eveything up. An up coming stimulus may fck this idea completely. Buy zone circled in green

Gold was almost never that cheap!If we look at Gold in a spread graph divided by the dow, we see something interesting:
Either Gold was almost never that cheap in history, or the stock market were almost never that pricy.
A good example about why price does not reflect value.

12 Years a Slave - S&P ChannelI think the chart explains itself. We are at a critical moment. If price finds support on top of channel (making higher highs), then a new cycle outside of channel has begun. Expect another bull cycle?
If price does not find support on top of channel and is rejected, then we could come back down to the bottom of channel and re-test March lows.
This month will be critical to find out.

BioNTech Stock Will Soar With Its First-Mover Vaccine AdvantageNASDAQ:BNTX a German company and its american partner NYSE:PFE
will likely have a first-mover advantage in the coronavirus vaccine race in the U.S. This will affect both stocks, once the final vaccine results are in.
Assuming the bottom is in and we are about to continue the Trend as previously, im expecting a big move after the approval, so dont forget to take risk of the table!
The reason for this is that the two companies are expecting to be the first to produce large-scale results from their Phase 2/3 clinical trials in October, according to Barron’s.
Depending on how effective their vaccine is, the U.S. Food and Drug Administration may even grant it emergency-use authorization
The advantage of their trial is that it is large, involving more than 30,000 participants.
The FDA wants to see at least 50% efficacy in trials before granting any Covid-19 authorization.
Why BioNTechs Vaccine Looks Like a Winner
With Pfizer in the back FDA and President Donald Trump are likely to move quickly.
According to them even the first small study with 24 Persons that took their messenger RNA vaccine produced antibodies.
With a lower doses usage of the vaccine and developed antibodies after 28 days — at levels about two times higher than in normal, recovering Covid-19 patients.
BioNTech and Fosun Pharma to Potentially Supply 10 Million Doses of BioNTech’s BNT162 to Hong Kong SAR and Macao SAR
Also a Deal to Supply Japan with 120 Million Doses of Their BNT162 mRNA-Based Vaccine Candidat
This combined with the huge buying volume and market shifts will grant momentum for bigger goals.
Just think about what ccould happen when they get kinda a monopol situation going for them.
Thank you for take the time and reading this and as always stay storng in those shaky times!
Sebastian

damn bitcoin, we will see you lowerfractals hey, guess everyone will buy it down here or will everyone expect lower when lows come haha

Bitcoin's pullback right on timeIt's very strange and scary how accurate indicators can be and with knowing full well TA is known to not be anything but magic. Well again not wanting to brag, but if you been following its crazy how a target of 10077.20 was hit give or take today, but why? Correlation to the stock market or something more? Well my friends heres a theory, a crypto theory on why I believe a correction was due and we hit the final accumulation phase of 2020.
Theory
Well stock market vs crypto have been uncorrelated until recently and well CME has accomplish their goal. Now what caused this drop, its cause crypto is partially correlated, yet is different due to fact i talked about before THE LIQUIDITY. I said theres an article that came out a while back saying theres only about 100million usd holding up the market which makes sense due to the bitcoin marketcap towards gold and most of the cryptos marketcap is from btc pairing. Thats why to my new crypto investors is why alts take massive damage in a btc dump because theres one goal in crypto trading, get as much bitcoin as possible before new ath.
So why did the stock market drop? Well a few can reason at this given time of writing this can explain this
-Election season in the United States: It's still uncertain, but with recent polls Trump is gaining steam due to the riots of "radical left." So its fear driven
-Only news today DrFauci , that little *** came out today saying the vaccine might not work. Only major news for stocks
-Too much money poured in to tech like Tesla and Apple, which caused them to dump over the past two days in which could have caused feared in other assets. Besides Gold, its holding up.
Now Crypto related
-Bithumb still under investigation?
-DeFi bubble, yet coins like YFI and DOT havn't seen massive downward movement. Btw I guess I'm the Bill Ackman of Pokadot and think its a massive scam due to the exchanges and liquidity its on. I posted a TA, but Pokadot is acting like a ***.
News
-In my theory
TA
-We hit our goal, whats next? Why not an 80x on bitcoin leverage or atleast 40x. I'm hoping for three things, but really two of them is a if
1: Never go below 10k, yet as caution it is possible to go as low as 9563.72 to see if the CME has a control over a bull market. Yes we are in a long term bull market, yet this current market cycle is a bear cycle until we establish a bottom.
2: Go sideways for strong accumulation for the 2021 ath.
3: Third way it could go is we get a bounch back to the 11k and test it before finding a middle ground for an accumulation phase.
-Now we can remove 11010.26 from our charts due to the fact we blew past it. At the moment we could see a price increase of 3.9%-9.9% upwards, yet a downward movement of 1.74%-6.6%/9%
-RSI is oversold (no sh*t)
-MACD well below -100 and is at -200, which is probably a go all in moment if you believe. I do suspect a massive bounce, yet we will see very soon.
-EMA is sh*t
Overall
Best time to buy imo and don't suspect much futher downward movement besides at most and very scary a sub 10k btc at 9563.72 (maybe put some buy orders and forget about it in that range). Again at this price i believe we are getting fair value at this current level. You may refer back to my other Bitcoin TAs if you want. My stock TA are wierd since I deal with pennystocks, yet I do other blue chip stocks if I like the technology.

Bearish Divergence on monthly chart for the S&P 500 Any thoughts on the monthly bearish divergence on the S&P 500? It even goes all the way back to 2018. It looks obvious to me, but I'm open to discussion. If there's a big sell-off here I would of course expect the Fed and Gov to step in again and start spending money. This also coincides with the fact that the sugar from the last round of Fed and Gov stimulus is wearing off. Things could get ugly here, the whole market has been expecting a correction for quite some time now too. That is unless the Gov comes together and puts out a package before the sell-off.

RLFTF - Penny Stock Heating UpAnticipating some positive news from RLFTF's and further FDA approval for it's Aviptadil.
ABCDE Triagle wave approaching completion, confirmed by Williams Alligator, and Fib Retracement
A bounced off 0.382 level
C bounced off 0.5 level
Look for E confirmation off 0.618 level
Should price exit the triangle formation, setting target @ $1.2

bitcoin, oh shoot its a rising wedge one more push into rejection and we could well die.
rising price on declining volume = bearish.
aim for he cloud to catch
cme gap below 0500, then lower (gulp)

[NVAX] Still holding - Novavax is first "safe" COVID vaccineThis proved to the market and world governments that their nanotechnology is superior and that it works. Next stop, flu vaccine. I'm holding.
Disclaimer: Not financial advice. Just my opinion. See my related posts.
Source: www.cnn.com

NZDUSD Locked In range NZDUSD seems to be Locked in a range between 0.6785 and 0.6731, an upward direction will be probable, as the ratio among most brokers is around 70% of the traders are going short, in which according to the Crowd theory (the crowd is always wrong) expect the price to go the other way most of the crowd thinks.

Study from anywhere & go longAlthough there are other value study at home stocks like HMHC & LRN. CHGG is the only 1 with the momentum and versatility to work for every age group and benefit in 2020 & beyond. TA supports my point along with solid fundamentals.
*personal opinion = trade at own risk


EDGE OF THE CLIFF?Are we about to see Covacrash 2.0?
Friends, this chart here speaks a thousand words as to where we are in this "V Shaped Recovery", "Super V" whatever you want to call it. Doesn't matter what you call it, it is simply money printing and bond buying galore by the U.S. Federal Reserve and Donald J Trump. Be very cautious here going forward.


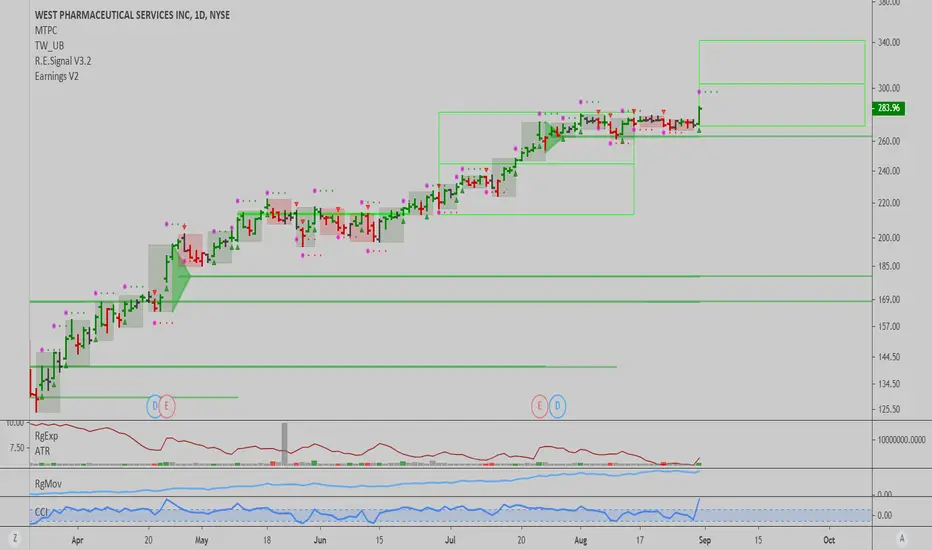
$WST: Weekly trend signal activeWe have a nice signal here in $WST, a trend signal lasting until the 2nd week of October at least, as long as prices hold over the $270 mark. A clear beneficiary of the pandemic, $WST has been growing steadily for a long time, and although overvalued, I think we can squeeze some more upside from the stock before a major top forms.
It will be interesting to see how it acts going into the next quarterly report.
I'm using a proprietary strategy to benefit from these trend signals, you can trade this setup with long stock positions or using options. I'm favoring options for the most part lately, due to the elevated downside risks we have for the time being. I'm skeptical but open to the possibility of a rally peaking by October or EOY, before witneseeing the next large scale correction across most asset classes like we had in February.
Cheers,
Ivan Labrie.

#TCNSBRANDS #BANKNIFTY #NIFTY #TRADING #COVID19 #TCNS #CLOTHING#TCNSBRANDS #TCNS
TCNS Clothing Company Ltd.
CMP: 352.85
Target: 371 / 411
SL: 331
If you like my work, kindly donate. :)
