Elliott Wave Impulse Decline in XOM Suggests Further DownsideShort term Elliott Wave view in Exxon Mobil (ticker: NYSE:XOM ) suggests that the decline from 4.28.2023 high took the form of a 5 waves impulse. Down from 4.28.2023 high, wave (1) ended at 115.64 and rally in wave (2) ended at 117.30. The stock resumes lower again afterwards. Down from wave (2), wave 1 ended at 114.45 and rally in wave 2 ended at 115.22. Stock resumes lower again in wave 3 towards 109.29 and wave 4 rally ended at 111.39. Final leg wave 5 ended at 108.15 which ended wave (3). Stock then rallies higher in wave (4) towards 109.81 and then extends lower in wave (5) towards 105.5. This completed wave ((A)) in higher degree.
Wave ((B)) is currently in progress to correct cycle from 4.28.2023 high. Internal subdivision of wave ((B)) is unfolding as a double three Elliott Wave structure. Up from wave ((A)), wave A ended at 109 and dips in wave B ended at 105.80. Wave C higher ended at 110.97 which completed wave (W). Pullback in wave (X) ended at 108.1 and the stock has resumed higher again. Potential target higher for wave (Y) is 100% – 161.8% Fibonacci extension of wave (W) which comes at 113.5 – 116.8. Near term, as far as pivot at 119.9 high stays intact, expect rally to fail in 3, 7, 11 swing for further downside.
Correction

Bitcoin broad perspectiveMost would agree that cryptocurrency is experiencing a significant correction, if not in the middle of a bear market. Zooming out, and taking the long view, what appreciation can we reasonably expect bitcoin to have?
The blue trend line is the most important part of this chart. It assumes an annual return of 250% based on the trend set from August 2015 to April 2017. After that, bitcoin began a new trend resulting in gains at a pace of 1000% annually until the end of 2017. In order to get back on track to the 250% return line, BTC prices will need to reach some painfully low levels. The most optimistic curve appears to me to be the least likely.

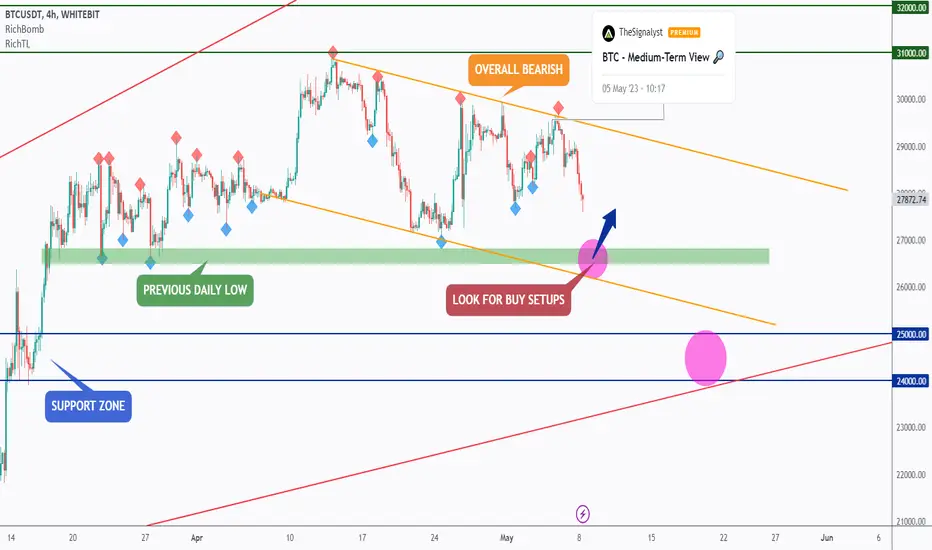
BTC - Correction Started ❗️Hello TradingView Family / Fellow Traders. This is Richard, also known as theSignalyst.
As per my last analysis (attached on the chart), we know that the correction already started as BTC broke below the last H1 low.
Now what?
🏹 BTC is still overall bearish, and we are expecting a movement till the lower bound of the orange channel which is also lining up with the previous daily low in green.
📈 As per my trading style:
As BTC approaches the purple circle zone, I will be looking for bullish reversal setups (like a double bottom pattern, trendline break , and so on...)
UNLESS the green daily low is broken downward. In this case a deeper correction movement till the 25,000 support would be expected.
Which scenario do you think is more likely to happen first? and why?
📚 Always follow your trading plan regarding entry, risk management, and trade management.
Good luck!
All Strategies Are Good; If Managed Properly!
~Rich
{ZYDUS LIFESCIENCE}:{(SHORT POSITION)FOR{4:1}}
After being in an UPtrend for a while now, Its correction time Price will retrace back to the Fresh Monthoy Demand and will again presume Buying for long term, Investment Traders can book their Profits and add again when Price reaches the Monthly Demand.
ENJOY THE RIDE !!!
The Brackets come naturally bein a coder!!!

BITCOIN will move higherAccording to the on chain data and fundamentals BTC will move higher again to 30K+.so in that case we are only looking for buy positions

EURUSD before NFPYesterday, the ECB expectedly raised interest rates by 0,25% and caused volatility in EURUSD.
Today is third day with important news.
With this news we expect the direction to be confirmed and to see more clear entry grounds.
The more likely direction for now, remains 1,1090 and upon a breakout to confirm the uptrend.
Drop below 1,0985 will mean that there is no strength for the upward movement to continue and we will look for lower values.

Russell 2000 (RTY) Looking to Break LowerRussell 2000 (RTY) Cycle from 4.3.2023 high is in progress as a 5 waves diagonal. Down from 4.3.2023 high, wave (i) ended at 1752.7 and rally in wave (ii) ended at 1825.43. The 1 hour chart below shows the chart starting from wave (ii) peak. The Index then resumes lower in wave (iii) towards 1731.7. Internal subdivision of wave (iii) unfolded as a 5 waves impulse. Down from wave (ii), wave i ended at 1794.8 and rally in wave ii ended at 1814. Index resumes lower again in wave iii towards 1733, wave iv rally ended at 1748.80. Final leg wave v ended at 1731.7 which completed wave (iii).
Index then corrected in wave (iv) with internal subdivision as a zigzag Elliott Wave structure. Up from wave (iii), wave a ended at 1762 and wave b pullback ended at 1742.20. Final leg wave c higher ended at 1796.50 which completed wave (iv). Index resumes lower again in wave (v). Down from wave (iv), wave i ended at 1720.4 and wave ii ended at 1778.9. Wave iii ended at 1716.70. Expect wave iv to fail and Index to resume another leg lower to end wave v of (v) of ((i)). Afterwards, Index should rally in wave ((ii)) before it resumes lower again. Near term, as far as pivot at 1825.43 high stays intact, expect rally to fail in 3 ,7, 11 swing for further downside.

MY ANALYSIS FOR USDCHF 2ND OF MAY 2023Here the triangle formed and there was a breakout above but unable to move up and reverse and break another one below so is likely that the market will move down big so going for short is needed

LIVE TRADING FOR AUDUSD ON 2ND OF MAY 2023Here the market is selling but will still make some change according to the Elliott wave predicting that level of 5 will still complete by going up,So going for long trade is needed


No trades on EURUSDTomorrow the FED is expected to rise interest rates to 5,25%.
We prefer to wait for the news to pass before looking for new trades.
Yesterday we saw a new attempt to rise, followed by sharp decline and test of the lows around 1,0960.
Upon a new test it’s possible to see breakout and heading towards 1,0900.
For new entries, we’ll wait for the news to pass and movement to be confirmed.

Elliott Wave View Suggests Silver (XAGUSD) Correction continueSilver (XAGUSD) ended cycle from 3.10.2023 with wave 1 at 26.08 as the 45 minutes chart below shows. The metal is now correcting cycle from 3.10.2023 low in wave 2. Internal subdivision of wave 2 is unfolding as a double three Elliott Wave structure. Down from wave 1, wave a ended at 24.78 and wave b rally ended at 25.31. Wave c lower ended at 24.62 which completed wave (w). Corrective rally in wave (x) ended at 25.48. The metal resumes lower in wave (y) with internal subdivision as a zigzag. Down from wave (x), wave a ended at 24.76 and wave b ended at 25.35. Wave c lower ended at 24.47 which completed wave (y) and ((w)) in higher degree.
From there, the metal formed wave ((x)) connector with internal subdivision as a double three in lesser degree. Up from wave ((w)), wave (w) ended at 25.22 and pullback in wave (x) ended at 24.49. Wave (y) higher ended at 25.9 which completed wave ((x)) in higher degree. The metal then turns lower in wave ((y)) with internal subdivision as a zigzag. Down from wave ((x)), wave (a) ended at 24.86. Expect rally in wave (b) to fail in 3, 7, or 11 swing for further downside. Potential target lower is 100% – 161.8% Fibonacci extension of wave ((w)) which comes at 23.31 – 24.29 area. Near term, as far as pivot at 26.08 high stays intact, expect rally to fail in 3, 7, 11 swing for further downside.

BTC long run outlook everything has been confirmed using MA200 plus adding a reversal trend following mid-May 2023 to 2024 onward. correction point would be expected to be around 24800 price point with confirming accumulation breaking trend upward of 31300 point, but a rejection point seems to be expected here minor shorts may be happened due to heavy buying and selling. overall if breaks reversal shorts to longs could confirm the long run from 31300 points to its ATHs zone.

Important levels on EURUSD During the yesterday’s news we saw fluctuations in range 1,1000-1,1060.
Currently, it’s important to see breakout outside of that candle.
Key support level is 1,1000.
Upon pullback from this level we can expect another rise towards 1,1060 and test of the previous tops.
On breakout , we’re headed for a test of 1,0960 and the previous lows.

Should break and make double top Gold is in a good position to buy before big drop occurs.
I bet 1986 area can hold and the support is pretty strong ; tug-a-war with sell pressure but I know the bulls can take this and handle it there.. break the pressure and bring the buyers pressure to overcome it and should get exhausted until hit about 2060 or 2080 area for a sell off.
The Feds had confirmed that USA will have a mild recession at the end of 2023 and should expect the big drop before end of 2023 4Th Quarter or before end of 3rd Quarter of 2023.
Trade safe and watch any reversals

$BTCUSD holds steady around shortterm POC $27k but how for long?The macro trend for BITSTAMP:BTCUSD is..
And this publish looks at the Intermediary Wave 4 in further detail by studying the characteristics of Minor Wave 5.
Here are the 2 possible scenarios to play out in the days and weeks to come:
Scenario 1
Intermediary Wave 4 is not yet completed, despite touching 0.328 retracements, and will play out in a triangle, as Waves 4 usually do.
This means Minor Wave 5 will break down further, possibly towards 0.328 fib targets of $26.4k.
This is the stronger scenario that I will lean on.
Scenario 2
Intermediary Wave 4 is completed, aka Minor Wave 5 is also completed.
This means Intermediary Wave 5 is underway, aka Minor Wave 1 is also on its way.
Aka we've seen the bottom for the year, although I do not lean towards this scenario, here's one for cautious optimism.
Sidenote 0: Divergence on the shorter timeframes. Volatility.
Sidenote 1: Waves 1 are typically motive/impulse waves accompanied by cautious exuberance, but the news is rather stale at the moment. Dullness.
Sidenote 2: As of pixel time, Coinbase NASDAQ:COIN is sueing SEC for lack of regularity clarity. It's scary time indeed. Uncertainty.
Sidenote 3: FOMC meeting in 8 days and 84% (today) expectations that we'll see 500bp for the first time since 2017. Sell pressure.
Sidenote 4: Last month saw the Mt Gox CRYPTOCAP:BTC redemptions which will go on until near end of year. Sell pressure.
Sidenote 5: China is smiling at crypto again, while Binance lifts its Russian restrictions. Bullish.

EUR-GBP Will Go Down! Sell!
Hello,Traders!
EUR-GBP has retested a
Horizontal resistance of 0.886
And failed to break the level
So now we are seeing
A nice bearish reaction
And I think that the pair
Will go further down
Sell!
Like, comment and subscribe to help us grow!
Check out other forecasts below too!

Important USD news Today GDP data is going to be released.
We expect the news to have an impact and cause fluctuations.
We will look for new trades after the news when the direction is confirmed.
If the uptrend continues the next resistance levels are 1.1154 and 1.1276!

XRP/USDT 4HInterval check the current situationI invite you to review the XRP chart in pair to USDT, also on a one-day interval. First, we will use the purple lines to mark the downtrend channel in which the price is currently moving.
Moving on, we can move on to marking support areas when we start a larger correction. And here, the first support is at $0.45, the second support is at $0.43, the third support is at $0.41, and then the fourth support is at $0.39.
Looking the other way, we see that the price has reached the first resistance at $ 0.48, which so far has no strength to break. However, if it manages to break out above, the second resistance is at $0.51, the third at $0.53, and then the fourth at $0.55.
At this point, it is worth looking at the EMA Cross 10 and 30, which indicate that we are on the verge of returning to an uptrend.
The CHOP index indicates that most of the energy has been used, the MACD indicates that we are moving in a local uptrend, while the RSI has a return to the upper part of the range, which may give a moment of recovery before further growth.

EURNZD long term outlook is bullish... BUTFor EURNZD there is much more upside potential in the long run. However, after the recent rally, a pullback would be quite healthy. The price should be aiming for the 61.8% Fibonacci retracement area, before/if the uptrend continues.

BIG SELL ON NAS100after the BOS, that's your indication & after the indication, you will see a correction & then a continuation. we can expect to catch this big sell all the way down!!! use proper risk management. only risk 1-2% of your acc. more opportunities will arrive. never get greedy!! Follow me for more ideas

USDCAD I Key resistance broken. Expect pullback and more growth!Welcome back! Let me know your thoughts in the comments!
** USDCAD Analysis - Listen to video!
We recommend that you keep this pair on your watchlist and enter when the entry criteria of your strategy is met.
Please support this idea with a LIKE and COMMENT if you find it useful and Click "Follow" on our profile if you'd like these trade ideas delivered straight to your email in the future.
Thanks for your continued support!

The rise on EURUSD continues Yesterday EURUSD managed to breakout 1,1000 and tested the previous top.
We expect the uptrend to continue, additional confirmation will be breakout of 1,1074.
The next resistance levels are 1,1154 and 1,1274.
Upon decline below 1,0900 the scenario breaks down.
