Mina/usdt CorrectionMina/Usdt on Binance 4h Needs Some Correction and Fear Index RSI Dropping Lets See What's happen, if have your idea please share with us, Thanks
Correction

A Recession vs a Bearish Correction The bitter memory from 2008 still persists in our minds, or at least in the minds of those who witnessed first hand what a Great Recession is. In 2008 many variables were set and many gears were in motion. Long story short, even though the media has attempted to call a recession, or to spread the fear of the bear among the people, which technically yes, it is a bear market by definition, it is not a recession, just yet.
We’re in a hiking rate environment, and still the major indexes have managed to find support on the long term moving averages. Comparing the levels and the moving average crosses today and in 2008, the main difference we find is the levels did cross down and the trend was officially bear. Afterwards a capitulation took place and the macroeconomic variables changed to provide the environment for a rebound and a reversal which gave birth to this secular bull market.
We’re not at the capitulation level, the volume has been steady and we’re on the bullish side of the trend. What did we just witness? A bear leg, basically a painful correction. The indexes are turning to the upside, the market took profits and the VIX scratched above the 20 level. We’ll probably see more selling because we’re in the take profit part of the short term cycle. We’ll see how deep the market is willing to dive, but the positive momentum divergence and the back to the green of the indicators show the intent to go for a bullish leg.
The target area is at the 4500-4600 level.

✅APPLE MOVE DOWN AHEAD|SHORT🔥
✅APPLE price went up sharply
But a strong resistance level was hit
Thus, as a pullback is already happening
And a move down towards the target shall follow
SHORT🔥
✅Like and subscribe to never miss a new idea!✅

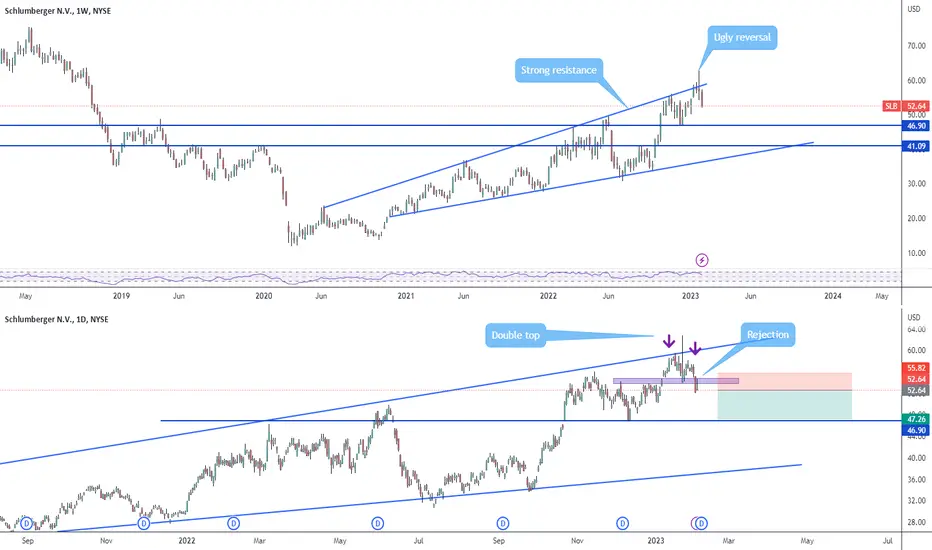
Ugly reversalTop chat in the weekly time, bottom chart in the daily timeframe,. Looks that price is heading to the $47 support level. It may drop to the bottom of the channel but the energy sector still strong. I take profit at 47, then I'll see.
Decline on EURUSD For several days now, we have been waiting for the EURUSD correction to join the continuation of the downward movement.
Yesterday we saw a pullback just before the zone and now we will watch for a new bottom.
On a break of the previous bottom, the target will be 1.0565.
If you already have trader, reduce the risk when the price reaches 1.0680.
The best scenario for new trades, is when the price rises to 1.0750 and pullback from this level.

BTC: CORRECTION PHASE BEGINS! DO NOT BLINDLY BUY THE DIPS!!Hello everyone, if you like the idea, do not forget to support it with a like and follow.
Welcome to this quick BTC update. Everyone was expecting $25k before the correction but as you know BTC always gives surprises. Currently, it is trading below the $22k level. Let's discuss what's the next possible scenario from here.
BTC start correcting itself. We have two significant supports. One is at the $21.5k-$21.8k level and another is at the $17.5k-$18.5k level. If BTC couldn't hold our first support then be ready to buy in the lower areas.
This is the time you have to be very patient. Of course, the market gives some bounces but all these bounces are just trapped IMO. So better wait for confirmation and not take any trade blindly.
If you like this idea then do support it with like and follow.
Also, share your views in the comment section.
Thank You!

Selling zone at EURUSD Yesterday did not provide new opportunities.
We have seen a hold and continue to expect to reach the resistance zone.
On pullback from it, we will look for sales entry.
The goal remains a breakout of the previous bottom, and we will determine the specific profit levels after the end of the correction!
There is no reason to buy at these levels!

BITCOIN: Did it can fly to 48 000$#BTCUSDT
as you can see at the chart in daily chart time-frame we have very important and strong support zone in 12/2020 price flew from this powerful support zone to 65000$ i think the scenario will be repeated dont's miss up this opportunity buy and hold it to the next targets at the chart
First target: 32000$
Second target: 40000$
Third target: 48000$
i expect there will be a correction move and i expect the price will fly to the target at the chart
About technical indicators overview show a bullish move MACD is showing bullish RSI showing bullish EMAs showing a bullish move Ichimoku cloud is neutral Fib retracement is showing bullish ZELMA is showing uptrend-move Parabolic SAR is bullish Accumulation distribution is neutral Awesome oscillator is showing bullish
Thank you, and for more ideas, hit "Like" and "Follow"!
You may also TELL ME in the comments section which symbol you want me to analyze next and on which time-frame. The one with the most posts will be published tomorrow! 👏🎁

AUDUSD - Looking To Sell Pullbacks In The Short TermH4 - Bearish convergence.
Currently it looks like a correction is happening.
H1 - Bearish trend pattern followed by double wave correction.
Bearish divergence.
Until the two strong resistance zone holds my short term view remains bearish here.

BTC road to $21,300In this chart, you can see BTC broke below the ascending wedge we've had since January. Not only this but it printed bearish RSI divergence with each higher high. It ended with a double top near 23.8-24.3k and the peak of the pump ended with a gravestone doji, which is a bearish candlestick. The last candle was also a gravestone, and am expecting another touch of the lower trendline, which will be broken. Be careful about the moonbois, all the signs are pointing to a correction.

Eur/UsdHello traders! In my opinion, in medium term this pair is sell.
Target:
Buy 1.0880 (sell confirmation)
Sell 1.0160
Be careful and wait for a confirmation!
Don`t forget to look at the economic calendar!
MAKE MONEY AND ENJOY LIFE 💰
THANK YOU!
GOOD LUCK!
🙏🏻🙏🏻🙏🏻

Sells on EURUSDThere was a lot of news last week and we saw great volatility
This week we will look for a continuation of the drop towards 1.0692.
For this we need to see a correction to the sell zone.
It is currently at 1.0870-80.
On reaching the zone and pushing back we will be looking for an entry!

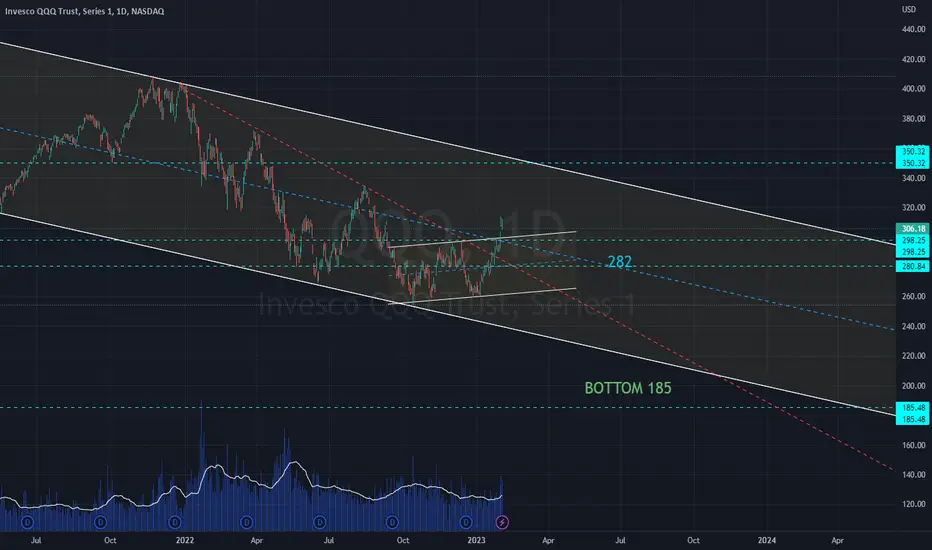
QQQ CORRECTION CORRECTION 2023After an extensive analysis of options volume, trend, Fibonacci, support, and resistance.
We could have a correction on the QQQ until 185 after that a renounced and a retest of 185 to make a bottom of 160 for end of 2023 or 2024.
✅GOLD CORRECTION AHEAD|LONG🚀
✅After the retest of the of horizontal support
It makes sense to expect a bullish correction
As GOLD is oversold and the market players
Will be taking profit from the level
Fuelling a buying wave
LONG🚀
✅Like and subscribe to never miss a new idea!✅

NzdChf sell stophello world!
after impulse a correction and when break it can do another impulse
so I put a sell stop below the support
with 1.69 RR
like and follow if you like and agree with me
comment below your opinion

BTCUSDT Short!Dear guys, I am shorting from 23.6k
hopefully 22.8k is my target or even more
what about you guys?
Don' trade blindly!
Thanks!
Cheers!

GBPAUD I Correction and bearish continuationWelcome back! Let me know your thoughts in the comments!
**GBPAUD Analysis - Listen to video!
We recommend that you keep this pair on your watchlist and enter when the entry criteria of your strategy is met.
Please support this idea with a LIKE and COMMENT if you find it useful and Click "Follow" on our profile if you'd like these trade ideas delivered straight to your email in the future.
Thanks for your continued support!

It needs a correctionIs super over extended. It can go down very fast. It just opened a short position.
AUDCAD - Looking To Sell Pullbacks In The Short TermD1 - Bearish divergence.
Currently it looks like a correction is happening.
Expecting short term bearish move towards the key support zone .
H1 - Bearish trend pattern.
Currently it looks like a pullback is happening.
Until the two strong resistance zones hold my short term view remains bearish here.

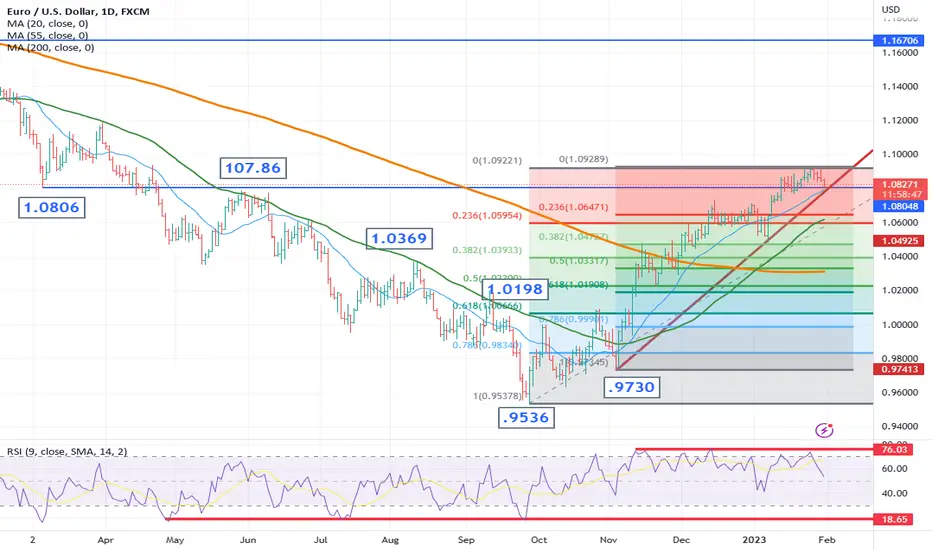
Back to Basics – How far a corrective move is likely to goWith several markets showing signs of corrective activity this week ahead of the Fed (gold, EUR/USD, S&P). I want to take a stab at answering that thorny question of how far a market is likely to correct. I am going to use the EUR/USD daily chart for my analysis. First thing I do is note where any trend lines are and ask are they vulnerable? If they are, I then ask what level needs to break in order for the correction to get underway in earnest. For EUR/USD that would be 1.08/1.0775 (location of the uptrend, 20-day m.a., the May peak and the March low). I then apply Fibonacci retracements; this could be one retracement, or it could be several.
So how do I decide where to attach the Fibo’s.
Let’s take a look at the recent up move on the daily EUR/USD chart. There will be several ways to do this and no one way is right or wrong. But as a rule of thumb, I like to go from the lowest point of the move to the highest point of the move, unless we have a secondary low that is more than a 78.6% retracement of the first low and it is clear that the move started from there. For today I am going to use the .9536 low charted in September. I am also going to apply a Fibonacci retracement from the .9730 November low. Why from that point? Because if you look at the chart you can see that the up move started to accelerate from that point.
I then look for convergences.
So, we have two Fibonacci retracements – next thing I look at is are there any convergences? On this chart not really, but the 50% and 61.8% retracements are close enough at 1.0191/10230. We also find the 1.0198 September high there as well. So that should act as the floor for any correction down. Just ahead of here lies the 200-day m.a. at 1.0311, and realistically I would like this to hold for a nice healthy up move to remain in place. What happens if this area does not hold? It could suggest that the market is starting to weaken once more, that the up move is weakening… you have to become hyper vigilant.
So how do we determine which Fibo is likely to hold?
I like to use the daily RSI, I tend to use a 9 period indicator. If you read any textbook on the RSI, they will tell you below 30 is oversold, above 70 is overbought. I say – ignore that – look only for clear divergences to determine oversold and overbought, and also work out from the indicator itself where the support and resistance is – so for EUR/USD that is currently 76 on the topside and 18.65 on the downside (see red lines on the RSI). When the oscillator gets down to 20/18 – whatever Fibonacci retracement is in that vicinity is likely to hold.
Bet you thought technical analysts just guessed (too funny!!), well we don’t!
Disclaimer:
The information posted on Trading View is for informative purposes and is not intended to constitute advice in any form, including but not limited to investment, accounting, tax, legal or regulatory advice. The information therefore has no regard to the specific investment objectives, financial situation or particular needs of any specific recipient. Opinions expressed are our current opinions as of the date appearing on Trading View only. All illustrations, forecasts or hypothetical data are for illustrative purposes only. The Society of Technical Analysts Ltd does not make representation that the information provided is appropriate for use in all jurisdictions or by all Investors or other potential Investors. Parties are therefore responsible for compliance with applicable local laws and regulations. The Society of Technical Analysts will not be held liable for any loss or damage resulting directly or indirectly from the use of any information on this site.
DAO Is Searching For The Strong SupportCryptocurrency DAO Maker is trading bearish for the last year, but the wave structure looks like an A-B-C corrective decline that can be slowly coming to an end, ideally at the end of 2022 or beginning of 2023.
From Elliott wave perspective we are already tracking a motive wave C, which should be completed by a five-wave cycle of the lower degree. In this case as an ending diagonal (wedge) formation, where final wave (5) of C can be now in play.
Technically speaking, we believe that strong support may not be far away, probably here at the yearly lows, here around 1.0 level or maybe slightly lower. There's also a chance for a spike down before we will see a bullish reversal, just keep in mind that first bullish evidence is only in case if we see sharp or impulsive rebound back above 2.55 region.
All the best!

EURUSD buy zoneBuying zone on EURUSD
Yesterday we determined the buying zone on EURUSD and it remains unchanged.
We will watch if the price reaches the zone and pullback from it.
The announcement of Interest rate for USD is on Wednesday.
It is possible that before this there will be no great movements and one should not enter into trades without grounds!
It is important that all positions must have a stop and lower risk before the news!

End of corrective wave of difficulty SHi everyone. I am posting after a long time.
For over a week, BTC has not given a clear direction to go long or short.
But six hours ago there was a chart pattern that started showing up to me moving, which is a corrective wave consisting of a running flat of 3-3-5.
From a running flat perspective, we will continue to maintain an upside view until the price moves further below today's low of $22,500.
thank you.
