Potential rise for goldThe impulsive wave is bullish and a correction pattern. We expect another bullish impulsive wave
Correction

Amazon Stock Analysis: Navigating the Path Between E-Commerce
Amazon Stock Analysis: Navigating the Path Between E-Commerce Strength and Market Volatility
Introduction
Hello, traders and investors! It’s Denis Mikheev from TheWaved™, here to deliver an in-depth analysis of Amazon’s stock (NASDAQ: AMZN). With the help of our premium tools and techniques, we’re diving deep into technical, VSA, and fundamental analysis to uncover the best strategies for the upcoming market movements. Let’s break down what’s happening with AMZN and set clear targets for trading this powerhouse of e-commerce.
Recent Performance and Market Context
Amazon’s current price sits at $219.27, with a noticeable decline from its 2024 absolute high of $233. This 5.89% drop aligns with recent sell-offs driven by macroeconomic headwinds and profit-taking from the December highs.
The stock is trading in a consolidation phase, sitting between strong support zones at $214.99 and $209.11 and resistance levels at $223 and $228. With the broader NASDAQ index displaying mixed momentum, Amazon remains a critical stock to watch.
Support Levels:
-
1. 214.99
2. 209.11
3. 198.78
4. 182.62
5. 177.95
Resistance Levels:
-
1. 214.99
2. 209.11
3. 198.78
4. 182.62
5. 177.95
Powerful Resistance Levels:
-
1. 180.095
2. 151.49
3. 116.04
4. 87.57
Technical Analysis: Key Levels and Trends
Support Levels: 214.99, 209.11, 198.78
Resistance Levels: 223.00, 228.00, 233.00
Key Moving Averages:
- MA50 (Hourly): 220.01
- MA200 (Hourly): 223.16
RSI Insights: The RSI-14 currently reads 52.91, indicating a neutral market condition but leaning towards bullish potential on strong volume signals.
These technical indicators suggest price consolidation, but with bullish potential as the RSI edges upward and MA200 looms as a key dynamic resistance level.
Volume Spread Analysis (VSA): Detecting Market Intentions
Analyzing VSA patterns from recent trading sessions reveals mixed signals. A notable “Buy Volumes Take Over” pattern on January 10 suggested short-term buying strength, but was quickly followed by a reversal due to increased sell volumes. This signals that smart money may be accumulating positions before a larger move.
Price Action and Patterns
On January 6, a strong “Buy Volumes Max” pattern indicated bullish intentions, but resistance at $228.23 capped further growth.
On January 7, a “VSA Sell Pattern 3rd” hinted at a bearish reversal, driving prices back to support levels.
Key takeaway: The interaction between support at $214.99 and resistance at $223 will be pivotal in determining the next directional breakout.
Fundamental Factors to Watch
Amazon’s fundamentals remain strong, with steady revenue growth driven by AWS (cloud services) and robust e-commerce performance during the holiday season. However, rising interest rates and inflationary pressures continue to dampen consumer spending and could act as a headwind.
Trading Plan: Targets and Stop-Loss Levels
Based on the current setup, here’s a practical trading roadmap:
Short-Term Bullish Scenario:
Entry: Above $223 after confirmation of a breakout.
Targets: $228, $233.
Stop-Loss: $220.
Bearish Alternative:
Entry: Below $214 with strong bearish candles.
Targets: $209, $198.78.
Stop-Loss: $217.
Forecast: Where Are We Headed?
In the short term, Amazon is poised for a potential bullish breakout if it clears resistance at $223. However, caution is warranted if macroeconomic conditions shift. Our long-term view remains cautiously optimistic, with a forecast targeting $240+ by Q2 2025 as the broader market stabilizes.
Conclusion and Call to Action
This analysis is powered by TheWaved™, utilizing advanced tools and methodologies. If you have any questions or want a deeper dive into our methods, feel free to reach out via direct messages. Remember, all the professional indicators and insights are available in the profile header. Follow for more ideas, and let’s trade smarter, not harder!
Concept of Rays
Explanation of the "Rays from the Beginning of Movement" Concept
Core Idea
My proprietary analysis method is based on using rays constructed on Fibonacci mathematical and geometric principles. These rays create a system of dynamic levels that help predict precise asset movements and identify key zones where price interactions occur. Price interaction with these rays signals probable scenarios: either a reversal or a continuation of movement, but only after interaction and the appearance of dynamic factors and patterns.
Why Predicting Specific Levels is Not Possible
Financial markets are nonlinear systems, where price movement is determined by numerous variables, including market volumes, liquidity, macroeconomic factors, and participant psychology. Instead of attempting to predict specific levels, I propose analyzing probabilities of price reaction at pre-calculated key zones. Price interaction with rays provides additional insights into the direction and strength of movement.
Stay sharp, trade safe, and may the markets favor your strategy!

Tesla Is Driving Bitcoin Price HigherWe talked about a strong positive correlation between Tesla and Bitcoin in the past and now that Tesla is extending strongly higher, Bitcoin is following, of course. Both of them slowed down recently, but notice that Tesla made only a three-wave ABC corrective decline in wave (4) that can now resume its bullish trend for wave (5), so Bitcoin could follow sooner or later.
Basic Impulsive Bullish Pattern should be made by five waves. It shows that Tesla and Bitcoin could be trading in wave (4) correction before a continuation higher for wave (5).

Bitcoin long awaited correctionIf you look at previous years, January has always been bearish. January 2025 is no different. After a long bull run since the latest halving Bitcoin required a correction to gain more liquidity and shake out margin longs. After that it should follow somewhat similar continuation pattern.
Long term prediction stays the same

JP Morgan (JPM): Correction on the HorizonJP Morgan ( NYSE:JPM ) is back on our radar as the upcoming earnings season begins, with the banking sector leading the reports. We’ve analyzed JP Morgan before, and the current setup offers intriguing opportunities. Since 2023, the stock has maintained a steady upward trend that continues into 2024.
Currently, NYSE:JPM appears to be in sub-wave ((iii)) within the larger wave (3) or possibly wave 5. However, we anticipate that sub-wave ((iv)) correction is yet to occur, aligning with the broader structural narrative of the chart.
Presently, the stock is trading near a critical trendline originating from the top of sub-wave ((i)). This trendline, which has shifted from resistance to support after multiple touchpoints, now risks being broken. Should it fail, the price could fall from its current level of $243 into a range between $204 and $173. A drop to $173 would represent the maximum correction in our view, while a more realistic pullback would fall within the $204 to $188 range.
On the bullish side, the wave 5 could push up to approximately $260, a modest increase from the current price. This scenario fits within the Elliott Wave framework, anticipating a wave ((iv)) correction before the final upward moves to complete wave 5 and the larger wave (3).

"Market Corrections Ahead of the Presidential Inauguration."Corrections are a part of the stock market, signaling moments of weakness and opportunity. Here's a breakdown of the current market decline levels, ranging from the recent 5% pullback to the potential 20% drop that defines a bear market. These are the levels that I will be watching to let me know the momentum of this current shorter term downtrend.
Historical Context:
Over the past 50 years:
5-10% declines occur about 3-4 times per year on average.
10-20% corrections happen roughly every 2-3 years.
Full bear markets (20%+ declines) are rarer but significant, averaging one every 6-8 years.
This chart visualizes the current levels, helping traders and investors understand where we stand in historical context and where the market could potentially head.
Always remember that as hard as some corrections and declines can be, they all create buying opportunities for long term investors.

PLTR: Will have to retest new supportWe have certainly over extended (I'm proud to say as a PLTR investor who has remained in the stock since IPO).
Let us be reasonable in the short term, and look forward to a potential correction/buying opportunity.
If you're long but have been hesitant about acquiring some shares, we all may have the opportunity to load up.
Now that $45 has been breached, there hasn't yet been a clear retest of that price range which is now support.
I feel as though the overall market will continue to look for reasons to sell in the short term -- which should be healthy going forward.
This wouldn't only apply to $NASDAQ:PLTR. The entire market will be on sale.
Don't be scurred!
I love you, and good luck.

Crude oil Is Approaching ResistanceCrude oil is coming higher on 4h time frame, out of a wave B bullish triangle that we have been tracking through December. Well, we know that moves out of a triangle are final in a sequence, so we can expect limited upside, and ideally, this will cause the completion of wave E rally of a larger bearish triangle pattern. It's now approaching an important resistance at 74-75, its gap from mid-October, right at the upper side of a triangle. There is a chance for a turn soon.
A triangle appears to reflect a balance of forces, causing a sideways movement that is usually associated with decreasing volume and volatility. The triangle pattern contains five overlapping waves that subdivide 3-3-3-3-3 and are labeled A-B-C-D-E. It’s a region of horizontal price movement, a consolidation of a prior move, and it is composed of “threes.” That means each of the A-B-C-D-E waves have three subwaves. The triangle pattern is generally categorized as a continuation pattern, meaning that after the pattern completes, it’s assumed that the price will continue in the trend direction it was moving before the pattern appeared. However, triangles also indicate that the final leg is coming before a reversal and that’s why triangles are labeled in wave B, wave X or wave 4.

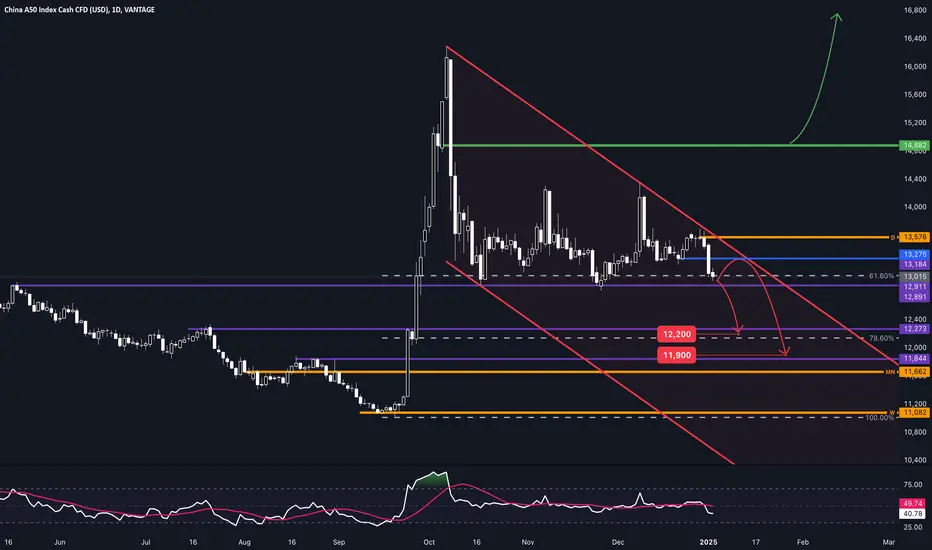
CHINA50 // deep into the correctionAfter a huge impulse that turned the monthly chart long, the countertrend is valid on the weekly and the daily.
As long as this daily short countertrend is valid, the next targets are the correction fibo levels and the weekly breakouts.
The primary long trend resumes above the last clean daily breakdown (green).
———
Orange lines represent impulse bases on major timeframes, signaling the direction and validity of the prevailing trend by acting as key levels where significant momentum originated.
Level colors:
Daily - blue
Weekly - purple
Monthly - magenta
H4 - aqua
Long trigger - green
Short trigger - red
———
Stay grounded, stay present. 🏄🏼♂️
<<please boost 🚀 if you enjoy💚
Elliot Wave Analysis -DOW JONES IND. AVG. (1932-2026)We have done a Loooooooong Term Elliot Wave Analysis starting from 1932 and maybe ending in 2026(or perhaps 2027).
If you see the chart in Normal scale, its parabolically going right up, and these type of moves are really bad for the market. So I have just tried to analyze the waves and hope it might help you to exit the markets at the right time.
Sayo Nara.................

Bitcoin Elliott Wave Signals Potential Corrective Phase TargetsLooking at the recent BINANCE:BTCUSDT chart through the lens of Elliott Wave Theory, we can observe a clear and compelling price structure. The market has completed a textbook Impulse Wave pattern (1-5), with Wave 5 reaching a notable peak around 109,000 USDT. This aligns perfectly with Elliott Wave principles, where Wave 5 typically extends beyond the peak of Wave 3, which is exactly what we witnessed.
The market has now transitioned into a Corrective Wave pattern (A-B-C). We've already witnessed the completion of Wave A's downward movement, followed by Wave B's characteristic short-term rebound. Currently, price action suggests we're in Wave C, which traditionally implies further downside potential.
Particularly noteworthy are the three projected target levels for Wave C:
87,847 USDT
82,270 USDT
66,149 USDT
These targets align beautifully with Fibonacci retracement levels, a tool that consistently demonstrates remarkable synergy with Elliott Wave Theory. The lowest target at 66,149 USDT could represent a significant base formation, especially if selling pressure intensifies in response to market conditions.
The chart's notation of "Wave(C) OnSet" is significant, indicating we're entering the initial phase of Wave C. This wave could potentially extend to any of the three target levels in the near term. As the price approaches these projected levels, we might see the emergence of a new bullish cycle.
I anticipate that if the BTC price drops below 90k, the significance of the Corrective wave (C) across all three levels will become even more pronounced. This could indicate substantial selling pressure, making any potential recovery in the upcoming period more challenging.
However, prudent analysis requires careful attention to support level confirmations and corresponding trading volumes at each target. In practical trading scenarios, price movement doesn't always reach the lowest projected targets. Wave C might be truncated, or conversely, could extend beyond our projections. This underscores the importance of incorporating additional technical analysis tools to form a comprehensive trading strategy.
This wave structure presents an intriguing setup, and it will be fascinating to observe how price action develops in relation to these projections. Remember that successful trading requires a holistic approach, combining wave analysis with other technical indicators and careful risk management.

MAGIC EDEN BULLISHNASDAQ:ME MAGIC EDEN ON SOLANA
i think we are going to the moon
anything under 5$ is solid DCA NFA also $4 soon then maybe 10$

ETHEREUM (ETH) // The daily structure broke with one impulse, and the correction of this impulse couldn't change to a primary trend expansion.
Yet...
This is the daily chart with the structure break:
If is stays like this (so, the new daily impulse base will stand), and the waves start to build south, the short countertrend's expansion phase will be a nice opportunity to ride the corrective impulse down to the correction fibo 38.2.
If this daily impulse base is taken back by the buyers (on the daily), the primary long trend resumes.
———
We may not know what will happen, but we can prepare ourselves to respond effectively to whatever unfolds.
Stay grounded, stay present. 🏄🏼♂️
Your comments and support are appreciated! 👊🏼

EIGEN TREND CORRCTION CHANNEL (UPDATE)so in the analysis i made few days ago (or yesterday idk) on BINANCE:EIGENUSDT we we had a channel that wad broken from below and you could"ve opened your position from the channel brakeout or the grenn line i specified though to be honest channel brakeout candle was too big only time frame you could have opened postion was 15 and in my opinion it was too risky with current status of the market but with the green line it was a lot safer to open your position and even better and smaller SL if you managed to open a position on BINANCE:EIGENUSDT i would suggest to close it fully or saving your profits yeah that"s IT i would really be thankful of any of you that supports me if the support is enough i would be more productive thanks to all of you 😘

Crude Oil Outlook: Key Levels Shape the Path AheadHello Traders,
Trust you are doing great.
Please take some moment to go through my analysis of USOIL and share your thoughts.
Overview
USOIL is currently trading at 70.08, with mixed trends across timeframes. On the H4 chart, the pair remains bullish, recovering from a recent correction. Meanwhile, the H1 chart shows a bearish trend in a corrective phase, with resistance emerging in the 70.19–70.90 region.
Idea
An impulsive rally from 67.045 on December 5th corrected to the 0.5 Fibonacci retracement level at 68.78 on December 13th, where support was established. This led to a bounce toward 70.19-70.21, which now acts as resistance.
If this resistance holds, a downward move is expected, targeting 67.70 and 67.08, areas where a bullish bounce may likely occur. The short-term bias remains bearish unless price breaches the Friday high of 71.38, which would shift focus to the 71.66–72.21 zone as a potential turning point.
Conclusion
In the short term, the bearish outlook is dominant, with 71.38 as the key invalidation level and a stop-loss reference. A break below 69.65 would add confidence to the bearish scenario, while any move above 71.38 could signal further upside, targeting the 71.66–72.21 zone for a potential reversal.
Cheers! Merry Christmas and Happy New Year in advance.

BTCUSD - Missed TP ? that's okay history says 140KI followed too blindly this fractal that went almost perfect but was waiting 120k to take partial profits and missed a 30% opportunity,
I'll know take profits more often by moving from risky alts to BTC or other assets resistant to drawdown
the middle line of the channel BTC is evolving seems to support very well and I'm gonna assume the correction is already over, you can still expect to see another dip to 86k tho (but I dont believe this)
my simple trade idea : green is path of 4 years ago, blue is path of last year
first TP will be at 120k & 144K see you in 3 weeks
not financial advice
cheers

Gold - Prepare For A Devastating Drop!Gold ( TVC:GOLD ) will create a massive correction:
Click chart above to see the detailed analysis👆🏻
Gold rallied more than +70% over the past couple of months, basically without showing any real correction. Therefore it is no surprise that after retesting the channel resistance, Gold is now showing some weakness. It is quite likely that this is just the beginning of a significant drop.
Levels to watch: $2.000
Keep your long term vision,
Philip (BasicTrading)

DAX // correction of the correction - neutralThe market turned south on H4 from the all-time highs and the H1 target fibo 138.2.
As long as this short H4 countertrend is valid (the market is below the H4 impulse base), I'm waiting for a bearish H1 countertrend break to target again the correction fibo 23.6
The daily impulse base is in the way, so the trade has to be managed there - it may be a target or a scale-in opportunity.
Of course, I'l try to publish how I pull my trigger line as the H1 countertrend develops.
For me, long only above the highest clear breakdown (green).
———
Trading is just waiting "sometimes", but opportunities are endless, so why not wait for the right moment!🏄🏼♂️
We may not know what will happen, but we can prepare ourselves to respond effectively to whatever unfolds.
Stay grounded, stay present. 🏄🏼♂️
Your comments and support are appreciated! 👊🏼

Bitcoin can make small move up and then drop to support lineHello traders, I want share with you my opinion about Bitcoin. Looking at the chart, we can see how the price a few moments ago started to decline and fell to the buyer zone, breaking the support level, where it some time traded. Later it tried to grow, but failed and quickly fell back to the buyer zone, after which made a strong upward impulse, breaking 95500 with 102200 levels. Next, the price grew more and then dropped to 90500 points, after which backed up and started to trades inside the triangle pattern. In this pattern, BTC almost rose to its current support level and then started to decline. In a short time, the price fell to the 95500 support level, and even lower, to support line of the triangle, which is coincided with the buyer zone. Then BTC bounced up and rose to the 102200 level, after which made little correction and then continued to move up. Some time later, the price reached the 102200 level again, broke it and now BTC trades inside the support area, very close to the resistance line of the triangle. So, for this case, I think BTC can make a small movement up and then continue to fall to the support line of the triangle pattern, breaking the support level. That's why I set my TP at 98900 points, which coincided with this line. Please share this idea with your friends and click Boost 🚀

Silver May Face More Weakness After A Corrective RallySilver is making sharp reversal down from recent highs, even breaking a lower trendline support of an ending diagonal which is an important indication for a top in place. As such, we are aware of much lower prices, maybe even back to the start of a diagonal at around 27/28 as drop from 4h time frame has an impulsive bearish structure into wave A/1.
But we see some bounce now that can be an A-B-C irregular/expanded flat correction into wave B/2, where subwave (C) can be now in progress. Resistance is then around 31.60-33 area, and from where we will have to be aware of further weakness within wave C or 3.

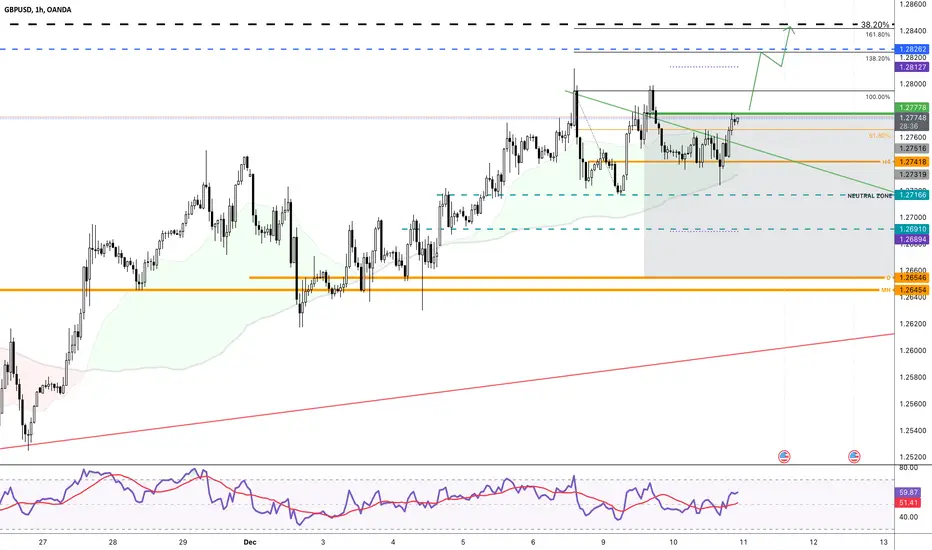
GBPUSD // Idea to Trade the CorrectionThe daily long countertrend is valid.
After testing an H4 breakout, the market is in neutral zone, right at the highest clear breakdown (green - long trigger zone).
The target is the 38.2 correction fibo level.
The countertrend line is drawn on H4 closing prices.
———
Stay grounded, stay present. 🏄🏼♂️
Your comments, questions, and support are greatly appreciated! 👊🏼
DAX // Trading the CountertrendThere is a trigger level (red) at the last H1 breakout on M15 with waves already down.
If it is trigger on M15, the target is the correction fibo 23.6, see the linked video for further analysis.
———
Stay grounded, stay present. 🏄🏼♂️
Your comments, questions, and support are greatly appreciated! 👊🏼

ETHEREUM - BULLISH AFEthereum: A Technical Masterpiece with a Psychological Challenge
Ethereum's price action showcases remarkable technical precision. However, the real test lies in managing emotions: impatience and impulsive decisions often lead traders to quick losses.
📈 Projection:
Expect a steady climb toward $4,300 until around December 17–18. At that point, a correction of -15% to -30% is likely, though the exact scale will depend on market conditions.
📅 Key Date:
By December 23, ensure your positions are set. As the market evolves, navigating increased difficulty will require discipline—this phase is not for the unprepared.
📊 Comparison:
The current price movement mirrors Ethereum’s 2020 trend, proving that while history doesn’t repeat, it often rhymes.
⚠️ Plan Ahead:
Approach the market with a clear strategy. Maintain well-defined entry and exit plans, and avoid emotional decision-making. Recklessness has no place here.
🚀 Looking Ahead:
January promises explosive growth, likely peaking around mid-month. This period demands focus and resilience—those who stay disciplined stand to benefit the most.
💡 Takeaway:
Ethereum’s journey is more than just price action; it’s a test of patience and strategy. Stick to your plan, trust the process, and let the market work for you.
💼 Upcoming Trade:
I’m about to open a new trade, which I’ll share with you here—just like the one I posted at $3,100. Now’s the time to make money and stay laser-focused. Don’t hesitate to follow me and keep an eye out for updates!
Stay sharp, stay grounded, and may the odds be in your favor.
God bless you.
—Jay
