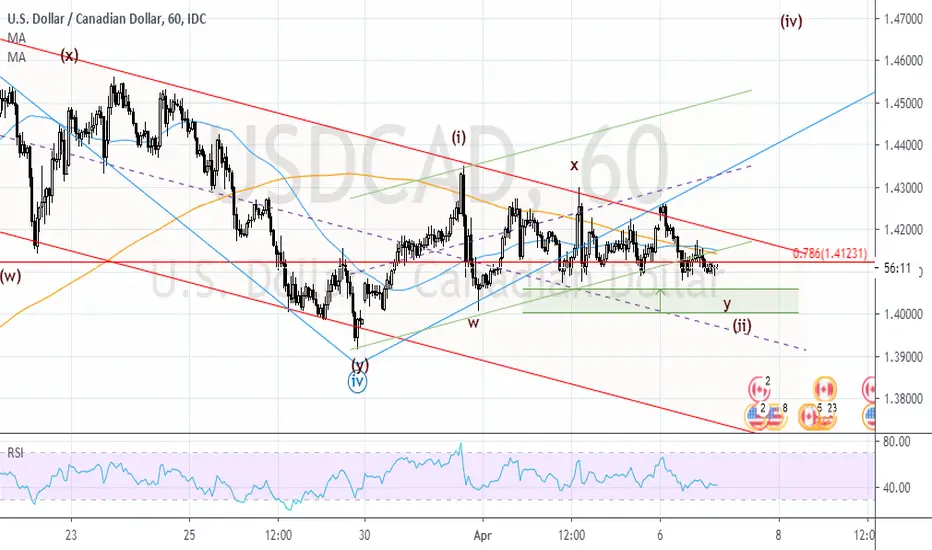
Low probability but high RRThis two ingredients balance is one of the key of success. I don't prefer to high RR, but sometimes I taste it.
So the moving from wave (i) absolutely corrective. I have been waiting for wave (ii) will be completed patiently. Next move should be upside beside USDCAD mustn't move below 1.3915!!! At the support zone, the correction has to end! For me, the target is above 1.5
We will see
Correctivestructure

#AUDUSD - Long opportunityCurrently, the price looks to be forming correctively
Waiting for a signal to go long.. but if price surpasses the 61.8% on the fib then it will become invalid


WTI Oil, H4 - possible wave CThe recent sharp upward movement on the oil market caused by Donald Trump’s tweets looks like a possible wave C in a larger corrective movement. Previously the price of crude oil has reached the new low and has created a potential wave B which consists of three waves down. Before wave B we may spot a nice sharp rally which could be labeled as wave A. Currently the wave C may have been created. The potential resistance may be located at the wave A top near 28,20 USD.
________
Daniel Kostecki, Chief Analyst Conotoxia Ltd.
Materials, analysis and opinions contained, referenced or provided herein are intended solely for informational and educational purposes. Personal opinion of the author does not represent and should not be constructed as a statement or an investment advice made by Conotoxia Ltd. All indiscriminate reliance on illustrative or informational materials may lead to losses. Past performance is not a reliable indicator of future results.
66% of retail investor accounts lose money when trading CFDs with this provider. You should consider whether you understand how CFDs work and whether you can afford to take the high risk of losing your money.

#USDCAD - Smaller TF - ShortWaiting for a break of this corrective structure will then be entering a short position
We have had a test of a weekly resistance and have moved below the structure
Currently correcting from an impulsive move to the downside

W-X-Y Correction Predicts a BTC Bottom On June 29, 2020
Type Of Correction: The main difference between a regular A-B-C correction and a W-X-Y is the sub-wave count. While the A-B-C formation often has a 5-3-5 or 3-3-5 wave count, every wave in the W-X-Y correction consists of three sub-waves, amounting to a 3-3-3 correction. Since the W and Y waves often have the same length, this correction could end in June 29, 2020.
Possible Bottom : The decrease from the top of the W wave to the top of the X wave was 37.41%. It would make sense for the decrease from the bottom of the W wave to the bottom of the Y wave to be similar since the W and Y waves often have the same length, giving a low of $2200.
Future Movement: : It seems that the price is in the C sub-wave of the larger Y wave. This is expected to be an extended wave, similar to the C sub-wave of the W wave.
Please leave a LIKE & COMMENT to support my future analyses.

CADJPY BUYBuy Cadjpy after correction breakout. Targe is weekly R1. it will be better to buy after the breakout. Add more buy if it makes more correction before the target.
Hit like for support and follow for many more upcoming accurate pips.


USDCHF Can Be Finishing A Big Bullish TriangleHello traders! Today we will talk about USDCHF in which we see an interesting wave structure.
USDCHF is trading in a big sideways range since 2015 and more and more looks like a big bullish triangle formation in wave (B) that can be approaching the end soon, ideally this year in 2020. We see it actually in the final stages of subwave E of (B), which is clearly falling in a corrective structure with three waves a-b-c, so if that's the case, then downside should be limited.
Well, if USDCHF finds the support and bounces in an impulsive manner here around the corrective channel support line and lower red triangle line, then we can start considering bullish scenarios, but keep in mind that only an impulsive rally back to 1.00 – 1.02 levels and decisive break above the triangle line can be a confirmation for a completed bullish triangle that can send the price even much much higher towards 1.10 – 1.15 area.
Be humble and trade smart.
If you like what we do, then please support us with a like.
Disclosure: Please be informed that information we provide is NOT a trading recommendation or investment advice. All of our work is for educational purposes only.

#EURAUD - Long Term SHORTThis could be a long term outcome for EA
There has been a lot of talk of Australia facing a recession so if that happens then I can't see it happening
We will see in the very near future

Brazil's Ibovespa Soon To Enter Grand Supercycle Wave 3With the recent plunge in the international markets, Brazils Ibovespa is soon to reach Wave 2 bottoming territory and should stage Grand Supercycle Wave 3 next.
Com a recente queda nos mercados internacionais, o Ibovespa deve em breve chegar no território de fundo de onda 2(Grande Superciclo) e em seguida encenar a onda 3 de Grande Superciclo
Suporte fortíssimo no fundo da onda II da (V)

DOW JONES LONG & SHORTExpecting a new record high for major equity markets(DJI , SPX , etc.) till september-october '19.
After that another deep correction may follow that highs before the new economic expansion phase.
I believe the worst is already behind , bottom was formed in 2018.
TP for Longs : 28.000-29.000
Correction Deep Target : 23.000-24.000
Good Luck.


AUD/USD short !!!!Hi Traders lastly we have AUD/USD. On this pair you can see we are currently in a downtrend ,predicting this market will keep going down ,the Aussie economy heavily rely on China and with this virus going around I don’t see any reversals yet. So any pullback in this pair ,preferably come back to retest broken support in this case(0.67420) we’ll be looking for bearish patterns and formations. And if we get the right bearish setups in this market we’ll be looking at shorting this pair to the downside target (0.6604)
Give as a like and follow for more
Good luck traders!!!!

GBPUSD - Short #Forex #ForexAnalysisI see the £ really struggling with still no certainty that Britain will leave the EU with a trade deal in place.
I personally think they wont leave with a deal and i see nothing but bad news for the £
I know it seems a bit far fetched to predict the £ to fal this far and maybe it will fall to last years lows and maybe it wont but time will tell
Any questions feel free to ask

EW Analysis: Bitcoin Can Be Bullish Confirmed NowHello traders.
Today we will talk about Bitcoin from the Elliott Wave perspective.
After that strong and impulsive rise in the first half of 2019, BTCUSD has slowed down in the second part of 2019, but clearly with slow and complex W-X-Y corrective structure that can be also finished with an ending diagonal (wedge pattern) in wave Y, which is actually a powerful pattern and it usually indicates sharp and impulsive reversal.
Not only this, we actually got a five-wave bullish reversal, which in EW theory signalizes a potential bottom at 6400 level, at least a temporary one. But, after every five waves, a three-wave a-b-c pullback follows, ideally into a higher degree wave B/2. So, before a continuation higher within wave C/3, we should be aware of a slow down into a correction, where ideal support would be between 8200 - 7700 levels.
All that being said, we believe that Crypto market is turning bullish, mostly because of strong and impulsive five-wave rally from the previous lows. Even some ALTcoins made nice and clear five-wave rise, so those Cryptos can easily see more upside, just be aware of a deeper three-wave a-b-c corrective decline soon before the uptrend resumes.
Be humble and trade smart!
If you like what we do, then please like and share our ideas.
Disclosure: Please be informed that information we provide is NOT a trading recommendation or investment advice. All of our work is for educational purposes only.

GBPUSD (3 WAVE CORRECTION)There is possibility to go LONG from the current price upto to the level of 1.3280,
then SHORT upto 1.2780.
Note: Everything works with Best money management.
Note: Please leave comments for any query.
Disclaimer: Trade at your own risk.
Good Luck...!!
Regards

4H NZDUSD Elliott Wave CountLet's count waves.
Do you see the same potential upside for this pair?
I am a beginner in Elliott Wave Analysis and this is my sentiment.
The minor impulsive wave in RED has been completed and corrected via an ABC structure with 5-3-5 sub-waves.
The parallel lines connecting the end of wave B and the end of wave A usually forecast the end of wave C as shown.
Price is currently at a key level marked in the red rectangle which has shown to be resistance and in the past was support level.
Finally, the RSI indicator is currently at 31.20 as I type this and signifies that the price is oversold.
Comments, critiques, and anything else is accepted.

NZDCAD POSSIBLE SELL The price bounce from a downtrend and a resistance zone, broked a up counter trend, and right now is making a corrective structure on the 4H timeframe. to go short i would like to see a 4H candle close below mentioned zone (Red Zone)
To the full analysis, educational content and quality signals contact us on
Telegram: @FedericoGallo - @MrFlawlezz
Instagram: @Forex_society

GBPAUD - ShortStrongly believe that the £ is going to have another major crash
Causes...
-Brexit (No Deal)
-Recession

NZDCHF - ShortMay take a while to set up but the overall bias is short, waiting for the corrective wave to finish and then waiting for a big short to the downside.
Two possible entry points, dont be surprised if its the 2nd one to catch people on the wrong side of the market

ORBEX: USDCAD Triangle Pattern More Likely Now!The USDCAD triangle pattern seems to be taking its final form, suggesting a marginal upside move before continuing longer to support the longer-term trend.
A successful test near the price/trendline intersection could offer a nice risk/reward medium-term opportunity.
Trade safe
Stavros Tousios
Head of Investment Research
Orbex
This analysis is provided as general market commentary and does not constitute investment advice
