AUD/JPY Expanded flat? Running flat? Breaking down structure Hmmm as I progress understanding of wave theory, I like to look at the charts differently and expect the unexpected. This to me appears as a "expanded flat" I've quit trading the animals because Ive realized the importance of wave structure! Have a great weekend!
Correctivestructure

CAD/JPY Corrective Structure! Breaking it down! We appear to be forming a continued bullish corrective structure! This is based upon my current understanding of EW Principle. Thanks for checking it out! Show me some love, and what you were thinking ;)

ANALYSIS ON GOLD - 1H CHARTHey guys,
I pretty much shared all the info in "callouts".
The trade I am looking for is the big sell towards to the low of the main structure.
However, if we get a new red move up I will trade it as well.
Carlos

Elliott Wave & Harmonics OutlookAfter a strong impulsive bearish wave 3 , A Flat WXY Side Way Wave 4 is formed which is 3,3,5 in its internal structure
Currently , The final impulsive bearish wave 5 is about to be triggered on the breakdown of the bullish green channel ,
Also , from Harmonic Pattern Point of view , there is an ideal Inverse AB=CD shown by the green a,b,c labels in circles

USDCHF - Quick long playEven though the HTF is pretty volatile I see a good opportunity for a quick long play on this pair. Price has just broken out to the upside of a corrective structure. Looking to enter on a weak pullback into support (top of structure) with first target around 1.0080 and if that resistance folds, extended target would be 1.0100.

GBPUSD - Interesting PA at range lowEven though we are in a bigger range, price is consolidating at the bottom, indicating a possible breakout to the downside.
I would not take the breakout itself since chances are good it will result in a false one. But if we get a retracement to the upper part of the corrective structure I'd look to go short with first target around 1.2450. If we break that support, extended target for me would be 1.24160.

Long-term Irregular Corrective Wave Structure Bearish Wave C is forming of an Irregular Corrective Wave Structure

Wait for the pullbackEURUSD has just broken its corrective structure and I am expecting to see price form an impulse to the downside. Wait for a corrective pattern before entering short. Good luck and safe trading

Simple flat corrective structure, bullish flag! as with all GBP pairs I believe we will have more upside before the downside. Trade responsibly! :D

AUDCAD Shorts Coming Up SoonPrice at the moment is correctively rising so what I am expecting to see of this pair is that price is going to fall soon. We are currently seeing divergence on our MACD which signals a reversal may happen. Good luck and safe trading.

BUY SET UP IN EURCAD - 1H CHARTHi traders,
Planing different trades this week! I see a nice buy set up in EURCAD
I think we have a clear structure in both 1H and 4H charts, looks like a triangle correction from a past impulse.
We had 4 moves already so the fifth move is likely to happen due to the formation of a flag.
If we trade the breaout of the flag we will have the chance of a 140 pip trade and a nice risk reward.
Carlos

BREAKOUT IN USDCHF - 2H CHARTHey Guys,
Pretty much like EURUSD. We have a corrective structure converging and it is definitely going to brake uptrend.
There is still a possibility of a last move down but my trade is the buy.
If it brakes structure and makes a flag...good time to buy!
Carlos

ABC PATTERN IN GBPUSD - 1HHey guys,
I have been posting charts on this pair but this is the last one I will post for Buys.
We are probably having an ABC structure after a sharp impulse. Maybe this ABC could turn into a more complex correction but by now I bet it is making a Flat ABC.
I am expecting it to brake the low and reverse somewhere between 1.2410 and 1.2339, then I will trade the move up, hopefully another sharp impulse.
If it makes a sharp impulse until 1.2839 we will complete the H4 three wave structure and I will start looking for sells.
Carlos

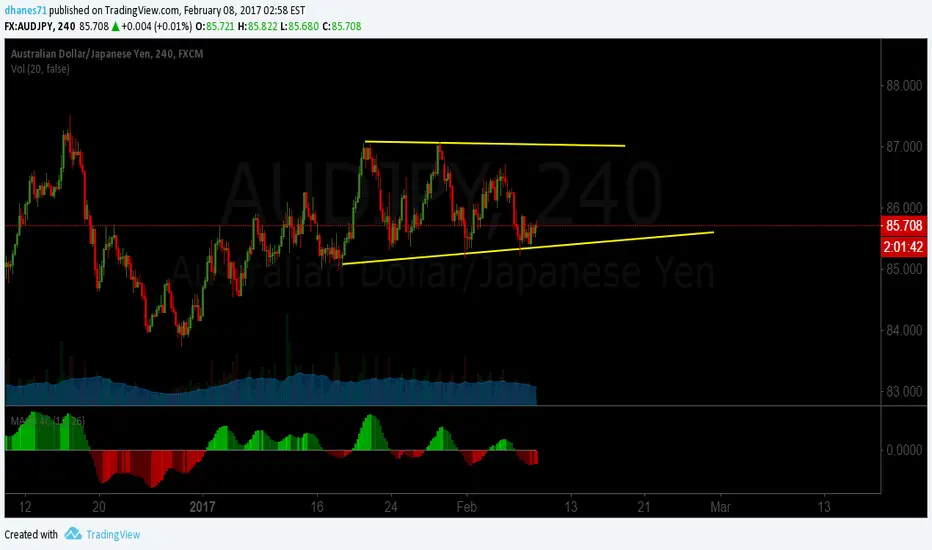
AUDJPY Still on a Corrective StructureAUDJPY is still on a corrective structure. Wait for a breakout before entering any position.
Could this be it? My understanding of Wave Principle! Could this be it for USD/CAD? Watch out for stop hunting if this is final move! What do you think traders? Leave some feedback! Thanks for looking!


Quick Short Trade on EURNZDHere on EURNZD we have a trade setup forming inside our corrective structure. This setup is only valid if price does not break out of the bigger corrective structure. Good luck to you all

GBPNZD - Looking for a quick play during London openLooking for a quick play during London open and a re-test of the lows in this corrective structure. Not shooting for any extended targets though since we are at a solid support level and have not had a healthy retracement on the 4 hour chart yet. Once we have that I think we will break through 1,7050 and see lower prices, down towards 1,6950 initially.


USDCAD WEEKLY OUTLOOK 6 -10 FEB 2017Hi Everyone, Yesterday we got better than expected job numbers, but there is no sign of USD strength. Major pairs are in complex corrective pattern on lower time frames, that is the reason we got some weakness.
Coming week what we can expect means, first two days of trading dollar strength. Remaining days weakness we can expect.
Usd.Cad move to resistance zone 1.3115 - 1.3144 on first two days of trading. we can enter short on this levels. weekly close i am expecting near to the this week close.

AUDJPY SELL SETUP @ 240 MINSHi Everyone, AUD.JPY enters deeply into the resistance zone. I am looking reversal @ 86.74 (top of the zone).

EURUSD SELL SETUP @ 60MINSHI Everyone, EUR.USD current price action not looking impressive to make new highs. I am expecting EUR.USD fell to 1.0652 before making new highs.

Bullish BatBuy the breakout of the blue resistance line
Sell in case of the breakdown of the blue support
Flat WXY Corrective structure is supposed to be in progress
