Broken Correlation Amazon/Alibaba, only an Evergrande thing?Alibaba is off the road...
looks like total crash, like Bayer after the Monsanto deal...
But Alibaba got no endless billion dollar legal proceedings!
Alibaba got a protected billionen chinese market plus a growing part of the world....
The problems with the allmighty Xi Jingping dont making so much noise...
The user data part is under political control, so the ecommerece part can go on
First thing I'm thinking about is the chinese real estate crisis.
But the correlation between Amazon and Alibaba disconnected in june... in My mind the Evergrande thing came to late.
Please let me hear your opinion... Im totaly new to this game. Its so amazing! :-D
Going Long, Its a temporary thing... Ali ist lower then march '20 and the world wont stop because of Evergrande or so...
Correlation

FTM - Strong PRZ worked as wellNow it's FTM after Bitcoin.
Wait for it (If Bitcoin get stable between 49,800 - 50,200)

BTC 180K-200K top in Q2-Q3 2022?Major trendline resistance was broken recently at 51k level.
We may be in a mid-cycle peak on to the way up to 180k-200k until ~Aug 2022.
Would still remain cautious atm as the traditional markets are undergoing a major 100 year-cycle correction that could drag $BTC with it.
But, there is a chance that every asset on the traditional market will get tokenized, possibly decoupling bitcoin from it from here on out.

US500 / BTC Strong Correlation & Bart Pattern in formationUS500 / BTC Strong Correlation & Bart Pattern in formation
Going down.

Correlation between OMGUSDT and RENUSDTWatch REN closely here price could follow behind OMG and breakout of this bullish flag consolidation to new highs.

JICPT|10Y Yield challenges 1.5% with crude oil up and NQ down! Hello everyone. The US 10Y yield formed a really big bullish candle on last Thursday, with Fed didn't take any action on tapering.
On the daily chart of the yield, we can clearly see that it firmly left the 1.3% bottom level. If it conquers 1.5% level, 1.7% and previous high would be retested then. The good economic outlook and inflation pressure is the main driver of the yield hike.
What's the impact of the rising yield? We all saw how market responded to the yield surge back in Feb. No wonder NQ got some pressure today. But I don't think NQ will be like that. Buy-the-dip strategy still works in my opinion.
What about crude oil? I'm bullish, though, the 77-75 bearish structure may take some time for buyers to retake.
What do you think? Give me a like if you're with my view.
Thank you for your support.

Nintendo Switch OLED, Buy Buy Bye OldieWith the release of the 2021 Nintendo OLED Switch, and the holiday season being right around the corner.
The release of the new switch is rumored to be in a few days.
Right in time for parents to begin researching new consoles for the HOLIDAYS.
The OLED display is a beautiful piece of engineering that will continue making Nintendo a leader in the Gaming industry.
I mean, i've only seen it compared to the old switch in VIDEOS. It's gorgeous. The white finish on the dock, the white joy-cons, the glossy innards.
The black blacks.
NTDOY gets a BUY BUY BUY from me! Not the mention the beautiful price of the stock!
Nintendo is going to be a BUY + GHOLD for me, as I have a little foresight on what might happen, which such a great company like Nintendo!
Although no numbers will be given, it's possible that Nintendo will be back in its $70+ Ticker Days.
OTC:NTDOY

UKOIL and GOLD correlation !!! TVC:UKOIL
OANDA:XAUUSD
Hi guys , how you doing ? I hope the bests for you all .
as we all know oil price have risen a lot recently as Europe and the world face energy problems and high demand for oil and also gold price has fallen sharply recently due to stronger dollar in the forex market on Monday ...
everything has became a little complicated for me
but now let's take a look at charts of oil and gold together and compare it .
as we can see in the chart , whenever that oil was in a downtrend , gold was starting it's uptrend so they move against , and now oil is kind of really high and in the other side the price of gold is in support zone of 1730 but if the price of oil keeps going higher to the resistance of $86 the gold will probably continue falling to support zone of $1678 which has been a really strong support in the past .
so this is my personal view about oil and gold , and also we need to wait for Federal Reserve to see what's gonna happen to dollar in the markets according to their decisions and speeches .
if the dollar will get stronger , then gold will continue falling to $1678 with a high possibility.
this is just a personal research and analysis and it's not a signal about buying or selling something .
I wish you all success and wellness .

US500 strong correlation, BTC dumpingUS500 strong correlation, BTC dumping
for more crypto trading strategies: bitcoinvsalts.com

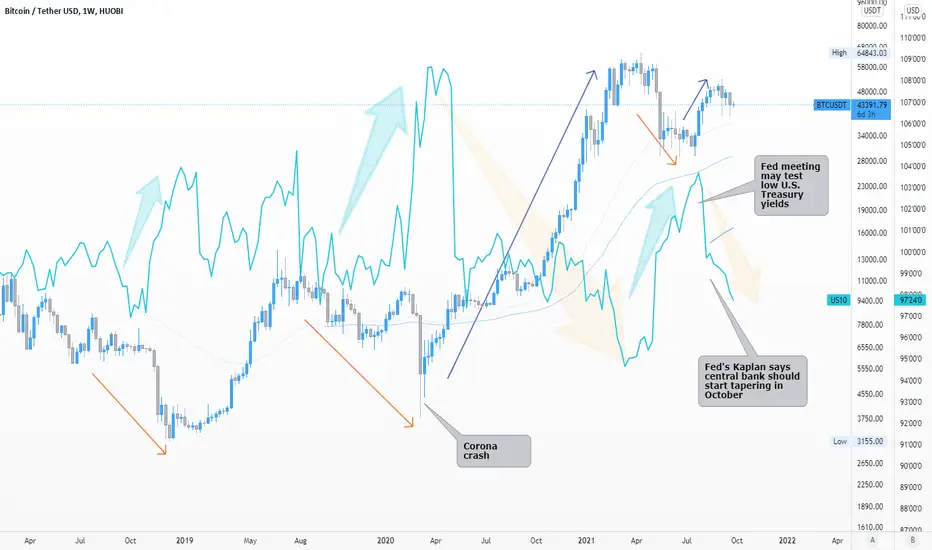
Bitcoin and US 10YR bond, negative correlation?Just have a small thought about the negative correlation between the U.S. Government 10YR bond and Bitcoin. do you see any correlation and what do you think for next month?
some useful links:
July 14, 2021
Fed's Powell says economy 'a ways off' from bond taper, inflation to ease
WASHINGTON, July 14 (Reuters) - The U.S. job market "is still a ways off" from the progress the Federal Reserve wants to see before reducing its support for the economy, while current high inflation will ease "in coming months," Fed Chair Jerome Powell said in remarks prepared for delivery at a congressional hearing on Wednesday.
www.reuters.com
July 26, 2021
Fed meeting may test low U.S. Treasury yields
CHICAGO, July 26 (Reuters) - The $22 trillion market for U.S. Treasury securities may get a reality check from the Federal Reserve this week following a plunge in interest rates that bucked expectations of higher yields this year as the economy rebounds from the COVID-19 pandemic.
Yields, which move inversely to prices, have been in a downward trend since the last Federal Open Market Committee meeting in June. The market initially perceived the Fed as being a bit hawkish as policymakers last month projected an accelerated timetable for rate hikes and opened discussions on ending crisis-era bond purchases amid a backdrop of rising inflation.
www.reuters.com
AUGUST 11, 2021
Fed's Kaplan says central bank should start tapering in October
WASHINGTON (Reuters) -The U.S. Federal Reserve should announce its timeline for beginning to reduce its massive bondholding next month and start tapering them in October, Dallas Federal Reserve President Robert Kaplan said on Wednesday.
www.reuters.com
September 23, 2021
Fed signals bond-buying taper coming 'soon,' rate hike next year
WASHINGTON, Sept 22 (Reuters) - The Federal Reserve said on Wednesday it will likely begin reducing its monthly bond purchases as soon as November and signaled interest rate increases may follow more quickly than expected as the U.S. central bank's turn from pandemic crisis policies gains momentum.
www.reuters.com
September 27, 2021
Fed's Evans: U.S. economy "close" to meeting bond taper threshold
Sept 27 (Reuters) - The U.S. economy is close to having met the Federal Reserve's bar for beginning to reduce its bond purchase program and will meet it soon if job gains continue, Chicago Fed President Charles Evans said on Monday, the latest policymaker to back the central bank's step away from pandemic-era crisis policies.
www.reuters.com
JICPT| BTC rebounding from strong holder zone as expected! Hello everyone. Yesterday, I published an idea titled 'Global market rattled by Evergrande's crisis', which I marked a strong holder zone around $40000 on BTC with long-term MA and flip structure . You can check the linked idea below for more information.
I was right about the zone which did serve as a strong holder. I can see price went deeply into the zone and rebounded from $40000 key level(whole number effects). The coming Thursday will be another important day as Evergrande will be required to pay back interest on its bond. The default is likely according to S&P and it might trigger another sell-off of the global risky assets. Personally, though, I don't think there is much room to go down for Bitcoin .
Please trade safe and mange your position well.

JICPT| Global market rattled by Evergrande CrisisHello everyone. It's not a happy Monday for bullish stock buyers. Actually, mainland China market is closed today for celebrating Mid Autumn festival. I was outside with families in another city and didn't have a plan to update anything, until I got a message from a colleague, saying that please check the market.
I'm not so keen to know what caused the market move, because what we should do matters the most. I guess the Evergrande crisis might be the major contributor of today's market crash, especially HK. It then quickly spread to other markets, e.g. Nikkei 225, Europe and US markets.
Firstly, let me brief the Evergrande crisis. Evergrande, a Fortune Global 500 group enterprise, is a top 3 real estate enterprise in China with more than 13000 projects through out the country. Its debt issues emerged in recent months with a severe cash liquidity problem of unable to pay back its $300 billion worth liabilities. The enterprise is listed in HK with market cap dropped by more than 70% so far this year.
I observed US dollar, Yen and Gold got supported from this as they normally are served as safe-heaven assets. For gold, as I previous mentioned in my posts it's likely to seek support from the 61.8% fib retracement.
I also noted that BTC has suffered a great loss toady by 7-8%. Looking at the chart, BTC acts more like a risky asset which has a negative correlation with the USD dollar index. However it dropped too much so there is another reason behind it. I don't know what it is but what I want to point it out is the risk management. Don't use high leverage to trade it. The high volatility will blow your account. The nearest firm support zone is around $40000 with long-term MA and flip structure.
In the end, financial markets are multi-dimensional and there is correlation between different assets. With more money poured into the 'quant' strategies, price movement of one thing will quickly impact another. Market will become more volatile. So stick to your rules, especially risk management. Stayer longer will make you become a winner !
Give me a like if you're with me. Thank you for your support.

HOW TO PROPERLY USE CORRELATION IN THE FOREX MARKETPlease not that this will work only when a trend has been established on at least 4h.
Please feel free to ask any question and let me know your thoughts.
Thank you

WHY BiTCOIN=TSLA or TSLA and BITCOIN is a "MUST"?! 18/9/21Since when BOTH and TESLA price are moving same direction?! .. Someone "Must" "Big Mouthing" them a lot.

How do you trade with Correlation?How do you trade with Correlation?
You can trade on forex pair correlations by identifying which currency pairs have a positive or negative correlation to each other. I have identified above the 3 main correlation pairs which correlate best with each other. In the conventional sense, you would open two of the same positions if the correlation was positive, or two opposing positions if the correlation was negative, for example when OIL increases in value, the Canadian Dollar tends to increase in value. This is because Canada is among the top 5 oil producing and exporting countries making them directly correlate.
CHF & GOLD Correlation
Both the Swiss Franc (CHF) and physical gold have acted as reserve 'currencies' thereby establishing a relationship between the gold price and Swiss Franc . Despite some differences, the Swiss Franc and the gold price are correlated and the similarities shared by the two can be clearly identified. This the Swiss National Bank has a huge amount of Gold Reserves and is one of the largest possessors of gold reserves worldwide. This also gives the Swiss Franc direct correlation with gold as the government passed a legislation that the Swiss Franc must be backed by gold .
Why is it important
Correlation is important when trading your strategy as you can manipulate the market and gain more confluences to confirm your entries. For example if you are focusing on the Canadian Dollar and can see a bullish trend and an entry point, OIL must also be bullish due to the correlation and you can confirm your analogy as you have analysed 2 correlating pairs which are both bullish .

JICPT| Gold failed the 3rd try with Treasury & DXY rise today!Hello everyone. Gold has suffered a $30+ loss today with US 10Y yield and the dollar index surge. Normally, gold has negative correlation with the two. especially the dollar index. Please refer to the below line chart.
On the daily chart, we can clearly see that gold failed to challenge previous high again located around 1832. Looking below, price is likely to seek the support in the zone of 1771-1782 .
What do you think? Give me a like if you're with me.

Euro Currency at KEY levelThe $Euro has stayed above the orange level, around $109, for a year. We have seen several tests of this level (shown by the purple arrows).
Why does it matter?
1. The US dollar has an inverse correlation with the Euro as well as Gold.
2. A strong US dollar negatively affects international equity (such as Europe and Emerging Markets).
3. A weak dollar generally creates a bullish scenario for commodities.
4. Gold has a slightly negative correlation to Bitcoin. Currently at -0.5

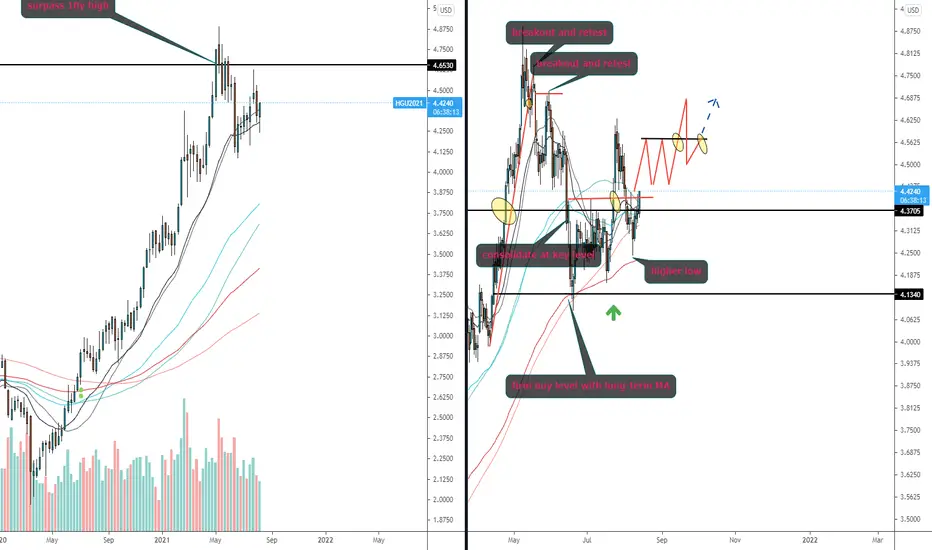
JICPT| Copper on the verge of another breakout again!Hello everyone. Copper is a leading indicator that I like to review from time to time. My previous breakout projection worked well. However, it fell back again formed a higher low, indicating strong momentum.
So, basically this is a momentum play. I also searched other clues as an odds enhancer. Below is the line chart of copper and Us 10Y yield. It clearly to see that the two has been in the same direction for sometime in general.
The reason behind this is the recovery of the economy. Though, supply and demand is another key factor impacting copper's price.
After the breakout, the nearest target is 4.63 . With the continuation of the economy recovery, I'm bullish on copper. The nerve zone for me is 4.7 and above.
What do you think? If you're with me, don't hesitate to give me a like.
Using Correlations to Predict Markets: Review & DiscussionSeveral months ago, I posted the original idea (see related) when I thought that markets were preparing for major asset rotation. Instead, it seems that we only got a preview of the real thing. Meaning, that Bitcoin had a major selloff right around the time of the first post, but it wasn't severe enough to drastically shift the major asset classes.
Right now, I feel a similar type of paradigm shift is coming, so I wanted to review some key points that I've gathered since monitoring this correlation study. The major takeaways are listed in the top part of the chart and the updates to what the correlations with Gold could mean for each asset class are shown in the bottom sections, respectively.
In my opinion, not much has changed regarding the future direction of the various asset types, with the exception of USD. I think that as of today, inflation will get its recognition as a potential destroyer of wealth and will lead to mass exodus from risk assets. The reasons for this are too many to include and are beyond the scope of this post. The main point of this is that I believe that due to the bizarre and artificial economic landscape painted by the Fed, that inflation will be viewed as a harbinger for risk assets, before it is considered an "invisible tax" on the USD, which would lead to broader questions concerning its purchasing power.
The reason for mentioning this inflation belief is that we find ourselves in a unique situation whereby there are only two main asset types that are "undervalued": 1) USD, 2) Gold. Ironically, these two things should be polar opposites; yet it is now undeniably true (based on recent correlation studies), that the two move in tandem when correlated, and have been such more often than not over the past several years.
Lastly, I would strongly recommend keeping tabs on USD/Gold corr going forward, since it can really help to find true direction when financial markets unravel.
-Pig/USD
TVC:GOLD
TVC:SPX
TVC:DXY
CURRENCYCOM:OIL_CRUDE
BITSTAMP:BTCUSD

SPX's Signals fans, DXT/SPX is giving mix signals 60% vs 40% !!!Using RSI weekly on DTX/SPX ONLY.
-If we go up, we go up "Now" like last week of July, 2021 by 7% - 21 % .
-If we go down 21-98 days from the signal's day
we will get 8% - 21 % correction/pullback
our window is 8.23-11.30 !!!

EURGBP SHORT POSITIONAccording to Strong Negative Correlation with GBPJPY we have short position potential with following TP/SL:
TP: 0.8521
SL: 0.8555
THE SIDE STRATEGY IS SO EASY AND POWERFUL
****Don't forget about money management****
****Avoid From FOMO****
Wish you Profit and success

JICPT| Gold rose as expected to opposing supply zone! Hello everyone. This is the update of my published idea titled 'Daily bullish setup of Gold(1790-1783)' on July 22nd. You can check the link below. The setup worked very well. It kissed the level of 1789 which is just below my recommended level. The risk is low and profit margin is high!
After that, price went sideways until FOMC statement released yesterday. The fed chair Powell reassured investors that rate hike won't happen soon. As the negative correlation of interest rate and gold, the upper boundary of the sideway zone gets violated firmly. The momentum is pretty strong that the price is now approaching opposite supply zone. You can see how gold, Nasdaq and US 10Y yield move in the below chart. I drew black lines to better show It quite useful.
I took the recent high as supply zone. Buyer should watch for the potential reversal risk. Once conquered, the next level is 1870 .
Give me a like if you're with me. Thank you for your support.

Scary BTC & ETH correlation may call for a Bear Market!Here I present a curious and scary correlation between Bitcoin ( gray line ) and Ethereum ( orange line ) tops indicating a possible extended bearish scenario ahead.
One chart on the left shows Bitcoin's 2017 top, followed by Ethereum's top ocurring 28 days latter. Last bear market has started after that.
The chart on the right has the current prices of Bitcoin and Ethereum, showing us the exact same 28 days appart from their recent tops...
This already confirms the money flow from Bitcoin to Ethereum (and possibly followed by other alts, starting an altseason - which we've actually had) that tends to happen in the end of a bull market. So this could potentially indicate the end of the current bullrun for crypto and the beginning of an antecipated Bear Market, considering it would be early based on Stock to Flow model. The news get even worse if added all the other bearish indicators we've had in the last weeks to support it.
Also worth mentioning, the trader's disbelief regarding this being the top of the 2021 bullrun may actually be a factor reinforcing this event, once history tells us most retail traders are usually wrong about tops and bottoms, and specially, trend reversals. Crypto twitter is full of "BUY THE DIP" kind of calls.
>> What's your opinion on the topic? Is crypto really done for a while? Or is it just a double-top bullrun? I'm looking forward to hearing from you in the comments.
*My previous idea "Bitcoin's mid-term analysis you should consider", linked below, offers a great perspective on the bearish indicators I've mentioned.
