Correlation between ON RRP and GoldHello Traders,
I hope you all are safe and good.
I wanted to show an interesting negative correlation between Fed's Overnight Reverse Repurchase Agreements and Gold Price.
You may also see a FRED GRAPH about that on below,
fred.stlouisfed.org
Question is ; Will there be much more weakness on Gold Price?
I guess we'll see that soon.
Share your ideas and comment below about that,
Have a good evening,
Stay safe.
Correlation

Bitfinex Margin Long ChangesBrainstorming
This is a back-of-the-envelop analysis of the correlation between Bitfinex margin long positions and BTC price. My intuition is that a more disciplined analysis of Bitfinex margin positions, crypto exchange flows, margin funding rates, and changes in something like the SPY ETF could yield a predictive model.
There appears to be some relationship between these two data series, but only when there is a large change in the Bitfinex margin positions. In 2021, generally, margin longs correlate with BTC price.
If margin longs were to decrease, BTC price would likely fall due to selling pressure.
Again, this is a back-of-the-envelop analysis. Broad market sentiment likely influences the Bitfinex long and short margin positions. So, the correlation will not be stable. Watching changes in the Bitfinex margin longs may help forecast BTC price... but this has not been proven in this analysis.
I do have a bearish bias at this time.
More to come as I continue to think about this. Thoughts? Comments?

Portfolio Optimization With BNBIs BNB correlated to other assets?
The average correlation ratio amongst cryptocurrencies stood at 0.72, a high value indicating a strong relationship between the returns of cryptoassets.Amongst ten of the largest marketcap cryptoasset, BNB was the least correlated asset displaying an average correlation of only 0.58.BNB displayed a medium positive correlation with other large cryptoassets: only 0.57 with BTC, 0.52 with XRP, 0.64 with LTC, and 0.63 with ETH. In comparison, BTC and ETH, the two largest cryptoassets, displayed a strong positive correlation(0.82).
Correlations with traditional financial assets
BNB appears to be a unique asset: not only is it uncorrelated with traditional financial assets, but it is also one of the lowest correlated assets with other cryptocurrencies.Hence, the next subsection focuses on the construction of model portfolios, including Bitcoin (BTC) and BNB, along with the backtesting of the performance of these portfolios.

DXY and EXY correlates negatively !! EUR/USD SHORTHy trader,
good mood and profitable trades ! 💲
In the 1h chart we can see a negative correlation between DXY and EXY.
While DXY broke out of the falling wedge with a nice kick, we saw EXY break out of the rising wedge.
In the Dollar index I see a nice bottom formation with HLs and a HH. In the Euro Index we can see a top formation with LLs and LH !
My trading plan for this week: EUR/USD SHORT
I would like to mention that all I post are just options and my own opinion !
Always trade with SL, and do not risk more than 1% of your portfolio (max 3%) per trade.
Unfortunately, my english is not so good and I work with google translate, but if you have any questions I will be happy to answer them .
➡️If you like my posts smash the like👍👍 button, comment or follow me.⬅️
Thanks for reading my ideas,
Trade save!!

GOLD PRICE/VOLUME CORRELATION - GC1! - MONTHLYThank you for your likes, comments and shares! Much appreciated! This is an idea not a financial advise.
__________________________________________________________
A quick look at the some of the Gold key points. It probably will provide you an extra look on the price action.
See how the volumes have increased throughout the time. Some parabolic moves and little corrections. But, overall, the Gold price will probably continue to rise.
Some probable lower price ranges are identified and might be good entry points for a long entry. Holding long term position or dollars cost averaging.

12/20Again settled for a mediocre entry. Fomo must be the reason. As previously stated this setup lines up with my EU trade as well as DXY has now approached a favorable zone to drop. I love the words im using in this analysis lol. But definitely good execution. More patience I would say fasho. definitely glad im keeping up with evverything as now I will see my weaknesses. another SSS

Crude oil rises with US 10Y weighing on Nasdaq!Today's a bit bumpy for Nasdaq. The tech-heavy index has reached a key zone(flip zone) . In my opinion, correlation come into play again!
Crude oil has risen steadily for the past few days. It might add inputs to future costs as oil plays a very important role in the modern society. I know the concept of ESG but until No. of new energy cars outnumbers traditional ones.
We know the economic outlook and inflation can impact the US 10Y yield. Normally, better economy and high inflation would push up the yield. What's more, the rising yield could weigh on the stock market and we all what happened in Feb.
Job data(NFP) will be released this Friday. This might be the old play that good news is bad for stocks or vice versa.
So how high could crude oil go? I would say 70 is a key level.

Who Is Driving BTC Price? MicroStrategy Based On Elliott WavesHello traders!
Today we want to show you how strongly MicroStrategy and Bitcoin are correlated, so it can be telling us who is driving the price of Bitcoin.
As you can see, charts are in tight positive correlation and looking at the wave structure of MicroStrategy from Elliott Wave perspective, seems like one more leg down is missing to complete a five-wave cycle within wave (C), therefore BTC may stay down or sideways for some time.
From psychological point of view, many new Crypto traders are buying dips now in fear, desire, and greed not to miss again, so in Crypto market is always dangerous when the price turns for 50% from the highs, so we have to be very smart and patient.
We actually believe that BTC is still trading in a correction, it's just a higher degree corrective phase which can be a bigger one and it may take some time to make traders insecure and impatient before bulls show up again.
Be humble and trade smart!
If you like our idea, then please like and share it.
Disclosure: Please be informed that information we provide is NOT a trading recommendation or investment advice. All of our work is for educational purposes only.

Elliott Wave Analysis: Energy Sector May Face Some WeaknessHello traders and investors!
Today we will talk about energies, specifically Crude oil and Natural gas in which we see interesting developments.
As you can see, both oil and gas are in tight positive correlation as energies are in recovery mode, but a rise looks corrective. Oil has slow, choppy and overlapped W-X-Y complex wave structure, while gas has A-B-C correcitve rally.
Well, with current sharp and strong decline below channel support line, seems like bears are taking the lead, at least for a short period of time, so watch out for more weakness in upcoming days/weeks.
Be humble and trade smart!
If you like what we do, then please like and share our idea!
Disclosure: Please be informed that information we provide is NOT a trading recommendation or investment advice. All of our work is for educational purposes only.

DOGE and BTC Correlation From what we can see, there was no "major sell-off" per se. This was really just another scenario where $DOGE and other altcoins followed in the footsteps of $BTC. If you have any questions or comments, please reach out or leave them below.
As always, happy investing!

Strong Correlation with Market Brings Crypto SouthStarting from March last year, that is from the start of the massive bull after COVID-19 lockdowns, strong correlation can be seen between the crypto market and the stock market, not in magnitude, for sure, but definitely in direction. This wasn't the case before and this is the reason of the crypto revival to begin with. Few exceptions have been witnessed, most notably the GME squeeze which brought the stock market down but didn't affect crypto, and the recent BTC saturation, even if the directions can still be seen to be correlated. Another notable thing is that the recovery of the stock market is much faster than the crypto market.
For the above reasons and based on what's going on right now (also see the linked ideas), I expect a south direction for all crypto assets till the end of the month, including Ethereum.

EW Analysis: Bearish Looking Treasuries May Push USDJPY HigherHello traders!
Today we will talk about treasuries (10Y US Notes) and its negative correlation with USDJPY.
As you can see, 10Y US Notes turned sharply down after a corrective movement in wave 4), which means that it can be now on the way back to lows for wave 5), especially if breaks below channel support line.
At the same time USDJPY may continue higher as we know they are in tight negative correlation, so be aware of more upside on USDJPY with room even up to March 2020 highs and 112 area.
Trade smart!
If you like what we do then please like and share our idea!
Disclosure: Please be informed that information we provide is NOT a trading recommendation or investment advice. All of our work is for educational purposes only.

Gold recovered from daily loss with correlation plays! Hello everyone. Happy Labour day!
As I mentioned previously in my published idea. Gold has strong negative correlation with US 10Y yield. With recent rising covid-19 cases and new variant detected, people started to worry about potential impact on the global economy. I can see stocks, BTC as well as US10Y yield dropped in the past 2 days. Dollar and Gold rose as safe heaven assets.
Now gold will come to retest previous high and supply zone I marked a couple of days ago. Will it pass the zone? I don't know!
How far will it go depend on how bad the situation is. It's harsh...I watched videos about what happened there. My heart is broken.
Sometimes, It's hard to become emotionless under such circumstances even as a well-trained trader.
Trade safe and take care!
USD/CHF long termthere is negative correlation between EUR/USD and USD/CHF.
save your profit in 0.936

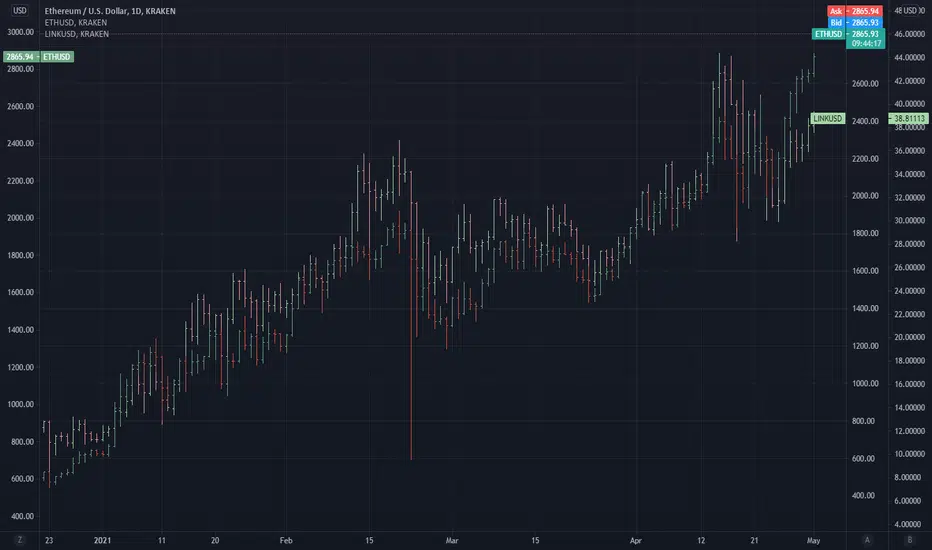
$ETH and $LINK USD trade patterns almost identicalLooking at the trading patterns for both $ETHUSD and $LINKUSD, they both seem to be identical throughout 2021. They were similar for a period in 2018 by then diverged, converging again in 2021.
What caught my eye specifically was the massive dip on Feb 22, 2021. Why are these two trading the same?
COIN vs BITCOINI haven't seen anything about this yet, so here is a chart comparing the price of COIN with the price of BITCOIN. I think that it's safe to say that so far there is a direct correlation between the two. Not saying they won't diverge or converge at some point... but that might be a signal of sorts. It will be interesting to follow this pair and see how they relate to eachother as time goes on, especially during large BTC price swings. I assume that this direct correlation will continue. Let me know what you think.
// Durbtrade

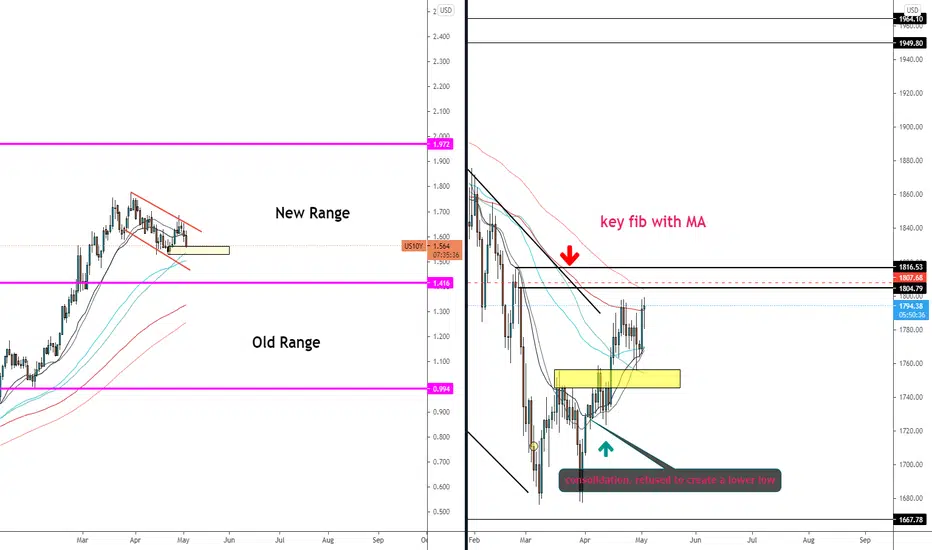
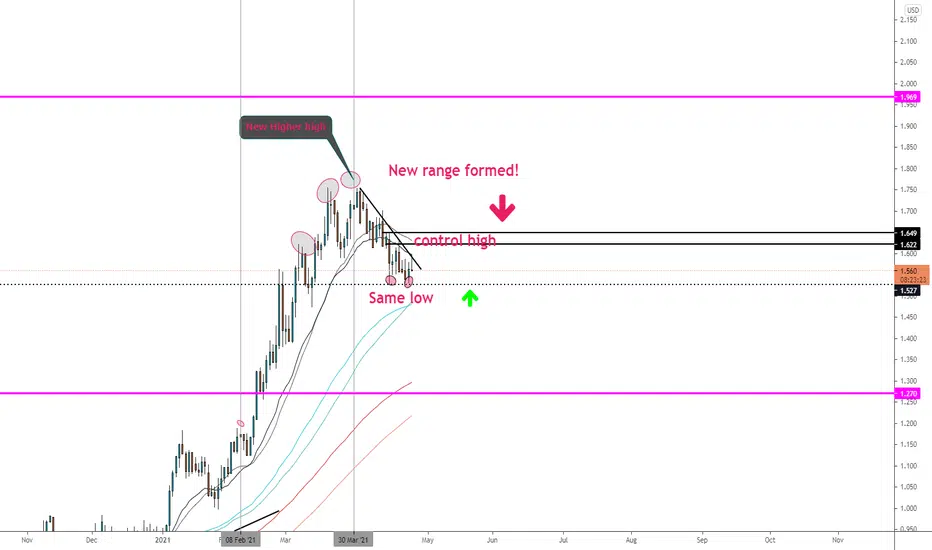
US 10Y to form bearish pattern amid NQ gaining momentum Hello everyone. It's been a while since I reviewed US 10Y yield last time. Now the control low has been violated, indicating sellers started to take control.
From the daily chart, we can see that bearish downtrend has been formed with a control high zone just above.
With the weakness of US 10Y yield, stocks are recovering from the low created by the news of possible capital gain tax rate hike. BTC also suffered a lot by approximately 30% from the fresh record.
I'd like to use the yield as an odd enhancer for trading other assets, such as stock and futures. The correlation between the yield and other assets can help us to increase the winning ratio a lot.
Trade safe and stay safe.
Do give me a like and follow if you like my idea.
BTC is the MASTER of THE UNIVERSE at least the crypto universeLike evil Skeletor... BTC has its crypto MINIONS, binance, cardano, polkadot, ripple, uniswap, theta, and litecoin..... When there is stress in the crypto market, there is an incredible amount of correlation in the charts!! REMEMBER THIS, you have to look at the flagship, to see what colors the rest of the armada will wave. LOOK AT THE LIGHT GREEN BOX!.
You always here everyone whining about correlation... but it is made very obvious here.
You can use this link for analysis of correlation. charts.coinmetrics.io
Quote: (in case you wondered why there are so many stupid leaders!)
"Success in almost any field depends more on energy and drive than it does on intelligence. This explains why we have so many stupid leaders." - Sloan Wilson

HOT/USDT Falling Wedge breakout trade !!Hello Trader,
good mood and profitable trades !
As you can see on the chart, HOT forming a bullisht chartpattern !!
TRIGGER: breakout whit confirmation on LTF or bullback
Fib bretracemant act as targets
SL in red area, or if price falling back in the pattern under 0.618 !
Remember that things can change too .
If you like this idea , support me with likes and comments !!
Dyor and trade save !

ETH all time - ALTs will follow...On the Daily - Obvious reverse signal here - give it 5 - 10 days and ALGO with be ATH.

BTC vs DXY As you can see in the picture BTC has 1-2 weeks offset in time with DXY
I tried to mentioned this difference in both charts
It seems it more probable to see another leg down in BTC

Using Longer-Term Correlation to Predict MarketsIn the chart above, I display a daily chart of gold at the top, followed by the graphical 90-day correlation coefficients between gold and various asset classes. I do this kind of analysis at times when I feel a major inflection point is incoming. It is very handy when everything is moving quickly, since you can make the right choice after the dust settles. Moreover, you can anticipate what will happen and get into positions during the brief period of pandemonium. I will say from experience that being on the right side of certain markets before the final directions are determined is perhaps the most profitable way to trade markets.
It is also extremely difficult to do and requires a thorough analysis of each major interrelated asset that is involved.
In my opinion, and based on these correlation readings, I am essentially bullish on gold, bearish/neutral on everything else. And, when you really think about it, it makes a ton of sense. Let me explain briefly.
I am not sure how anyone qualifies an asset class as "overbought," but just a quick glance at any equity index's monthly chart should be enough. All of them are so overbought that I do not feel the need to substantiate the claim with an indicator reading of any kind.
The same goes for Crypto, except double.
DXY and Oil are historically quite inversely correlated, and would imagine that they diverge as a result of a crypto-induced equities selloff.
That's right - amazingly enough, it seems that the "safe haven" known as Bitcoin is actually what is holding equities up so high on the backend. I think.
In any case, I hope this serves trading society well as volatilty soon approaches.
-CorrPigEarningsMiss
TVC:GOLD
TVC:SPX
TVC:DXY
CURRENCYCOM:OIL_CRUDE
BITSTAMP:BTCUSD

The Big Hedging is Coming; Bonds and VIX looking BullishThe market lately has been very unstable to say the least and has been willing to jump onto any boat it can in order to avoid inflation, However the price action we are seeing on the 30 YR seems to indicate that Inflation fears are overblown and that the Value if the Dollar index will likely remain stable.
While looking through the charts i noticed that there was an unusually high correlation between the 30YR Bonds and the VIX: Starting March 3rd 2014 as marked by the green vertical line on both charts. You can see that most Green Months in the 30 YR results in a Green Month in The VIX. I assume this is because many investors buy bonds in times of market uncertainty as a hedge against potential downturns in the value of equities and securities.
Todays Surge in Treasury Bonds could signal: A rise in Volatility to come, A downturn in the Stock market, and a Rise in both the Value and Confidence in the US Dollar.
