Bitcoin Daily vs Apple Weekly Are those assets really correlated on a different time frame? are those 2 the major safe heavens of the world investors?
Correlation

No Correlation Fround DXY and DJIi dont see any correlation to dxy rising = market crash from 6/14 to 3/15, DXY rose 19%, in the same period DJI rose 1200 pts
from 1/17 to 1/18 dxy fell 13% in the same perido DJI rose 2500 pts
From 1/07 to 2/09 the dxy dropped 7%, rose 20% then dropped 6% then rose 8% while DJI dropped 7000 pts
From 3/87 to 11/87 DJI dropped 20 %; DXY dropped 9%
i see no correlation
From 1/02 to 3 / 08 DXY dropped 40%; during the sane period DJI dropped 3600, rose 5800 and then dropp 1800
From 3/10 to 4/11 DXY dropped 16%; during the same period DJI rose 1500pts
i will continue until the point is made that there is no correlation to indicies moves and dxy and everyone relents
From 6/89 to 12/90 DXY dropped 20%; during the same period DJI rose400 pts then dropped 400pts then rose 200pts
From 12/93 to 9/95 DXY dropped 15.7% during the same period DJI rose 1000pts
From 8/92 to 2/93 DXY rose 19 % ; DJI rose 125 pts
from 8/95 to 2/02 DXY rose 47% : DJI rose 8600pts
From 12/04 to 10/05 DXY rose 13%; DJI was flat
From 11/09 to 6/10 DXY rose 15.5%; DJI rose 700pts then dropped 1100 pts

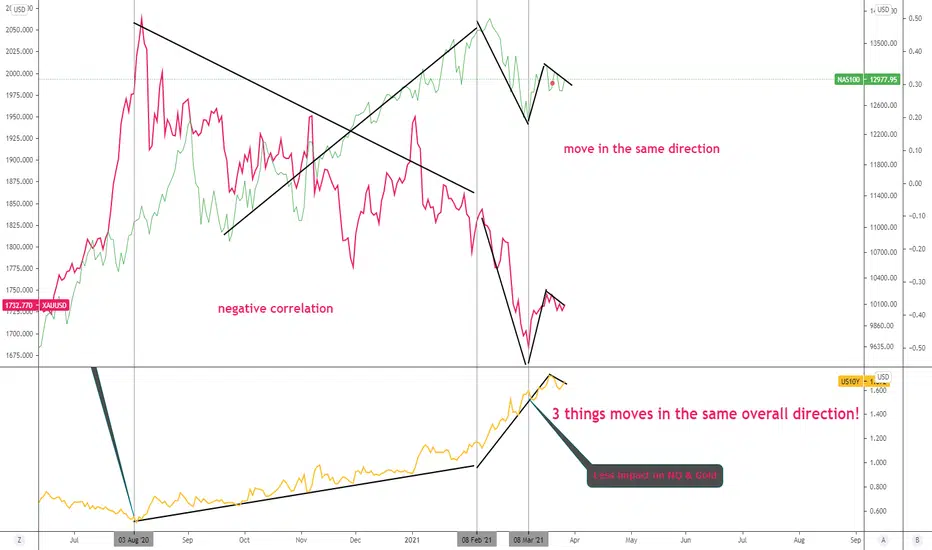
Focus shifted away from US10Y with less impact on NQ and GoldI'd like review the patterns from time to time. Pattern works until it doesn't. On Jan.6th, I wrote the idea titled " US 10Y jumped by 5+% A dangerous sign for stocks ". I was concerned of the speed. One month later, stock market started to fell drastically mainly due to this factor.
What I observed for the past few days is that the pattern may not work again. The correlation seemed to turn from negative to positive. From the chart, I can see that NQ, Gold and Treasury yield moved in the same direction since March the 8th. People may wonder why. Frankly speaking, I have no clue, maybe, investors shift the focus on something else, e.g. corporate tax hike, tensions between US and China.
The reason doesn't matter at all. What matters is how we are going to do. We should identify the certainties among the uncertainties.
Personally, the certain things are: 1) Economy is on its way to pre-pandemic normal. 2) Strong dollar. 3) Fed will raise its target rate sometime in the future, e.g. late 2022 or 2023, depending the CPI data.
So, I'm bullish on value stocks(banks, real estate) as well as USD pairs. Crude oil may hit 75 or even higher level. I'm bearish on gold until inflation reaches 3.5% or higher. Neutral strategy may work as well( check my BABA/Bidu strategy in the linked idea below )
Feel free to share your thoughts. Give me a like and follow if you think it's useful .
DXY Breaking out! Not financial advice but someone sharing his trading diary! - Make your own plan and you gonna be fine in the long run
DXY Is preparing to reach local Fib extensions / Previous consolidation
- This is short-term bearish for everything else (I am relating mostly to BTC and USDT Altcoin pairs). A correction scenario is more likely.
- longs are safer again if it rejects from the 94 level.

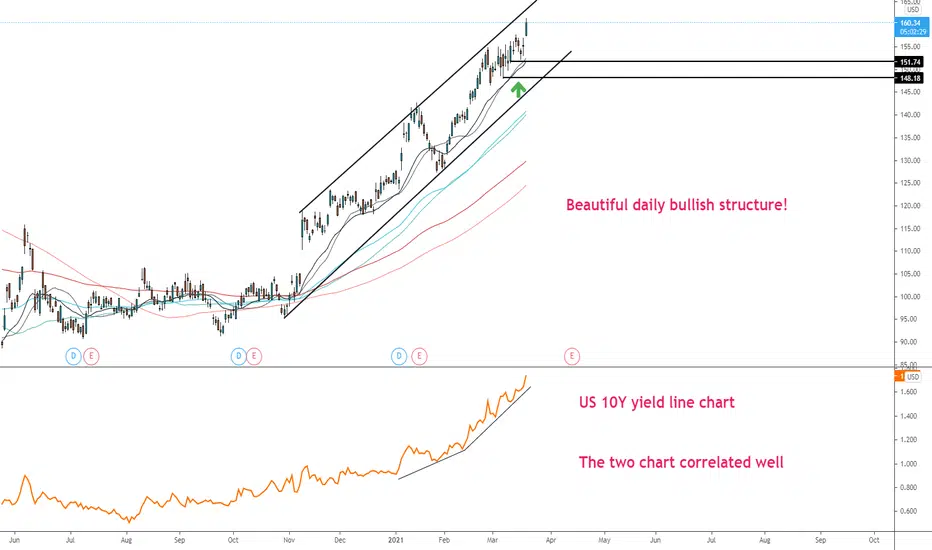
Daily Bullish setup of JPM who benefits from the yield surge!US 10Y yield has been surged for a few days. I mentioned why I'm bullish in the related ideas almost one month ago when the price of JPM sat around 150.
Now, it's 160, not bad compared to Tech stocks! It's necessary to include stocks in the banking sector under such circumstance.
As inflation is still low, I recommend to buy the dip until late Q2 when we might see inflation surpass key levels.
Hedge Your Investment PortfolioWhat Is a Hedge?
A hedge is an investment that is made with the intention of reducing the risk of adverse price movements in an asset. Normally, a hedge consists of taking an offsetting or opposite position in a related security.
_______________________________________________
A perfect hedge is one that eliminates all risk in a position or portfolio. In other words, the hedge is 100% inversely correlated to the vulnerable asset. This is more an ideal than a reality on the ground, and even the hypothetical perfect hedge is not without cost. Basis risk refers to the risk that an asset and a hedge will not move in opposite directions as expected; "basis" refers to the discrepancy.
_______________________________________________
In our previous educational post we noticed that you really liked this theme. The most pressing question in the comments was, what cryptocurrency is able to hedge the rest. So we made a short research to find and provide this table for you, guys. Here is the list of these cryptos that may safe your wallet from being bankrupt.
This is not the financial advice to buy some of these coins or something like this.
It is just a short material that all the crypto traders should follow before entering into the trade.
_______________________________________________
All the materials were taken from Binance and Bitmex open sources
We are glad to share all the materials with this community.
Feel FREE to leave comments below about your vision
Thank you, wolves🔥

Correlation of Cryptocurrencies“Correlation statistically measures the strength of a linear relationship between two relative movements of two variables and ranges from 0 to 1.”
In general, assets with a correlation above 0.5 or below are considered to have strong positive/negative correlations. Conversely, a close-to-zero correlation indicates no linear relationship between two variables, and for the purpose of this analysis, the returns of two assets.If the returns of two assets do exhibit a positive correlation, it implies that the two assets are, to some extent, moving in the same direction, and therefore share similar risks. On the other hand, a negative correlation between the returns of two assets indicates that the two assets are moving in opposite directions, and it is thus possible to use one asset as a hedge against the other.
Based on this analysis, correlations are highest between altcoins and Bitcoin itself (~ average correlation of 0.69), indicating that most of the altcoins move in similar directions as Bitcoin, underscoring Bitcoin’s status as a bellwether for cryptoasset markets.While, generally speaking, altcoins are highly correlated with BTC, select cryptoassets exhibit materially weaker correlations both with BTC and among one another, which suggests that additional idiosyncratic factors may affect the prices and returns of these assets.


Gamestop Reckoning Part 1. VolumeAs the community of traders reckons with many a crazed new-comer and their love of gamestop GME and AMC we have to be glad that people are being more and more interested in trading. However, for many of us, trading isn't to make a statement: it isn't to make a point, to stick it to someone or to prove how resolute you are.
For me at least, trading is the end result of an exciting process of creative research, imaginative planning and positioning, using algorithms that I've written to try to get a well-timed entry, and the satisfaction of not worrying about each pricepoint thereafter -- knowing that
I like the stock because of the sub-industry position in our future as a society
I like the stock because of the particular company's financials relative to any similar sub-industry member
I feel that management, both based on metrics and intuition from listening to the researchers, COO, CEO, CTOs at the company actually believe in what they are doing.
I feel that the timing is right from a technical perspective, relative to events, from an industry-cyclic standpoint, and broader market threats.
Thus, in summary, my "advice" to anyone would be: buy a stock because you find it compelling, you can imagine what they do 5 years from now and its more than what they do now, you know the company is healthy, there aren't many threats, and you wouldn't be upset if it lost 10% because you are confident in its future. .
If you feel this way about GME, then that's great. But its unlikely that you will make it through the above points without a bit of heartburn -- especially given the following: EARNINGS COME NEXT WEEK . This is a time to ask yourself the following question: what is a fair price? Did 100% gain exceed your fair price? How about 500%? I'll leave that to you.
Today lets look at GME's Volume using the OBV Correlation Indicator.
The OBV Correlation Indicator can be set to correlate with any reference. I've chosen QQQ
Secondarily the direction of chart stock's OBV is encoded with color: So if the histogram is negative AND red this means the correlation is negative and the obv direction is downward for GME.
Lastly price correlation is encoded with a line, and price direction with color. Thus a negative red line means the price directions are also anti-correlated and price is downward.
In the case of GameStop we see the natural pre-earnings pattern.
A lower price correlation than usual to the broader market
A lower volume correlation than usual to the broader market.
But we see something else here. We see accelerating negative correlation in Obv of GME and the index as well as obv oscillator decreasing at an increasing rate.
This is all one moment in time. However we have to remember earnings are about rectification: rectifying the price with perception, rectifying expectation with guidance, and also rectifying expectation with position --- i.e., a time to take profits.
Ask yourself this: Do you see whatever will be said by management as being something to sustain a 1,000% increase in price? Do you imagine a buyout would be offered at 1,000% its price at last earnings?
This week: Watch the relative volumes, watch the decoupling of volume and price using this indicator (OBV correlation indicator), and if you are holding GME, consider looking like a genius and selling now.

How things got linked up with one chart(FED, Gold, US10Y,NQ)I covered this part in my video. To be more specific, I made this chart to better understand how things linked up.
US 10Y yield is the anchor that rising rates may indicate two things: 1)strong economy, 2) inflation
Fed is only able to directly control the short-term rate, say federal funds rate, not the long-end rate. On March 15th of 2020, It reduced the target range for the federal funds rate to nearly zero. That triggered the quick rebound of everything, including gold and NQ. We can see the two assets moved in the same direction . I bet everything moved to the upside!
So when things started to change?
In early Aug. of 2020 , US 10Y yield completed consolidation and started to go up in a moderate mode. Look at the slope! However, gold reacted to rising yield with a retreat from historic high of USD2075ish and it came all the way down. NQ shrugged off and kept moving higher. The two assets started to move in opposite direction.
On Jan. 6th of 2021 , I published an idea titled 'US 10Y jumped by 5+% A dangerous sign for stocks' . Actually, I'm concerned then, because I observed the speed of going up is tooo fast!
So when was the pattern of moving opposite terminated?
On Feb.8th 2021, US 10Y yield stood at 1.17%. That day was a special day. It created a new high, indicating the readiness of going up. Two days later, the yield started with a series of big bullish candles ! This time, stock market couldn't shrug off like it did 6 months ago. It tumbled with gold. The two assets moved in the same direction again until now!
So, when will this pattern be terminated? I don't know. But that day comes with a few signs as below:
1. inflation goes above 3% above. Funds will go back to gold again as it serves the function of hedging inflation. Stocks, especially, growth stocks will suffer a lot. Value stocks will outperform the growth.
2. Corporate earnings are way better than expected. Investors realize that stocks are under valued. The main driver of the market comes back to earnings, not the monetary easing policies. Dollars may get stronger with funds outflow from emerging markets.
That's the map in my head of what might happen in the future. Follow the path, I'm confident to dig some opportunities.
Give me a like if you love this idea!

From US10Y yield to Gold and NQ(sensitivity & 6-month time lag)Alright, I think people are tired of US 10Y yield, but my analysis revealed that gold is more sensitive to US 10Y yield than NQ. In addition there is a half-year time lag. If you're interested, could jump to the end of my video. Some highlights are as below:
1. The new range of US 10Y yield(1.5% - 2%)
2. NQ bullish setup review(risk & return) and the benefit of trail stops by using short-term MA.
3. Why a bullish and bearish gold setup after key zone violation? How to reduce trading risks by price action?
4. Why gold started to drop since Aug.8th 2020 ? How the date correlate with US 10Y yield?
5. The correlation between NQ and Gold and why do they move in the same direction sometimes?
Feel free to share your thoughts, and don't hesitate to give me a like if you like the video!

GOLD vs BITCOIN => Who Will Win?First of all, I would like to thank @TradingView for this chart combination!
I found XAUBTC chart interesting. Here is why.
XAUBTC has been bearish for a while. HOWEVER...
We can clearly see that the impulse movements are getting smaller and flatter . (as shown by the angles highlighted in blue)
So from a market structure perspective, this is an early alert that the buyers are losing strength, and we might have a potential reversal soon. BUT WHEN?
For the buyers to take over, and the momentum to be shifted, XAUBTC has to break above the last swing high. (around 0.04 - 0.05)
If this happens and XAUBTC goes up => it means:
Scenario 1 - GOLD UP, and BITCOIN DOWN
Scenario 2 - GOLD UP, and BITCOIN UP with Gold moving up more aggressively
Scenario 3 - GOLD DOWN, and BITCOIN DOWN with Bitcoin moving down more aggressively
Which scenario is more likely to happen in your opinion? and Why?
~Rich

Gold and the Dollar are not friendsGold is really about the US Dollar strength. I've shown the inverse correlation in other charts before, but not on this 15 min time frame.
The relationship is startling.
So - if you believe the dollar is going to go significantly north, there is hardly any point going long on Gold.
If you believe that a Dollar Surprise is coming (see my post on that), then are you long on Gold? Think about it.
Disclaimers : This is not advice or encouragement to trade securities on live accounts. Chart positions shown are not suggestions. No predictions and no guarantees supplied or implied. Heavy losses can be expected if trading live accounts. Any previous advantageous performance shown in other scenarios, is not indicative of future performance. If you make decisions based on opinion expressed here or on my profile and you lose your money, kindly sue yourself.

The japan titans & worldwide investors have made up their mindAnother idea on the yen which is waking up from its slumber of uncertainty, its 3 years slumber 😴. Which allows me to activate my crystal ball & predict the future.
Hey I even threw an indicator in here, some nobs like them, it pops out but maybe not everyone sees it, the yen is breaking with conviction for the first time since December 2016.
If you don't get what this means just keep reading.
Back in 2016 the stock market was stagnating, George Soros kept shorting it, many funds were shorting it, the JPY had a major decline after a choppy uptrend then some sideways, and after the big very visually noticeable Yen decline, the US stock market had this big big rally for all of 2017 that Trump kept throwing at everyone.
This should clarify things, if it doesn't well contact me to get roasted for free 😀:
If you zoom in in 2016 you even get the same shadow from all the useless parasites stat-arbing this
BoJ next meeting 18 or 19 March, rate going to stay the same for sure, continuing to boost the economy, really boosting the Wall Street hedge fund industry economy.
As a conclusion, perma-bears are going to get laughed at again on CNBC Squawk Alley and other intelligent programs.
Poor Peter Schiff. Nouriel Roubini the great nobel prize is recommending to short since 700 points LOL it's going to 5k soon.
The boy that cried wolf is coming soon, no one is going to listen to any warnings, they must be sick of uncertainty & fear and more convinced than ever.

US 10Y 6%+ jump scared investors, triggering another selloffAfter pulling back from 1.56% and consolidating for two days this week, US 10Y yield started to moving again!
From the daily chart, it's inevitable as the recent demand zone holds very well!
What I'm expecting is the below two scenarios:
1. yield keeps going up and investors are scared to flee the stock market. Bull market ends!
2. yield keeps going up and investors are concerned first, but eventually shrug off the yield hike. Bull market continues!
Personally, I prefer to the second one. By looking back and studying the history, bull market ended with fed rate hiking. US 10Y yield weigh on the market, but the decision maker is the target rate.
So, my overall asset allocation strategy is buying the dip. There is warning for sure, but it's not over yet!

Where will NQ go today(March 4th, 2021)In this 10 minutes video, I discussed where the NQ might go after yesterday's drop. Some highlights are as below:
1. Price is coming down to a key support zone (Weekly & daily)
2. Two possible scenarios
3. Review some trading opportunities on 5 min and 1 min in the overnight session(mainly Asian session)
4. Check US 10Y yield and crude oil(linked with inflation) to predict today's move


New Range of Gold, US 10Y and next possible moves!In this video, I reviewed the price move of gold and identified new zones for gold. Some highlights are as below:
1. The relationship between US 10Y yield and gold
2. New range formation and why?
3. How to trail your stops on smaller TF and pattern you need to pay attention to

From US10Y Yield to Tesla and JPMIn this video, I explained the logic of recent market move caused by US 10Y yield. Actually, what caused the volatility doesn't matter at all, the key is what you're going to do.
Some highlights are as below:
1. Why JPM rallied in the recent month?
2. Concern of the US 10Y rally continue to weigh on stocks..
3. Similar pattern between US 10Y and JPM
4. Valuation drove the buyers to cheap stocks.
Enjoy your trade. Be careful if you're using leverage to trade stocks, like Tesla.

BEWARE OF POTENTIAL REVERSAL - OBSERVATION WEEK COMING - ZB-30MNThe T-Bond 30 Years ZB is falling when the S&P500 is rising, Shouldn't it be the opposite when the economy is not going well?
Beware of the possible super return of trends that might come soon.
What about the timing at the moment?
We notice that at open or 2h after American open an acceleration of the price movement occurs. Also at London closing time.
What about the forces?
Forces are clearly dragging the prince down but no vision in where the price is going.
What about correlations?
Opposite correlation with S&P500, ES.
Same direction with Gold, GC.
The green vertical line is at the time in which tomorrow, Monday 21st, we probably should see some nice movements if the market price follow same pattern as during the week before.
We will still observe during next week. To repeat again, beware of trend sudden reversal. Probably, you can use this chart in combination of your S&P500 trading session, going in opposite direction.

EURUSD - Get in on RETEST (See DXY Chart)EURUSD seems to have faked us out last week and now is creating another high. The way we can enter this is if we wait for a impulse and a retest on the neckline shown on the chart. With this, we can have a tight stop loss.
See DXY chart below for correlation. DXY down = EURUSD UP

Is EUR/GBP indicating the S&P500 Crash ?The last test of the weekly trendline in EUR/GBP was the March 2020 Crash, thats when EUR/GBP spiked up 1200 pips within a few weeks.
Now price is moving close to the Trendline again, could this be a indication for the S&P500 Crash, i think so.
Those that follow my Charts know that im looking for a Market crash in the next few moths, it seems like This EUR/GBP trendline could be a Indication for it.
This correlation can be seen in most EUR pairs, i also posted a important EUR/AUD chart about this a few days ago, all of them give the same indication, they could be Indicating the Market crash from the technical side.
This proofed to be working in 2000 / 2008 and March 2020, will it work again? Lets see.
