AUD/USD headed to the down side AndrewTheSage reporting to you live. My charts are messy and colorful. I am not a financial advisor I use arrows and different types of fib levels to show what's going on.. I will not put up an essay. I feel if you can read a chart you can understand what's going on with price by showing you a visual effect. The Dollar is going up....notice as the dollar goes up notice the negative correlation it has on AUD/USD it's going down mirroring the opposite.
Correlation

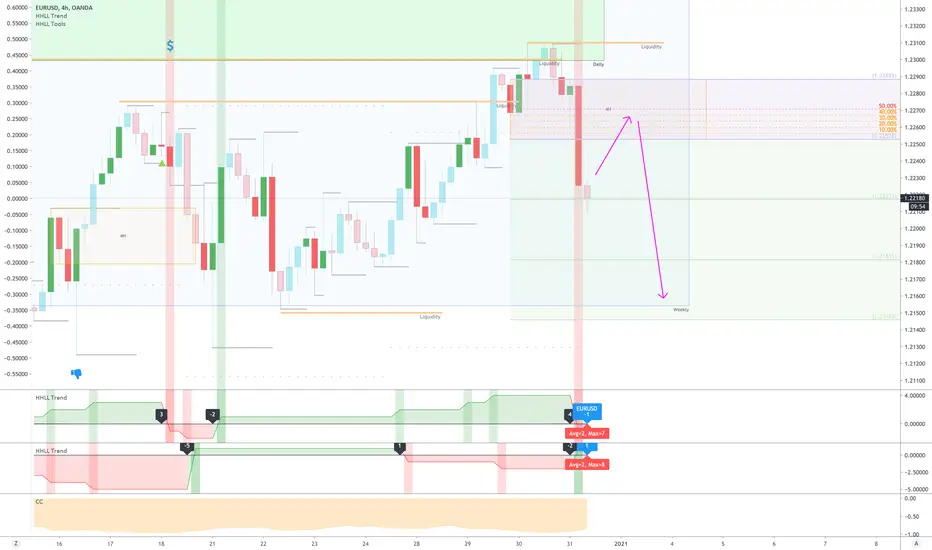
EURUSD - One more push up?Last week we anticipated a breakout but it failed to break a major level. This week we may see one more push up before reversing. Paying close attention to the double top region.

EURUSD - One more push up?Last week we anticipated a breakout but it failed to break a major level. This week we may see one more push up before reversing. Paying close attention to the double top region.

Cycle is up for the Aussie. Cycle is up for silver.Check the related idea for USDRUB. It is a very similar story but the Australian dollar has an even stronger correlation to silver. Longer term cycle turned up in March. And now inside a topping medium term cycle there is a rising smaller cycle - which is up until mid April - same as silver. Upside price target is 0.85 for AUD. Remember futures trading involves a substantial risk of loss and is not suitable for all investors.

Tesla brings down the whole marketThis is the product of NASDAQ:TSLA being included in the AMEX:SPY . Look at the price action today. A selloff in Tesla brought down the whole market. The correlation is nearly 1.00 (see below...)

BTC Bull Run Not Over BTC vs. USDOLLAR A quick idea.
This is BTC compared to USDOLLAR.
For the most part you can see when USD goes down BTC goes up and vise versa.
USD seemed to be breaking out of the falling wedge like it did previously that marked the end of the last bull run.
But is has went back under and is continuing on a downtrend.
This is good for BTC.

US 10Y continue to weigh on stocksNeedless to say the importance of US 10Y treasury yield. It is used as a proxy for many financial matters.
From the daily chart, I can clearly see that price has completed the pullback and is very likely to rise. It will weigh on the stock market at least for a short period of time.
Given the OMO of Fed, I think the bull market is far from over. However, the recent drop, as well as the WSB, indicate the high volatility in the near future. It's been up for quite a long time. It's better to take a while before heading up again.

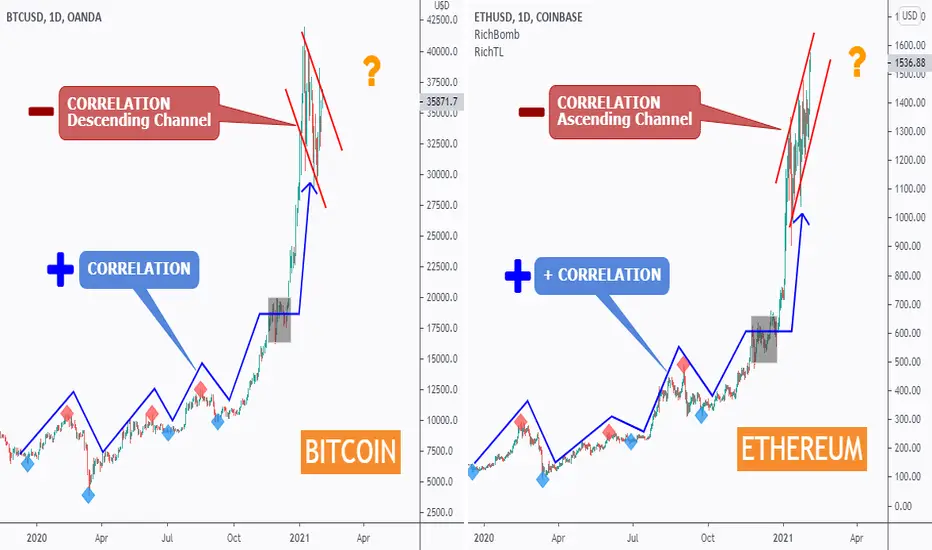
BTC and ETH Correlation from + to - ! Now What?Hello everyone, hope you are having a fantastic trading week!
Bitcoin and Ethereum have been trading in Sync as shown by the blue projection, both making higher highs, and higher lows almost together.
Lately, the positive correlation we used to see started to fade away! and in fact, ETH and BTC are now trading in the opposite direction.
As you can clearly see, BTC is trading inside a descending channel while ETH is trading inside an ascending channel.
What Next?
Are we going to see the positive correlation back by Bitcoin trading higher from here to catch up with Ethereum?
Is now Ethereum leading?
I find the comparison very interesting. What do you think will happen?

AUDUSD Correcting. Uptrend still intact.#AUDUSD:
(1D):
Also here the USD is getting weaker, resulting in a clear uptrend, which is confirmed by the 200 EMA as well. After last complex consolidation, the chart has been overextending for quite some time, so consolidation was to be expected.
(4H):
On a shorter period indeed, we have a downtrend. We recently had a fakeout to the downside, when sellers tried to accelerate without result.
(1H):
Right now, we have a range which means indecision in the market. This also means that we could see a deeper correction, as well as a strong uptrendtrend rebound if broken to the upside. This aligns with gold analysis (AUD positively correlates with XAU).

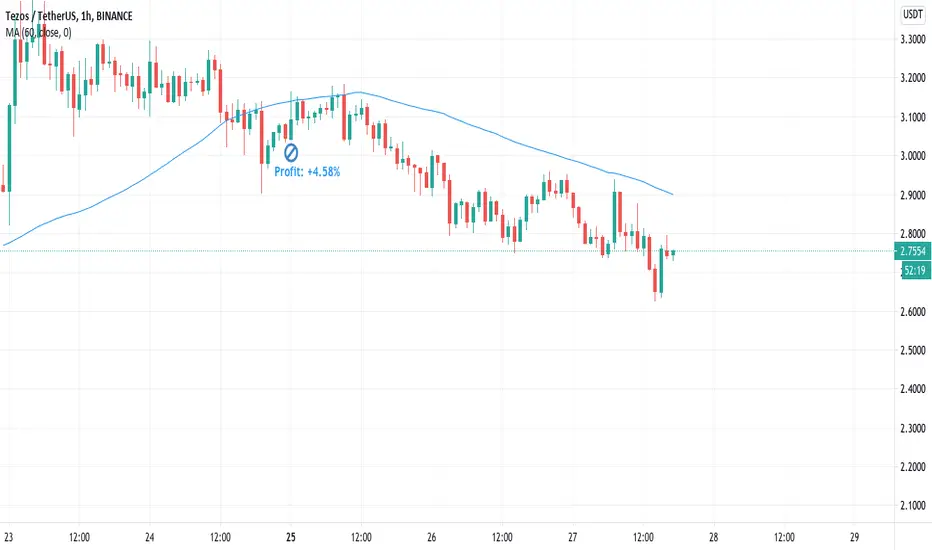
XTZ correlation with LINK - still alive & beats buy-&hold nicelyPlenty of traders buy XTZ whenever LINK makes a big move in the hope that the same will hapen with Tezos. There has been a lot of discussion if this practice is a waste of time or has an acctual edge. I will share here an idea that is being developed for the past 3 months. The sample size is still low at 20 trades, 30 would be optimal, so this is in progress.
WILL POST ALL POSITIONS BELOW
The strategy:
Toyed with plenty of indicators, support and resistances that affect LINK. However using them on a different asset produced quite some noise because of the lag that was acctualy needed in this correlation strategy. So in the end the winners were simple increases/decreases in the price and volume at which LINK was trading. Used many different increases/decreases tresholds to time positions. Small price increases like "up by 2% in the last day" were not productive.
Secondly the need for a confirmation indicator to close positions became apparent as we were holding winning positions too shortly. A simple SMA, albait at length 60 SMA did the trick.
The rules:
Painfully simple rules is the way to go. This is all done on the 1H timeframe, although we look at the previous day price/volume movements too. So in our case we will:
Open an XTZ position when: LINK/USDT price is up by 5% in last day
Close the XTZ position when: LINK Total Volume is down by 4% in last day AND Price is below SMA (60)
No Stop Loss or Take Profit
Do not open a psoition if both the open and close rule are true at the same time (price is up, but volume is tanking)
The results:
In the last 3 months the strategy brought in +66% on spot. If you were just holding XTZ you'd have +39.5%, so a significant imrovement with a lot of potential on futures.
We saw 20 trades in the 3 months, loosing 11 and winning 9. The wins are more sizable with the gains, so maintaining this rate would be ideal. Most positions are held for 2-3 days.
The max drawdown in the entire period was 7.75% which is excellent.
The optimization:
It might be worth looking for a third close indicator as it still does not capture the peaks to perfection. In case anyone has an idea, please post it.
The positions:
21/01/2021 00:00
25/01/2021 00:00
4 days
OP 2.9099
CP 3.0431
+4.58%
18/01/2021 06:00
19/01/2021 19:00
2 days
OP 2.9157
CP 2.9351
+0.665%
17/01/2021 19:00
18/01/2021 05:00
10 hours
OP 2.8984
CP 2.8806
-0.614%
13/01/2021 14:00
17/01/2021 08:00
4 days
OP 2.4038
CP 2.7634
+15%
12/01/2021 07:00
13/01/2021 00:00
17 hours
OP 2.3687
CP 2.2979
-2.99%
09/01/2021 16:00
10/01/2021 19:00
1 day
OP 2.6017
CP 2.547
-2.1%
09/01/2021 04:00
09/01/2021 05:00
1 hour
OP 2.5415
CP 2.5249
-0.653%
03/01/2021 01:00
08/01/2021 01:00
5 days
OP 1.9975
CP 2.4438
+22.3%
01/01/2021 13:00
02/01/2021 00:00
OP 2.0743
CP 2.0081
-3.19%
24/12/2020 23:00
31/12/2020 00:00
6 days
OP 2.0752
CP 1.9896
-4.12%
16/12/2020 17:00
19/12/2020 00:00
2 days
OP 2.3128
CP 2.3253
+0.54%
12/12/2020 12:00
16/12/2020 01:00
4 days
OP 2.1392
CP 2.2155
+3.57%
09/12/2020 23:00
11/12/2020 00:00
1 day
OP 2.1786
CP 2.1059
-3.34%
03/12/2020 04:00
03/12/2020 06:00
2 hours
OP 2.4209
CP 2.38
-1.69%
27/11/2020 17:00
03/12/2020 00:00
5 days
OP 2.2312
CP 2.3885
+7.05%
20/11/2020 09:00
26/11/2020 00:00
6 days
OP 2.1004
CP 2.5969
+23.6%
16/11/2020 18:00
20/11/2020 00:00
3 days
OP 2.0879
CP 2.0773
-0.508%
10/11/2020 10:00
12/11/2020 00:00
2 days
OP 2.1627
CP 2.1244
-1.77%
05/11/2020 15:00
09/11/2020 03:00
4 days
OP 1.9195
CP 2.0808
+8.4%
27/10/2020 17:00
29/10/2020 00:00
1 day
OP 2.1036
CP 2.0003
-4.91%
Happy to answer any questions!
LITECOIN - Reversal Soon!LITECOIN is overall bearish trading inside our two red trendlines forming a Wedge pattern. And the first major support that may hold it back is the blue zone and round number 100, so as LITECOIN approaches it, we will be looking for reversal buy setups.
The upper red trendline is not valid yet (only connecting two swings) so we will be waiting for a third swing to form around it to consider it valid (projection in purple). In this case, the third swing would be considered our trigger swing.
Trigger: Waiting for a momentum candle close above the gray area to buy. (after the swing high is formed as shown in purple)
Until the buy is activated, LITECOIN would be overall bearish trading inside the red wedge pattern and can still dive inside the blue support before going up.
And of course, as LITECOIN approaches our upper green supply zones, we will be looking for sell setups.
As per my trading style:
When our buy is activated, the stop loss goes below the last swing low, and I target double the stop loss size.
Always follow your trading plan regarding entry, risk management, and trade management.
Good luck!
All Strategies Are Good; If Managed Properly!
~Rich

EURAUD: Bearish TheoryTwo global economic crises so close together in world history, what are the odds?
In 2008, the USA stock market bottomed out and began it's recovery just as the EURAUD pair hit a top and sold off.
This correlation to the SPX, from a global market view, is interesting because there is such a great shift from negative 80 to positive 80 in a 4 year span after the 2008 recovery.
It will be interesting to learn how this trend plays out in the coming years. The correlation coefficient has been dropping as the prices are starting to diverge negatively again. If it's anything like last time, we could be starting a long-term bearish trend in the pair.
Or, the positive correlation holds strong and leads the pair up during the recovery.
Or, the least likely scenario, the correlation holds but the pair drops like last time and the SPX goes down with it.
Check back in three years.

BTC ETH CORRELATION CHART SHOWS DROP FOR ETH POSSIBLEAs you probably know, BTC and ETH are correlated which can be seen in the CC indicator below.
Based on the drop in the BTC line on the chart, we will start tracking ETH for a short opportunity.

SPX500 UP and USD down again? Hey tradomaniacs,
for today I`m looking at the correlation of DXY (US-DOLLAR) and SPX500, which are both at points of potential trend-continuation.
As mentioned on telegram we have seen a very bearish sentiment of retailers of majors against USD, which is for me a strong reason not to buy the US-Dollar as long there is no fundamental reason.
As soon as SPX500 continues its trend we can expect the US-DOLLAR to move down aswell, which would give us a great chance to buy majors such as AUD/USD, NZD/USD, GBP/USD and EUR/USD against the retailers sentiment and with the banks.
Still waiting for confirmation!
LEAVE A LIKE AND A COMMENT - I appreciate every support! =)
Peace and good trades
Irasor
Wanna see more? Don`t forget to follow me

BTC: Digital gold trades like goldThe correlation coefficient between gold futures and Bitcoin started out negative for a few years, but after Feb '14 they began to move together. BTC and gold have now been in a five year cycle where the correlation will jump to +72, then drop to a higher low, then up to +72 again, over and over. It seems reasonable that the correlation could soon become stronger than +72 at this rate.
It adds validity to the "Bitcoin is digital gold" idea. They are both being traded in an increasingly similar way.

SPX's Correlation with M2 since 1980.Definition
Correlation Coefficient (CC) is used in statistics
to measure the correlation between two sets of
data. In the trading world, the data sets would
be stocks, etf's or any other financial
instrument. The correlation between two
financial instruments, simply put, is the degree
in which they are related. Correlation is based
on a scale of 1 to -1. The closer the Correlation
Coefficient is to 1, the higher their positive
correlation. The instruments will move up and
down together. The higher the Correlation
efficient is to -1, the more they move in
opposite directions. A value at 0 indicates that
there is no correlation.
----------------------
M2 is a measure of the money supply that includes
cash, checking deposits, and easily convertible
near money.
M2 is a broader measure of the money supply
than M1, which just includes cash and checking
deposits.
M2 is closely watched as an indicator of money
supply and future inflation, and as a target of
central bank monetary policy.
-------------------

Did a bit of ETH to BTC conversion on the Run Up in ETH priceNoticing that the trend has started to reverse, not so sure about converting BTC back to ETH unless ETH corrects very hard...like below 1K again, which might be in the card over the weekend...Why the dump...don't care...probably has something to do with Real Interest Rates rising. Gold got clubbed like a baby seal early in European session, so I guess Gold is now a bit of a leading indicator for crypto...Interesting, will have to make use of this knowledge in the future if the correlation holds up.

10Yr, Metals, and Rate Sensitive Equities This is one of my favorite comparison chart and is a clean, simple way to show the intermarket relationships and how important the yield environment is for certain other markets.


BTC, XLM and XRP correlation brokenIf you can hear me, great!
If not..
I am highliting that there is a decent amount of correlation going on with XRP and XLM, in comparison with BTC.
HOWEVER
As of recent, the correlation seems to have swayed to negative correlation.
Remember, one coin is based on decentralization, and the other/s are based on the polar opposite, on the side of banks...
Also, I said that when BTC corrects to $12-20k, i imagine XRP and XLM will begin a bull run.

Time for DXY to swing up - BTC to correct down?The inverse correlation between USD currency index DXY and BTC is well known. Now DXY is kindly letting us know that it is going to turn its price action up, at least temporarily. There is a very distinct bullish divergence forming on RSI, the same way it formed in August. Then the price of DXY made three lower lows while RSI was moving up before the price started to make higher lows. Now DXY has made its first lower low of that kind.
What is BTC going to do if DXY starts going up? It retraces. If things work out as they did in August and September this is how it could go:
- DXY makes 1 or 2 more lower lows stopping at the strong support zone around 89
- BTC slows down its ascent and turns its nose down
- DXY climbs up to the level of 91.5-92
- BTC retraces 20-25% (in September 21%) taking the price to 22,5-24k support zone
- DXY continues its journey down
- BTC continues its journey up
This is just one plausible scenario. We all know things could go differently, so DYOR.
Trade safe and take care.
Cheers Whoop
