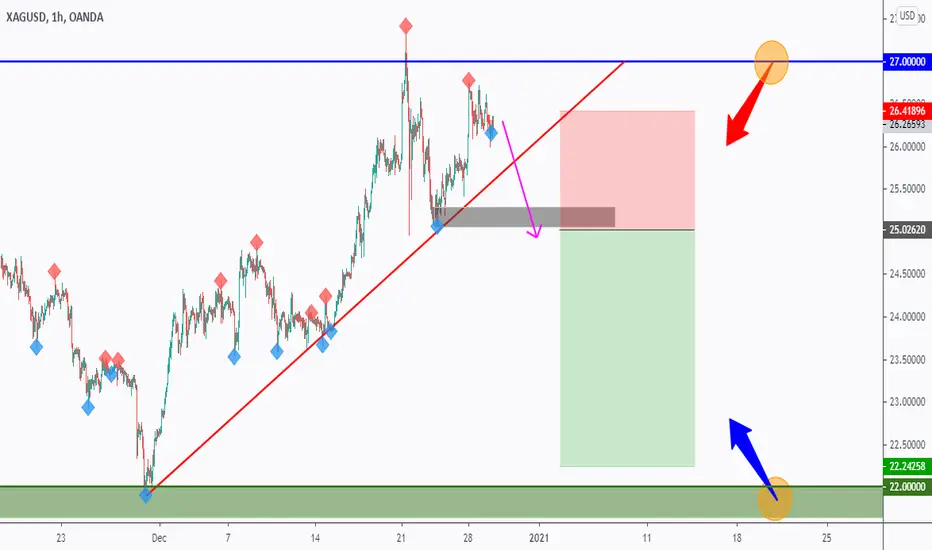
SILVER waiting for a trigger to sellHello everyone, if you like the idea, do not forget to support with a like and follow.
on DAILY: SILVER is sitting around strong resistance 27.00 in blue so we will be looking for sell setups on lower timeframes.
on H1: SILVER formed a valid trendline in red so now we are waiting for our trigger to confirm the bearish movement.
Trigger: Waiting for a momentum candle close below the gray area to sell.
and until the sell is activated, this one would be overall bullish and can still dive inside the blue zone.
As price approaches our lower green support, we will be looking for buy setups.
Good luck!
Correlation
BTC and XLM longBitcoin held the VWAP line with avg to low volumes and seems that it's bouncing to keep going with the uptrend.
XLM is a bit lagging behind and crossed below the VWAP with high volumes, if xlm will keep going down a very sweet spot for a long position is the yellow zone that represents Volume profile's POC of yesterday's session and the close of the VWAP. They are gonna behave as support and if bitcoin keep the uptrend, xlm will definitively recover and go up.
Super tight stop loss around 0.13970 because is this line doesn't hold then it's gonna be a freefall.
All this ONLY if bitcoin keeps staying above VWAP. If we see a break of vwap with big volumes, then forget about any long position since the market is gonna correct heavily.

BITCOIN: What's driving it? Is 30,000 in sight?In this video I show my theory on what's probably happening with BTCUSD.
It appears that Bitcoin is being used to hedge against the US Dollar crashing.
$22,000 is certain in sight and who knows it could get to $30,000 sooner than anyone might imagine.
I still think that BTC is too volatile for my liking and therefore I've stayed out. I've been happy to avoid FOMO. I've lost nothing.
I think that many will profit from a possible further charge north. But there is also still a risk that it BTC could reverse significantly.
Best wishes for the Christmas period 🎅and have a Happy Prosperous New Year. 🥂🎁

EURUSD / DXY CorrelationRather than strong moves on EURUSD, it's the weak USD Dollar that's causing this insane ride toward the end of year.

Don't miss the trade! My bullish setup of crude oil on 2HReasons to buy :
1. Oil is clearly in the uptrend on my weekly & daily chart indicated by my duo MA system
2. Previous flip zone of 42.3ish has been firmly taken out. That's my odds enhancer.
3. 2H bullish setup is actually refined based on the daily demand zone.
Fundamentals:
1. With vaccine being distributed in UK and States, it's much more clear that economy will rebound against the backdrop of rising cases.
2. loose monetary policy leads to weaker dollar
3. According to market outlook released by some big institutions, the price range of crude oil is 45 - 55. I don't know their models so it's for your reference.
Other Options:
If you prefer to hold longer, I'd recommend USO which is an crude oil ETF. Future trading involves leverage which is a bit risky...You gotta have capabilities of managing your positions well. Or you will be stopped out even you bet on the right side.

Correlation, diversifying & hedging : An elementary viewOANDA:EURZAR
Greetings
In the world of forex trading or trading of any financial instrument for that matter, many complex, technical and convoluted words are thrown around in conversations. Such jargon, though is relevant, tends to result in many blank stares especially among some of my peers, many of whom are not finance, economics or statistic fundi's. Many of them with basic education, yearn to be part of these conversations and also contribute their own opinions. This leads to many of them simply offering that awkward nod, wide smile and occasional laugh when everyone else does. they are relegated to conversation observers who's feet seem stuck to the floor. I've been there and that feeling is gut-wrenching, degrading and leads you to view the rest of the crowd as snobs, elitists or braggarts. this then creates apathy toward the subject matter. Well i will try, through this article, to open one of the many back doors to this world. I will attempt to unwrap and "break it down" to bite size chunks so that maybe one day when you are in the midst of the so called "esteemed highbrows", you will also throw in your "two cents".
This article will explore the concept of correlation trading. Correlation can also be viewed as the interconnection, interdependence, association or link between. So correlation trading (especially in forex), is basically a statistical measure of the relationship (or association or interdependence) of currency pairs. A simplified example would be if you take the AUDJPY pair. This pair is an association or link-between the AUDUSD and the USDJPY. It would stand to argue that the AUDJPY pair is "correlated" to the AUDUSD and USDJPY. A negative correlation implies that the currency pairs will move in opposing directions while positive correlations tend to move in the same direction. Negative correlated pairs are usually used for hedging purposes. Correlation coefficients range from-1 to +1. A correlation of -1 implies that the two currency pairs will move in opposite directions every time and vice versa if the coefficient is +1. In the past, at this stage of the conversation, I would have switched off looking for how to exit the group, but read further as we further dissect this further. What i have come to appreciate is that you don't have to fully get it the first time, but it will make sense as you progress.
So correlations are usually tabulated and presented in different date ranges, namely daily, weekly, monthly, 6 monthly and yearly. A simple example of the EURUSD against USDJPY pair would look like:
DAILY +0.44
WEEKLY -0.42
MONTHLY -0.34
6 MONTHLY -0.55
YEARLY -0.85
interpretation
Over a period of one year the EURUSD had a strong negative correlation against the USDJPY, meaning that 85% of the time when the EURUSD went up the USDJPY went down. Conversely over the daily time period these pairs were positively correlated. This example was also deliberately drawn up to show the correlations do not always remain the same over time. From the example the effects BREXIT might cause the temporary positive correlation on the daily time range among many other economic factors taking place in Japan.
SHOW ME HOW TO MAKE FROM THIS!
Now we have some understanding of correlation in forex pairs, here's how the "mashed potatoes mixes with the gravy". We know that the EURZAR and the USDZAR have a very strong positive correlation(I am biased on ZAR: South African Rand since i'm the mother continent), so trading trading on both pairs might not be advisable as it simply doubles your exposure. For instance you buy 1 lot of EURZAR and the same on USDZAR, knowing that these pairs are likely to move in the same direction, will simply double the chances of you losing more if the trade goes against you and vice versa. Lets say you try to get a "one up" on the market like what i tried to do when I started trading by going long on EURZAR and short on USDZAR at the same time. Well my friend that is a contra-trade (a trade that cancels the other) and most of the time you will end in a loss. You might be asking how you will end in a loss if the trades cancel out each other, well firstly these pairs don't always move in the same exact pip range (because they are not 100% correlated) and they have different pip values. Trust me the math doesn't lie, I won't go into it i might lose you at this point. However pairs that are negatively correlated to the EURZAR like the ZARJPY should not take an opposite position. Since we know that when the EURZAR goes up the ZARJPY goes down. So buying (or going long on) EURZAR and selling (or going short on) ZARJPY is the same as buying two position of EURZAR. In other words we have doubled our risk.
Some people might say well that the disadvantages stated above can also be utilised to our benefit if we know how to hedge our trades and also bring in diversification. Now this conversation is the one where we graduate to the master class of the inner circle of trading pro's. a friend approached me and enlightened me to the fact you can also diversify your trading portfolio, especially if you have a directional bias on a particular pair. Say, for example, you believe that the ZAR is entering a bullish season, you can diversify by putting a buy(going long) on EURZAR and USDZAR knowing fully well that the American economy has a different bias than the European monetary authorities, therefore by spreading risk between EURZAR and USDZAR will lower losses if the USD goes in the opposite direction quickly, allowing you to adjust your portfolio. This learned friend of mine went on to explain that for pairs that are negatively correlated, like the EURZAR and the ZARJPY can be used for hedging purposes through the use of the different pip values ( PIP is the smallest move in the price of a currency pair). Hedging is the opening of a position with the purpose of offsetting any gain or loss on the other transaction. Assume the value of the pip move in EURZAR is $10 for a lot of 100,000 and the value of a pip move in ZARJPY is $8 or a lot of 100,000. Knowing this can help us hedge our exposure to EURZAR. (Please be aware that certain countries do not allow hedging)
Let say i open a position of 1 short EURZAR lot of 100,000 units and 1 short ZARJPY lot of 100,000 units. When the EURZAR increases by 10 pips, the 1 would in a loss of $100 (number of PIPs X Value per PIP). However, since ZARJPY moves opposite to the EURZAR, the short ZARJPY position would be profitable, nearly up to $80 (this is due to the strong negative correlation). This would turn the net loss of the portfolio into just -$20 instead of the full $100. On the flip side this hedge also means smaller profits in the event of a rally down in EURZAR. However, in the worst-case scenario, losses become relatively lower.
CONCLUSION
All traders regardless at which stage you are, from novice to grand-master, there is need to have an appreciation of correlations and how they affect your portfolio. work towards:
1.Eliminating contra-trades (Trades that cancel each other out)
2.Diversify Risk. By not putting your eggs in one basket. By taking advantage of the imperfect correlations, one can open two positions in the same direction knowing that you limit your exposure to one pair.
3. Potentially double up on profits. In our example above, the high correlation between EURZAR and USDZAR, would mean that if you open a position one of the pairs you can open a similar position on the other pairs thus potentially doubling profits and vice versa.
4. Hedging. This usually results in lower profits, but it also minimises your losses.
5. Confirm break outs and avoid fake outs. Although I did not discuss this aspect in this article, it is the very topic that will be in my next article that i will be releasing next and will sure be topic that will result in all those finance and economics gurus offering you a 2 minute attentive silence, as they nod their heads to your insightful analysis of the markets. You might even get a "let's chat later privately and explore this in depth, or that's exactly what i was about to say". This will leave you walking a little taller, with a bounce in your step, calling shots. All i am saying is if i can do this, surely you can too.
Takunda Mudenge is a market analyst based out of Zimbabwe, Africa. He writes in his personal capacity and the information is purely for educational and entertainment purposes and should not be construed or assumed to be investment advice.
The information above was collected from various investment websites and literature and all attempts were made to make it into contemporary English.

Are we on the verge of a US Bond market drop?Hello.
My name is François Normandeau
Here is an ADX-BRIEFING related to the 10-Year US Treasury Notes.
Currently, on the daily charts,
all the indicators we are using are mentioning that the US Dollar Index
TVC:DXY
is currently in a confirmed downtrend.
Historically, there is a strong positive correlation between the US Dollar Index and the US Treasury Notes.
if DXY drops, ZN1! drops... if DXY rises, ZN1! rises... relatively speaking and all things being equal
If anyone is currently keeping a major long position related to the US Bond market,
then this correlation is worth considering.
More details about this post, as well as a video analysis, later today, on our site.
Wishing you a great week,
François Normandeau
Institutional Research Director at ADX-BRIEFING

░░░░▒▒▒▓▓ CBOE Crude Oil Volatility Index ▓▓▒▒▒░░░░Hello.
My name is François Normandeau.
This is an ADX-BRIEFING video focused on CBOE:OVX
The CBOE Crude Oil Volatility Index (CBOE:OVX) can be used
in order to identify important trading opportunities.
Here, OVX is on the right side of this post.
The indicators we see under the price window of OVX mention when the US Oil market
TVC:USOIL
enters a period of statistically significant volatility .
We can then time it with the indicators on West Texas Intermediate
in order to determine entries and exits for actual trades.
More info can be found in the TradingView IDEA related to this post.
Wishing you a great weekend.
François Normandeau
Institutional Research Director at ADX-BRIEFING

░░░░▒▒▒▓▓ CBOE Crude Oil Volatility Index ▓▓▒▒▒░░░░Hello.
My name is François Normandeau.
This is an ADX-BRIEFING snapshot focused on CBOE:OVX
The CBOE Crude Oil Volatility Index (CBOE:OVX) can be used
in order to identify important trading opportunities.
Here, OVX is on the right side of this post.
The indicators we see under the price window of OVX mention when the US Oil market
TVC:USOIL
enters a period of statistically significant volatility.
We can then time it with the indicators on West Texas Intermediate
in order to determine entries and exits for actual trades.
More info can be found in the video related to this post.
Wishing you a great weekend.
François Normandeau
Institutional Research Director at ADX-BRIEFING

CADJPY Buy on BreakoutCADJPY completed ABCDE correction and will continue completing the move upwards. Bearish for USOIL

USDJPY correlation with interest rates in backHistorically, USDJPY has had a positive correlation with interest rates. This implies that whenever rates go down, USDJPY follows lower. However, since September this year, rates as seen on the US 10 YEAR YIELD have been rising. USDJPY was falling on USD weakness.
Interest rates are rising as the US Federal Reserve has been providing massive QE and financial help to US businesses for recovery. They are trying to manage inflation with a target of 2%.
Correlation is back
The USDJPY has been moving higher in the past week despite USD weakness suggesting that it's correlation to rates could be back.
The Reflation trade
As soon as the COVID19 Vaccine starts to roll out around the world in 2021, economies are expected to fully recover by 2023. That's just 3 years away. The US 3 YEAR BOND also shows possible recovery with rates rising since July this year.
This is very supportive of my theory that 2021 could see the YEN become weak against the DXY . The 106.0xx is possible target as the level is in confluence with the 0.382 fibonacci level of the previous Bear 🐻 run.

CADJPY Two long setups on 4HBy looking at the daily chart, I came up with two possible long setups with the first one very close to the current price.
First entry zone
A bit aggressive. I will pay close attention to it.
Second entry zone
This one is more comfortable from my side.
CAD is a commodity currency which correlates with crude oil. JPY is a safe-haven asset. Normally investors tend to flood into the currency against the backdrop of uncertainty. Now, news pertaining to vaccine is good. US election is done. The recent 2nd or 3rd wave of covid-19 loom the future economy, other factors seems favor the currency pair.
So let's see!

Are Gold and Bitcoin no longer friends?This is a brief educational post.
See the parting of ways between Gold and BItcoin.
We won't know if this means anything. But it's one to watch. This could be a short term separation.
Stay safe. Don't burn cash. Avoid FOMO. Have a good weekend. 👍😃🙏

Forex Pairs Correlation: Avoiding Contradictory TradesHello, in this post I will be talking about Forex Pair Correlations. A problem new traders frequently find themselves in is opening/having positions that are contradictory. I will elaborate on that but for now, let's understand first what correlation is. A correlation is a statistical relationship which means that when A moves a certain way, B will move a certain way. The stronger the correlation, the more likely that the price will move along with each other/opposite of each other. There are 2 types of correlation; Positive correlation which is A and B will move together, and negative correlation which is A and B will move opposite of each other. Now that we understand what correlations are, I can address the problem that new traders have. Contradictory positions: For example, having a long position in GPBUSD and a short position in GBPJPY is contradictory since these 2 pair has a 87.5% correlation which means 87.5% of the time, it will move together. As you can see in the graph, when the GPBUSD (Blue) moves up, GBPJPY (Orange) moves up and vice versa. This applies to moving down as well. GBPUSD (Blue) and AUDNZD (Yellow) is an example of a negative correlation (-69.7%). My recommendation to avoid having these problems is if you do not yet have an understanding of which pairs will move up and down together, check this website: www.myfxbook.com This website will show you every pair and its correlation. Of course, there are some exceptions to when contradictory trades are fine like when hedging against each other or when 1 trade is short-term/intraday/scalping, looking at the smaller trends and the other one is swing trading/position trading looking at the bigger trend. However, I do not recommend new traders to hold/open contradictory trades until they have some confidence in what they are doing.
Main points:
1. A correlation is a statistical relationship which means that when A moves a certain way, B will move a certain way.
2. Positive relationship = Pairs will move the same way.
3. Negative relationship = Pairs will move the opposite way.
4. New traders should avoid contradictory trades.
5. Website for checking correlations: www.myfxbook.com
Please give a thumbs up if you agree with the educational post and if there are any questions, feel free to comment down below.

UNDERSTANDING HOW DXY AFFECTS EUR/USD AND OTHER DXY PAIRS.Understand the correlation and you will understand overall trend.

DXY (Dollar Index) Monthly analysis - Market Structure : Nov 202The monthly analysis is a very useful barometer of understanding where Weekly and Daily charts could be headed next.
Once we know how DXY is going to move - corresponding correlations can also be anticipated for GBPUSD, EURUSD, USDCAD, USDCHF, etc.

Ascending Triangle breakout for GLXY?GLXY appears to have broken flush to the upside out of an Ascending Triangle, if there's a retracement in the near future it would be ideal if the horizontal blue line of the pattern turns into support.
On the KST there's a noticeable bullish cross.
Higher highs & higher lows on the RSI.
GLXY is outperforming Bitcoin on a 1-year time frame by over 300%, but notice the close correlation on this chart between BTC & GLXY, BTC is the yellow line.

USDCAD 120pips LONGwe can see that the price pulled back
for a moment now it is time for long.
20-day moving average *support*
the price near support and stoch rsi
signaling bottom.
so let's see what we can get.
Happy trading !

Bitcoin the correlation with bonds & stocks cannot predict 20k!Bitcoin : The correlation with bonds & stocks cannot predict if it will deliver 20k soon!
In response to :

AUDNZD SUPPORTS S&P500Hello traders!
AUDNZD and S&P500 are in positive correlation, not tick by tick, but mostly they are moving together. Even when we see a deviation, they sooner or later somehow catch up each other.
Well, after recent mess up and down on S&P500, seems like it remains bullish, it's just in consolidation mode before the uptrend resumes and it can be easily supportive by AUDNZD currency pair, where we see a quite clear three-wave corrective decline within uptrend. It's mainly because of strong Australian Dollar in risk-on sentiment.
So, with current strong bounce on both, AUDNZD and S&P500, seems like we will probably see them back to highs in the upcoming days/weeks, especially if AUDNZD starts breaking above channel resistance line. Generally speaking, stocks remain bullish, so as Aussie in risk-on sentiment, we just have to be aware of short-term, intraday corrective pullback early next week.
Trade smart!
If you like what we do, then please like and share our idea.
Disclosure: Please be informed that information we provide is NOT a trading recommendation or investment advice. All of our work is for educational purposes only.

Is Bitcoin Decoupling From Stocks?If we learned anything in March, it’s that Bitcoin can be susceptible to selloffs in the broader market. However it’s been bucking that tide recently.
This chart compares BTCUSD with the S&P 500. Notice how it’s advanced since October 12, while SPX has skidded lower over the same period.
This pushed the 10-day correlation down to -0.7. That’s the lowest since late August, but even that moment wasn’t very comparable because stocks were climbing and volatility was calm. The correlation ended simply because BTCUSD paused as the broader market rose. Most other correlation breakdowns historically are similar: BTCUSD fell or stalled as stocks rallied.
The current price action is much less common: BTCUSD is actually going up as SPX goes down.
It follows a potentially bullish supply/demand dynamic. Rising coronavirus cases and a lack of stimulus increase the odds of more central-bank easing. (Just this week the ECB took a dovish turn.) Meanwhile, institutional adoption has accelerated.
BTCUSD continues to consolidate at its highest levels since the bear-market peak in June 2019. Interestingly, the current range closely matches the shooting-star tail from June 26, 2019. (The space between the high and close, shaded on this chart.) Unlike before, BTCUSD is holding this price range and apparently squeezing into a range, with an outside day on Wednesday and an inside candle yesterday.
So far, it seems to indicate the leading crypto is holding up much better than the stock market. This might not remain the case for long, but it is now.
TradeStation is a pioneer in the trading industry, providing access to stocks, options, futures and cryptocurrencies. See our Overview for more.

Strange Correlation Between USD and African RandThe correlation between the African Rand and USD ( FX:USDZAR ) is super strange. During both the 2008 and 2016 crisis, we saw the African Rand pump an average of about 50%. Coming into 2020 we see the rand up about 35% with an expected 15-20% move up inbound. Do not trade this, this is my personal take on this and well... I definitely wouldn't take a 19 year old serious if I were you.
Drop a comment and share your thoughts! Thanks
DotcomJack

Long term correlation of Copper Futures with $AussieThe strength of the Aussie Dollar is partly driven rising resource prices including rising Copper Prices.
