CorrelationStrong correlation between NEO & BTC , With a bit of time difference !!!
When you want to trade NEO ... check the Bitcoin analysis
Correlation


How does the Stock Exchange relate to BTCUSD's price?Redline: VIX
Purple area: DJI Index
Blue area: BITSTAMP:BTCUSD
www.cnbc.com
"Autonomous Next also estimates that the "crypto-funds" have about $2.3 billion in total assets under management."
When BTCUSD/DJI Index correlation started to really correlate: 15 Nov. 2017.
"Billionaire Investor Novogratz: Institutional Investors Will Soon Adopt Bitcoin"
www.bitcoinisle.com
November 14, 2017
"Massive Hedge Fund Likely to Begin Trading Bitcoin"
www.bitcoinisle.com
November 15, 2017
"How High Bitcoin Could Reach Before The Average Investor Sells It?" (author has interesting articles)
www.forbes.com
"Breaking: CME Group to Test Bitcoin Futures Next Monday, Price Hits $7800"
www.bitcoinisle.com
November 16, 2017
Sidenote:
"Breaking News: Segwit2x Fork Cancelled"
news.bitcoin.com
November 8, 2017

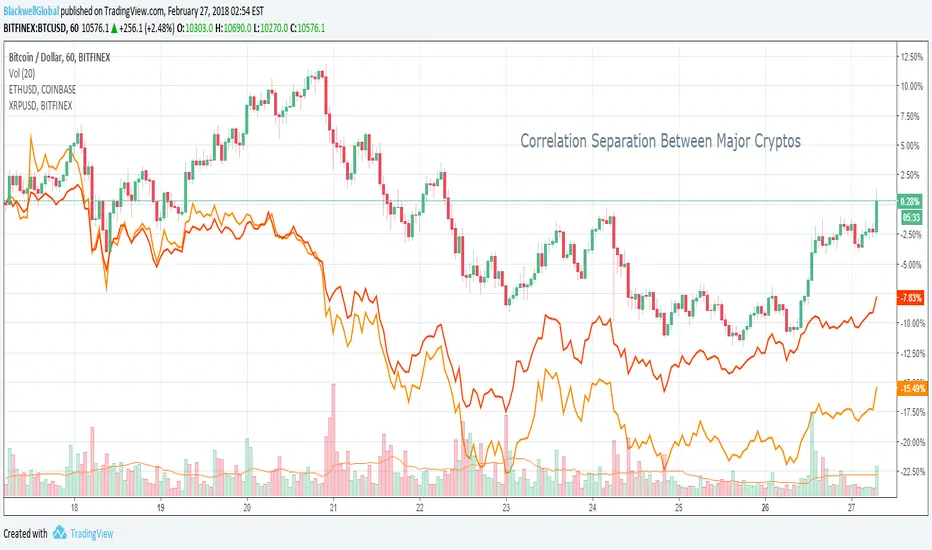
Correlation Separation - Bitcoin, Ethereum & RippleInteresting to see the shift in movements between the major Crypto Currencies. Trading leveraged products is risky.

Is IOTA following NANOcurrency?There seems to be a similar pattern forming between Nano (formally RaiBlocks) and IOTA vs BTC.
Both use similar technologies, or are at least crypto-currencies using ledger technology other than blockchain.
Nano seems to be the most bullish of the two with more activity in the current new cycle, Binance trading, Rebrand but also FUD regarding Bitgrail Fiasco.
If the assumption that IOTA might be following NAno is true, IOTA is about to see another pump cycle soon.
Please let me know your thoughts and comments guys. What do yall think of DAG and Tangle?

BTC becoming tech-as-usual (Loosely, for now)
On this chart:
BTCUSD (candles)
NASDAQ Composite (blue stepped line) for (loose) reference
BTC Moving Average (white: 50D, Orange: 150D, Yellow: 300D)
BTC Trends (Green: UP from lows, Red: down from highs)
BTC Fib retracement from 2017-12-17 ($19891) down to 2018-02-06 ($6000)
BTC Fib retracement from 2018-02-06 ($6000) down to 2018-02-20 ($11788)
It never was a crash. I repeat: this was not a crash . It was a healthy correction, which we'll call a sanity/reality check .
It seems like the end of an era, which we'll probably come to know as the "innovator" phase in the S-cycle of cryptocurrencies .
"Consideration" has ended and we and have begun "investigation" of DLT (Digital Ledger Technologies, a.k.a "cryptos" for the layman), as illustrated by the intensified interest of officials (from authorities to public systems-makers, e.g. governments and central banks). Bitcoin and friends are no longer exotic libertarian proofs-of-concepts; more specifically the underlying tech is about to become yet-another-department in most states and corporations. Job offers are rising fast. We'll soon see a slew of degrees as early standardization takes place.
There is one implicit (albeit loose, nascent) correlation that we can observe emerging during the last six months. I've displayed the NASDAQ Composite (Stepped Thick Blue line) on the chart. It's pretty obvious that BTC no longer makes moves in a pure vacuum. Some will say that Futures helped movement correlation; I won't speculate on the why and will leave it at the how for all to subjectively see.
Next, let's observe the untenable rise (Frenzy) that peaked on Dec, 17 ($19891). I've retraced the Fib (called 6 shades of red... appropriate don't you think? ) down to the low ($6000 on Feb, 6) fifty-one days later. Guess what the 50 Days Moving Average (White line) is currently tangential to? You've guessed it, the big fat downtrend line from said peak (Dashed Red line), which two days ago crossed the 38.2% retracement (Red Arrow) . Just this market's way of telling us that no, this X-mas spike shouldn't have been , were we rational. This is FOMO/FUD for you, and again, let's leave it at that. If you're trading, you know: General Public + Hype(r) Media = Spiky Charts . Name of this game.
They thought that for crypto, sky wasn't the limit? That it would go above and beyond, to the moon ? Well, guess again: this white moving average is well-deserved cloud-line. Above: high HODLERS , below: sentient beings. Leave the damn moon alone! Now when we cross the cloud line, eventually, we'll do it as it should be: like a cruising jet-liner. Safe, steady, and sound.
The 150D Moving Average (Orange line, like bitcoin's logo, that must mean something right? ) is boring. It's exactly where we stand in price now (Orange Arrow; I chose that value for this very reason, 150D = 5 months, back to late September's low point before we hit mainstream media). It's the one line that's real in this chart, the chosen one that deserves to cross the red downtrend, and breakout from the Fibonacci's.
Lastly the 300D Moving Average (Yellow line) meets the long Up Trend (Dashed Green line) right when it meets the price (Feb 6, green arrow). This is the best candidate for a sane base valuation of BTC: I have no doubt that it isn't worth any less on that date. Call it a baseline support for DLT .
(In the first comment below I'll quickly discuss Volume Profile, in conjunction with averages and retracements.)

Inverse Correlatoin Between DGD (DigixDAO) vs BTCThe graph above shows a comparison line chart between DGD (DigixDAO) vs BTC over the last 30 days.
As you can see the correlation between the two is quite significant. It's not a -1 inverse correlation against Bitcoin so it's by no means a perfect hedge against a drop of BTC but good enough to trade on we think.
To test this "theory", we thought lets put on a trade for DGD/BTC when BTCUSD is weak and dropping. So that's what we did this Wednesday:
We've entered DGD/BTC after it clearly broke out of its equilibrium/triangle pattern and was also when BTC/USD broke through a support level.
The drop of Bitcoin last Wednesday wasn't that severe when we've entered the trade cause BTC dropped quite a bit already hours before but with our trade, we've managed to make about 6% in a short amount of time.
DigixDAO or Digix (DGX) is also an interesting project/coin. Digix tokenizes gold on Ethereum. Every DGX = 1 Gram of gold.
You can own, save and transact Gold in tokenized form - keeping secure private ownership of your digital assets. Basically, you can see it as digital gold.
This inverse correlation is much like the inverse relationship between the stock market and the gold price. When the stock market drops (heavily), gold price tends to rise and vice versa.
You can trade DGD/BTC on several exchanges but the mean exchange with by far the most trading volume is on Binance.
So try it out yourself next time when BTC drops again. We think it's one of the best ways to profit from a drop in BTC and "hedge" your Bitcoin position against it without having the option to go short or with margin trading.
Please like and share if you found this informative and helpful. Leave a comment if you have any questions.
And until next time, good luck with your trading!

DGD vs BTC through December Peak and January/February CrashesWhen BTC spikes and drops in value many coins suffer and never recover. DigixDAO's purchasing power continues at a steady rate regardless of December's BTC peak and responded inversely to BTC's crash in early january and late February.

Top 5 Coins With Strongest Recovery RecentlyOn the 6th of February, the Bitcoin has tested the lowest price since correction from USD 20k resistance started. Price dropped to USD 5.9k and corrected upwards, while during the past few days it reached USD 8K, re-gaining 40% against the USD. Is it a quite strong recovery and perhaps the end of correction?
Nevertheless, some coins corrected up much stronger than the bitcoin and below is the chart presenting the winners.
INTERNET OF PEOPLE (50% Recovery against the Bitcoin)
FUNFAIR (43% Recovery against the Bitcoin)
DECENTRALAND (37% Recovery against the Bitcoin)
POWER LEDGER (34% Recovery against the Bitcoin)
GLOBAL CURRENCY RESERVE (32% Recovery against the Bitcoin)

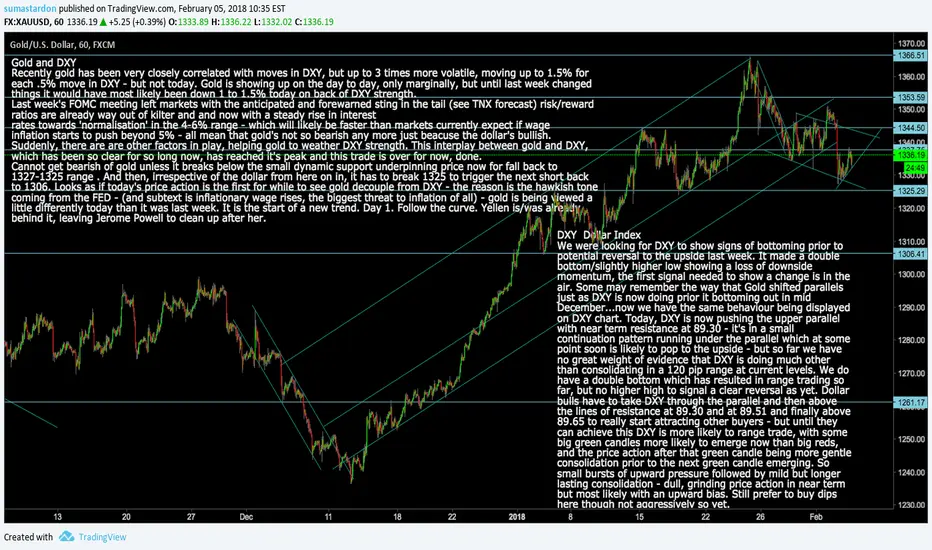
Gold and DXY: Correlation Shows first signs of breakingGold and DXY
Recently gold has been very closely correlated with moves in DXY, but up to 3 times more volatile, moving up to 1.5% for
each .5% move in DXY - but not today. Gold is showing up on the day to day, only marginally, but until last week changed
things it would have most likely been down 1 to 1.5% today on back of DXY strength.
Last week's FOMC meeting left markets with the anticipated and forewarned sting in the tail (see TNX forecast) risk/reward
ratios are already way out of kilter and and now with a steady rise in interest
rates towards 'normalisation' in the 4-6% range - which will likely be faster than markets currently expect if wage
inflation starts to push beyond 5% - all mean that gold's not so bearish any more just beacuse the dollar's bullish.
Suddenly, there are are other factors in play, helping gold to weather DXY strength. This interplay between gold and DXY,
which has been so clear for so long now, has reached it's peak and this trade is over for now, done.
Cannot get bearish of gold unless it breaks below the small dynamic support underpinning price now for fall back to
1327-1325 range . And then, irrespective of the dollar from here on in, it has to break 1325 to trigger the next short back
to 1306. Looks as if today's price action is the first for while to see gold decouple from DXY - the reason is the hawkish tone
coming from the FED - (and subtext is inflationary wage rises, the biggest threat to inflation of all) - gold is being viewed a
little differently today than it was last week. It is the start of a new trend. Day 1. Follow the curve. Yellen is/was already
behind it, leaving Jerome Powell to clean up after her.
XRP/BTC/USD CorrelationsXRP with BTC have different relation in correlation. I find nice website with correlation and sentiment analysis (cointrading.ninja). i cant put full link, as i will be banned for advertisement. There can see changes in big list of coins for , 7 days, 1,3,6,12 month.

95% Opposite correlations with BTC in USNBTThis is only one coin which i can found, that have 95% negative correlation with BTC. All life of this coin is down trend, with huge spikes. No matter how you gonna move chart or zoom in or out, there strength mirror.

Top 3 Most Consistent CoinsDuring the past couple of month, the crypto market has been going through two major phases.
The first phase, that took place during December 2017, was a strong uptrend amongst most coins, substantial growth, and almost a non-stop rise.
The second phase, that took place During January 2017, was a consolidation phase, where most coins have been correcting down strongly or consolidating.
But there are coins with a better performance, that have shown great stability and consistency during both phases. While most coins were suffering they proved to be the most stable in comparison to the rest cryptocurrencies.
And the winners are:
0X
EOS
NEO

Top 5 Coins With Best Performance During ConsolidationIt was a great rally across many cryptocurrencies during the past months. There was a huge growth by some coins, gaining x10, x20, x30 or more, where most cryptocurrency traders were profiting disregarding the coin of their choice.
However, there are always times of consolidation or a correction. And this time is now. The cryptomarket is not stagnating, which means that the coin either consolidating or correcting downwards.
But it does not happen to all coins because some will be always better than others and in the idea you can see the top 5 coins that had produced the biggest gains during January consolidation period.

EOS - The Most Consistent GainerEOS trully is one of, if not the most consistent gainers amongst cryptocurrencies during the past 3 months. It managed to outperform the Bitcoin by a 1400% during that period and it does not seem to be over yet.
Price continues to climb up rejecting the Gann Fan trendline. Currently, the nearest target seems to be at btc 0.0015 which could be achieved in the shorters period of time. This is the resistance level confirmed by two Fibonacci retracement levels 141.4% and 927.2%. This is the key resistance for EOS/BTC and should be watched for either a rejection or a correction, which could provide clues about further EOS development in the short term.

BITCOIN "CRASH" really a crash? Two possible scenarios!Hey tradomaniacs,
I know i know.. take a deep breath and chillax.
Everyone is talking about the bubble..the CRASH.. the DEATH of Bitcoin & Co.
Well..since we had this strong hype that was almost utopistic everyone felt like Bitcoin & CO were unstoppable.
But why? Why would you think like that? Because we have a big market of players with no freaking clue how the market, the psychology, and this entire world works.
Unexperienced gambler were those who let the pros win this game. And what we see is people who were buying at BTCs peek and consolidation-phase.
Now it`s time to let them regret to even think about investing in Bitcoin! Right? This is how the market works.
Of course.. I sound naughty. But this is how this game works. If you win, someone else loses. You buy, someone sells. You sell - someone buys.
We know that this "Crash" which is obviously a joke compared to this awesome but unhealthy rally we had is also caused by bad news from china and sout korea.
BTC has still its scale-problems a lot of teams are working on. Buzt are we patient enough?
I like this paradoxal phenomenon that we are the ones who are afraid of the crash but CAUSE that crash with SELL- orders not willing to invest in other COINS which could give us nice "hedge-possibilitys" to diversify and still be able to make profits when BTC drops. But.. the market is irrational.
What we see is still a joke of a "crash". As long as we hold the primary trendline plus the 200 MA it`s still all good. We had a 257% run within 35 DAYS after the last "crash" down to 5.500 USD which is crazy compared to this high price per BTC we actually have/had. Now we had a 48% loss within 35 days. You should always see that "correction" or "crash" in relation to the climb we had.
We might test the 10k.
We might climb back to 20k.
We might consolidate.
We might drop down to 8k.
But we still see a nice profit we had after this rally. ;)
Just chill.. get a plan and strategie. It`s not worth to die by a heart attack because you check your blockfolio every 5 Mins. ;-)
May we shall start with an ecosystem and start to stop thinking the the entire Cryptoworld dies with its King called Bitcoin.
May we should start to invest into alternatives? Like Altcoins? ;-D
Piece and good trades,
Stay calm!


ComparissonLooking at Bitcoin in it early year, when it started rising toward 1k mark.
AND
Now lookng at Ethereum in 2017, we see the similarities!
Does ETH is engaging in the same kind of epic trend that BTC as seen in the past months.
1K. would it be the psychological lvl that we could call,
The final "high school exam" of a coin. Hes passage to the adult age? A sign for the community of the quality of a project ?
Haha ;) Let me know what you think!

Here we go again - BTCUSD Correlation is once again high...Sadly we are once again entering a down trend. Once again correlation with BTCUSD is consistently on a high level.

Crypto index correlation with BTCUSDLooking at the graph it is clear we are still trying to recover. in the pas, when BTC is struggling most of the remaining coins start to correlate in a high degree with BTCUSD. This graph shows the correlation against 9 other large coins. This graph is based on my previous top 10 index chart, minus BTC this time.
When bitcoin starts to recover the market will go back to normal and stop correlating consistently over time.
The indicator i have used bellow is called Bitcoin Correlation Indicator, over 5 periods.

BTC's dominance has strengthened -- ETH, LTC, XRPSince 11 of Nov, since the big rally of BTC , based on correlation to BTC, it is strongly visible that LTC, ETH and XRP act somewhat differently.
While before they were not so dependant on BTC, by now they are: PCCs to BTCUSD: LTCUSD 0.9 , ETHUSD 0.7, XRPUSD 0.46
BTC's dominance has strengthened, if BTC falls back, they all are likely to fall back. LTC's correlation is super-strong, ETH's is strong, XRP's is medium.
XRP's correlation is falling: is XRP getting on its own way and becoming an independent player? (Or just getting out of the whole game?)

GBPNZD bearish long termBearish Bat pattern on the daily could lead price to blue trendline. Wait for a flag pattern before entering with simultaneous RSI confirmation. Since this week is full of Interest Rate decisions, please pay close attention to correlations between your trades to diversify your risk.
1) Never risk more than 2% of your account.
2) Try to be emotionless by applying your strategy to the pip.
3) Invest to yourself and then your capital. Try to educate yourself along with the signals and enhance your risk intelligence and your perception on how Markets work.
4) You do not have to be extremely precise to be highly profitable as long as you take the set-ups with big R/R.
