For EURUSD, 1.3580 must be touched.Based on the correlation between AUDUSD, EURUSD, GBPUSD and USDCHF, 1.3580 is a to be soon expected target for EURUSD
Correlation

NZDUSD might look fantastic for sellHello guys
USD is strong pair at the moment. All USD pairs are moving in correlation so we should take advanta of it as we already did with usdjpy in previous analysis.
In this scenario sellers broke important lower low level, which was improtant for us to take advantage of it.
We draw you a new support level at 0.67025 which presents safe entrance. If price can broke through this support level, you can sell position. Overall target is at 0.65941.
For elite members; you can easily entrance before, around spot price is at the moment, but we still need more data. Once we get clear facts, see ya in our chat.
Check also previous NZDUSD analysis

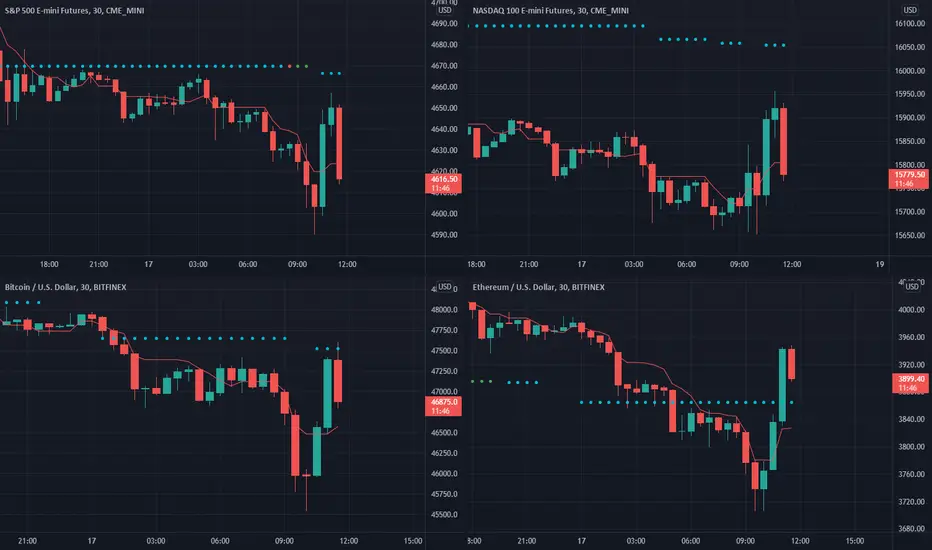
Crypto Correlation Continues with the Stock MarketAs I have noted in recent posts... during the US trading hours cryptocurrency price action follows a highly correlated pattern. They move almost in step with one another as risk assets that are speculating on interest rate changes of the future.
I have always lamented this occasional correlation as crypto SHOULD BE an uncorrelated asset class.
Where is Lower Low? Let's see if data can give us what we wantDo you think buyers have control, or sellers are still taking place at nzdchf?
We are looking this trade as a strong sell
Daily overall market sell
NZD correlation
trending sell
H4 buyers failure
D1 Lower Low failure
Continuation trending idea
Happy to share with you all
Cheers

DXY AND BTC CORRELATIONDXY just broke to the upside out of a bull flag and did a S/R flip. This is correlated to the FED news last week and last week.
BTC broke to the downside when the FED news came out.
I have my buy zones no matter the outcome because as an investor I am focusing on projects to disrupt the world.
As a investor I am focusing on the long term 2024-2030.
But it is great to see how the markets act as a trader and act as a investor.
Not Financial Advice.

CORRELATION COEFFICIENTS on FOREXHello everybody!
Professionals have been aware of correlation for a long time and use it profitably. The essence of correlation is not difficult to understand and using it in trading can significantly increase your profit.
Correlation coefficient of currency pairs – what is it?
Correlation is a statistical relationship between two or more random variables.
The correlation coefficient is an index of the interdependence of quotations of different currency pairs.
Correlation of currency pairs is divided into two types: direct (positive) and inverse (mirror or negative).
A positive correlation is a similar movement of quotations of different currency pairs.
Inverse correlation is the reverse movement of the exchange rate of different currency pairs.
For example , EUR/USD and USD/CHF are in a mirror correlation because both European currencies are against the dollar. Any change in the euro affects the franc exchange rate and vice versa, on the chart, the price of the euro and the pound moves the other way around because in the EUR/USD pair, the dollar is in second place, and in USD/CHF in the first.
Method
Analysts have come up with a method that makes it easier to understand the correlation, it is called the correlation coefficient. Using it, you can understand in which range each pair is relative to the other, where +1 is a complete correlation, and -1 is the opposite. The stronger the link between the economies, the stronger the value tends to unity.
Let's consider the main ranges of coefficient values and their impact on the currency pair:
• 1 - Denotes the same movement of currency pairs.
* From 0.9 to 0.5 – High dependence of currency pairs among themselves.
* From 0.5 to 0.1 – There is a decrease in correlation.
* 0 – There is no correlation, the instruments do not depend on each other.
* From 0.1 to -0.5 - Characterized by a decrease in correlation.
* From 0.5 to -0.9 – An increase in correlation and a change in the direction of movement of currency pairs in the opposite direction.
* -1 – Inverse dependence of currency pairs. One price is going down, the other is going up.
Trading options
Novice traders often think that they reduce risks when they invest in different currency pairs, but at the same time they do not understand that a large number of pairs correlate with each other. Forgetting about the correlation, you can start getting double losses.
Correlations can be used to confirm signals.
For example , the analysis of the EUR/USD chart showed growth. To make sure that the forecast is correct, you need to get a reverse confirmation for USD/CHF.
Sometimes, to confirm trading signals, a comparison of three assets that are minimally related to each other is used. Take for example EUR/USD, USD/JPY and EUR/JPY.
• If EUR/USD is predicted to go up, then the forecast for the reverse currency pair USD/JPY should signal a fall. In the event that there is no signal for USD/JPY, then it is necessary to carefully study the behavior of EUR/JPY.
No matter what tactics a trader uses, you always need to remember about correlation and use several pairs with positive and negative correlation in the analysis to increase the accuracy of the forecast.
In addition, correlation helps to hedge transactions. Having decided to invest in one currency pair, you can divide the investment amount into two parts and invest the second part in a currency pair with
Time interval in correlation analysis
The correlation has the ability to change depending on time. It may be that the daily correlation = 0.6, but when switching to a monthly interval, this value increases and shows a strong correlation.
There may be an inverse situation, when the correlation drops relative to the selected interval. Pay attention to this when analyzing.
Traders, if you liked this idea or if you have your own opinion about it, write in the comments. I will be glad 👩💻

CRYPTO MARKET CAP & COVID19 DEATHS - Conspiracy?! Coincidence!? Hi, this is CRYPTOFILIO, your dark knight in the lightness!
This nugget of truth is about DEATH and CRYPTO..... Almost as correlated as death and taxes...
The blue line is the crypto total market cap and the yellow line is COVID19 DEATHS in the US (same scale and percentage). I'm not saying crypto causes covid or covid causes crypto - or eggs cause chickens or chickens cause eggs.
Can you handle my cold hard crypto factoids, while I handle your warm, soft....
If a star fell from the sky every time I thought about you, then the sky would be empty... And, consequently, billions of innocent aliens, whose planets fell out of orbit... would suddenly die.
Think about these deep thoughts for your shallow life!

BTC PRICE WILL GO UP: citing recent low BTCUSDT/SPY correlationI think the price of BTC/USDT will go up due to the recent low on the SPY / BTC-USDT correlation.
I am open to discussion. Thanks.

JICPT| Omicron, VIX, BTC and global marketsHello everyone. What a volatile week for investors. I just got the time to write down something after a busy week.
First of all, Fed turned to be hawkish. Taper may be accelerated according to what the Fed chair said earlier this week. In addition, He said transitory should no longer be used to describe inflation. It seems fed started to realize inflation became an issue. What feared the market is that rate hike may happen much sooner than expected.
Secondly, the first case of omicron variant of Covid was detected in U.S on Wednesday. That's another blow to the market caused by uncertainty . I see VIX continues going up after the downtrend line got violated last week. Also, the weak economic projection has been reflected in the US 10Y yield. I see it went all the way back to the old range(0.994-1.386). So far, we still need at least 2 weeks to understand the features of omicron, especially, if it can make the current vaccines less effective . If omicron intensifies the severity of the situation, fed may postpone the rate hike.
Thirdly, it's job data released on Friday. Nonfarm payrolls increased by 210K in Nov. ,well below the wall street estimation of 573K. Market shrugged off the data at the first place, then turned negative at the open. Nasdaq was down more than 300 points.
I did some research on the relationships between inflation and S&P 500. Guess what, high inflation doesn't mean weak broad market index.
inflation S&P performance
1980: 13.5% 25.8%
1979: 11.3% 12.3%
1974: 11.1% -29.7%
1981: 10.3% -9.7%
1978: 7.6% 1.1%
1977: 6.5% -11.5%
1973: 6.2% -17.4%
1982: 6.1% 14.8%
BTC is another asset I want to discuss here. After the institution joined in, its the correlation with stock market became very high. With limited liquidity, volatility is expected to be high until it reaches attractive buy zone.
Finally, I'd like to recommend a potential buying opportunity for Nasdaq around 15200 where the long-term MA meets demand zone. The long-term MA in red color has been respected well since April of last year.
Give me a like if you're with my view. Thank you for your support.

Cryptocurrency correlation with BTC, ETH, NASDQ and S&P 500This chart is intended to help visualize the possible correlation of a cryptocurrency with BTC, ETH, NASDQ and S&P 500.
It was designed on a daily timeframe.
The histograms are set on two different scales: the darker one on 7 candles and the lighter one on 30 candles.
When the histogram is above the zero line, the correlation between it and the main asset is positive.

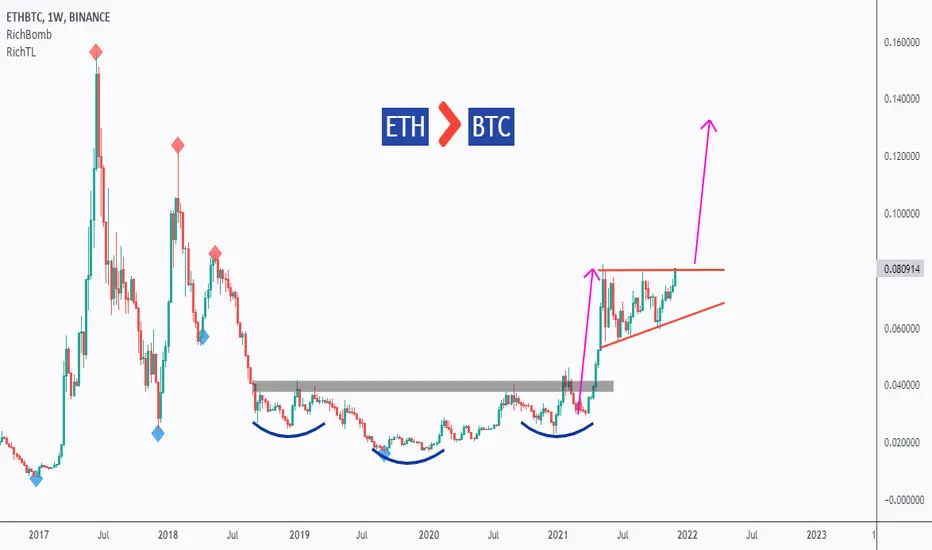
BTC is Powerful, but ETH is a Beast!Hello TradingView Family,
I found ETHBTC chart interesting. Here is why.
First, we had an inverse head and shoulders formed around 0.01-0.02 demand zone, then the bulls took over by breaking above the gray neckline.
We had our first impulse movement, and we are currently in a correction phase in the shape of an ascending triangle.
For the next/second impulse movement to start, we need to see a strong candle close above the upper bound / red trendline.
What does this mean?
ETH is showing strength, compared to BTC.
While BTC was trading inside a falling channel on Daily, ETH is holding its ground.
As I always say: BTC is Powerful, but ETH is a Beast!
What does a bullish ETHBTC mean?
Scenario 1 - ETHEREUM UP, and BITCOIN DOWN (just like this week)
Scenario 2 - ETHEREUM UP, and BITCOIN UP with ETHEREUM moving up more aggressively
Scenario 3 - ETHEREUM DOWN, and BITCOIN DOWN with Bitcoin moving down more aggressively
Which scenario is more likely to happen in your opinion? and Why?
All Strategies Are Good; If Managed Properly!
~Rich
BTC vs DXY - Interesting Negative Correlation!Hello everyone, if you like the idea, do not forget to support with a like and follow.
Here is the top-down analysis for BTC, feel free to request any pair/instrument or ask any questions in the comment section below.
Best of luck!

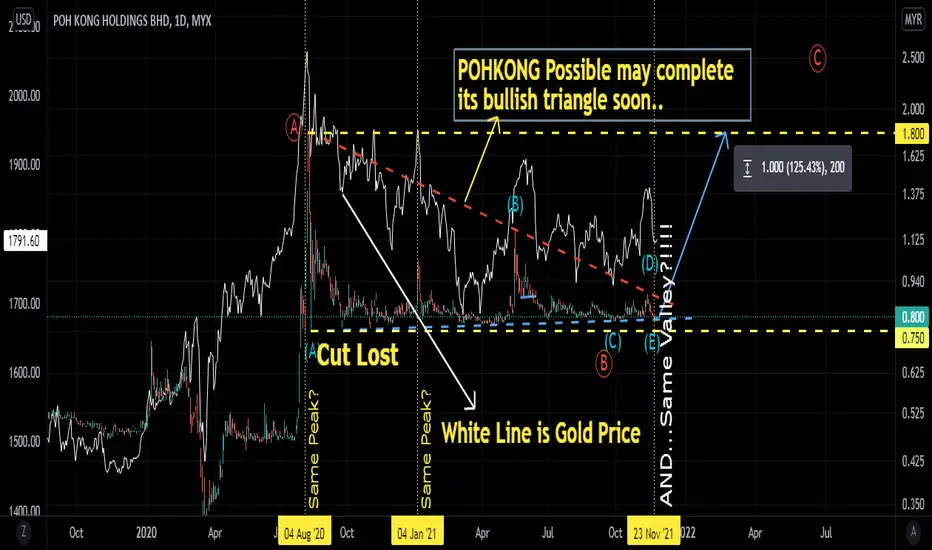
POHKONG and GOLD correlation chart. 27/Nov/21POHKONG chart seem like is going to completed its wave (E)( Cyan) of bullish Triangle soon. A potential of >125% Gain ( From RM0.80 to RM1.800 )...
An opportunity in the making on EURNZDEURNZD broke above a recent swing high in spite of NZ Bank's raising of interest rates by 0.25 points.
I think there is an opportunity in the making. There might have been a lot of liquidity above the recent high. People are putting stop-orders in this area - whether the intention is to enter in the opposite direction or to exit their shorts. If it reverses now, there won't be a technical reason why Euro would rise further since the big money are expected to load their orders in this alleged liquidity-dense area.
Central Banks Rates are in the bottom: Black ~ EUR, Red ~ NZD
Further technical view dictates the importance of moving averages. Guess what, EURNZD has just approached its 5 EMA and bounced off around midday today (Central European Time).
To support my thesis correlatively, I chose Oil and Euronext 100 which both have high anti-correlation against this pair.
You can view both Oil and Euronext under the chart. Candles are colored as follows: Purple ~ anti-correlation, Yellow ~ correlation
The oil has produced two relatively big yellow candles for an anti-correlating asset. From this perspective, EURNZD has some catching up to do in the downward direction.
I guess the logic could be that the EU needs to be spending more money to buy oil and as a result, there is more in circulation. But correct me if I am wrong - I've adopted the relational analysis only recently and I write this with the hopes that someone will help improve via insightful comments/PMs.
With Euronext, and this I am not completely sure either, I think its that the cheaper currency means easier exports for European companies. But again, I was mostly a technical guy not so long ago. Anyway, from the technical perspective, it just bounced off its 50 EMA.
I will be watching the market closely tomorrow and at some point, I would like to enter a short if the market shows some follow-up (bearish engulfing on 1D or 1H).
Good luck!

JICPT|NQ fell amid rising US10Y yield and VIXHello everyone. Nasdaq slipped by 1% amid rising US 10Y yield and VIX .
US 10Y yield : It's approaching 1.7%. The normalization rate is around 2%, however, the rising yield from historic low would weigh on the tech-heavy index. On the other side, if the growth keeps on surprising investors, that would hedge against the rising yield .
VIX: the control high around 20.7ish looks to be conquered soon. The momentum tends to accelerate if the key level is broken. It'll have negative impact on the broad market index.
Technically, the nearest solid daily demand zone is around 15927. I've set an alert to give myself a gentle reminder. I'll be a 5% correction from the recent high.

JICPT| Choppy market with rising DXY and VIXHello everyone. I started to have the feel that market is waiting for something since Monday this week. Here I got four important underlying to check as below.
1. US 10Y yield : It's a cost rate for me. Now, it's in the middle of the New range with upper boundary around 2% which is the low case of the normal range. The rising yield weigh on stock index.
2. Dollar index : DXY is definitely in the uptrend. After 94.75 has been conquered, the next trouble level is 96.86. Normally Dollar and gold moves in opposite directions, not for the past two days. I will let it go if the current price is not at the key levels. We can cross check forex pairs to identify some opportunities.
3. VIX : Vix has kissed the control low area before falling. The holder zone is below around 14.13-15.12 . The fall of t VIX will favor stock index.
4. Gold : After key trouble zone of 1835 was taken out, the target might be $1938 by applying measured move. We also need to watch $1900. That's confluence level of whole number and next control high.
Sometimes, we just wait for the best setups. No trade is also a good option in the choppy market, at least for me.


Bitcoin ATH breakoutBoth BTC and ETH had a significant levels of previous all time highs to be cleared for a bullish momentum.
ETH/USD cleared the level of 4.200usd and that has now become support.
BTC/USD is now ranging at 62.000 ~ 64.000usd (previous ATH) and there's a clear correlation to ETH/USD at the same level.
Expecting the bulls to take over during the next weeks, but being cautious at the moment until there's a clear evidence of support.
First target remains 72.000usd unless support is lost for invalidation.

USDollar Index (DXY) Analysis Hi
I hope you all are in a constant profit.
DXY on a weekly time frame is creating an exciting chart.
As you can see, if a weekly candle closes above 94.54, a significant accumulation phase is confirmed.
On the other hand, the BEXP Indicator indicates HVP is reducing and has a downtrend, so a big explosion in this scale is baking.
The interesting part is the positive correlation between DXY and Bitcoin on a weekly scale. And it's not weak as well.
Screenshot:
Thanks for your time.
Regards, Hashem.


Correlation index "ICJ" is printing the lowest # since 2018 !!According to ICJ a trough is behind us that's for sure, the question how far are we from a top such
fast and hard drops or spikes in this index are very tricky to read/analyze & just comparing it with
2018 we would understand why !!!

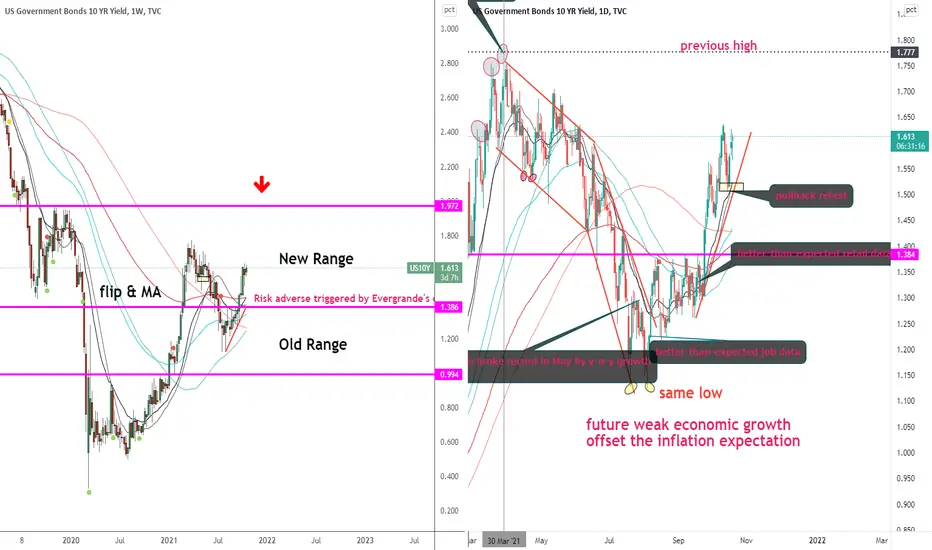
JICPT|US 10Y yield completed pullback, heading for previous highHello everyone. US 10Y yield and DXY(Dollar index) are the two I always keep close eyes on. As I mentioned previously, it's a risk-free rate that impacted a lot of things, e.g. stock valuations, loan rates.
The below line chart is one of my favorite that I created for cross-check US10 Y yield, Nasdaq and Gold. Normally, US10 Y yield goes the opposite with gold( negative correlation ). It seems gold shrugged off the treasury yield today. Then, I checked the dollar index which face strong selling pressure after recent rally. The weakening dollar index support gold to go up by around $14. Of course, there're other factors, such as inflation . The big rally of gold happened on last Wednesday was a good example.
Back to the US 10Y yield, I added notes on the daily chart. You can see that the recently movement is mainly driven by better-than-expected economic data. The pullback completion is an indication that the yield is going to retest previous high of 1.77%. But I guess the 45% degree uprising angle couldn't sustained. It need to take a break(go sideways) in the next few days before attacking previous high. Overall, the normalization is inevitable. The yield will go back to pre-pandemic level of 2%.
So, if the yield keeps going up, I don't recommend holding gold for too long(day trade and short swing trade is okie). This is in line with my previous gold analysis-the triangle pattern. You can refer details in the below linked idea.
Also, I'd prefer S&P to Nasdaq for investment as the tech-heavy index will be impacted more by the rising yield.
If the yield goes high enough, it'll result in the strength of the dollar index. Remember what happened in early 1980s? However, I don't think things will go crazy in that scale.
What do you think? Give me a like if you think the post is useful.
USD/CHF on watch for me today.USD/CHF:
• If price corrects and a tight one hour flag forms, then I'll be looking to get long with either a reduced risk entry on the break of the flag or a risk entry within it.
• If my entry requirements are not met then I will simply wait until another setup which meets my plan materialises.
• If there's any ambiguity then I will not place a trade on this pair.
