Cosmos

Cosmos Hub (ATOM) - September 20Hello?
Welcome, traders.
By "following", you can always get new information quickly.
Please also click "Like".
Have a good day.
-------------------------------------
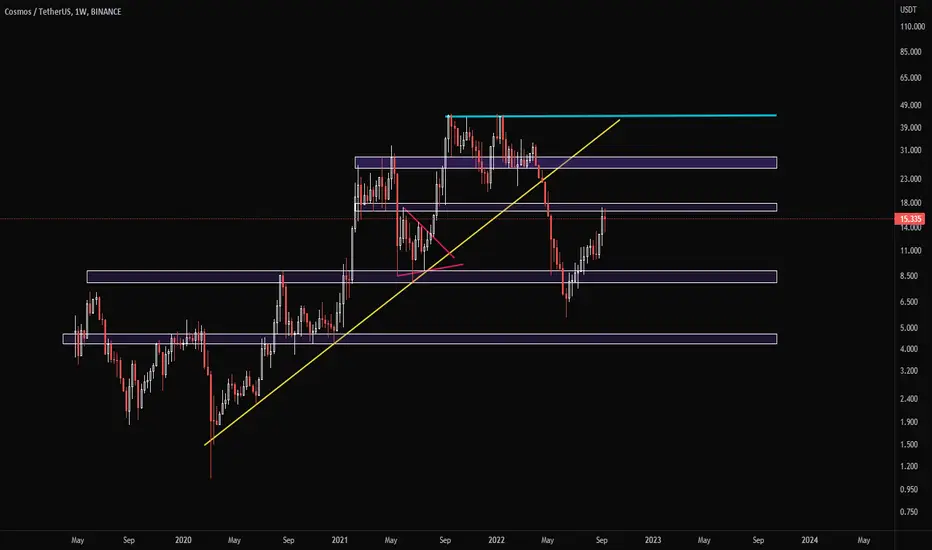
(ATOMUSDT 1W Chart)
The 12.282-15.327 interval is the interval that determines the trend.
Therefore, if the price is maintained above 15.837, it is expected to rise above 20.955.
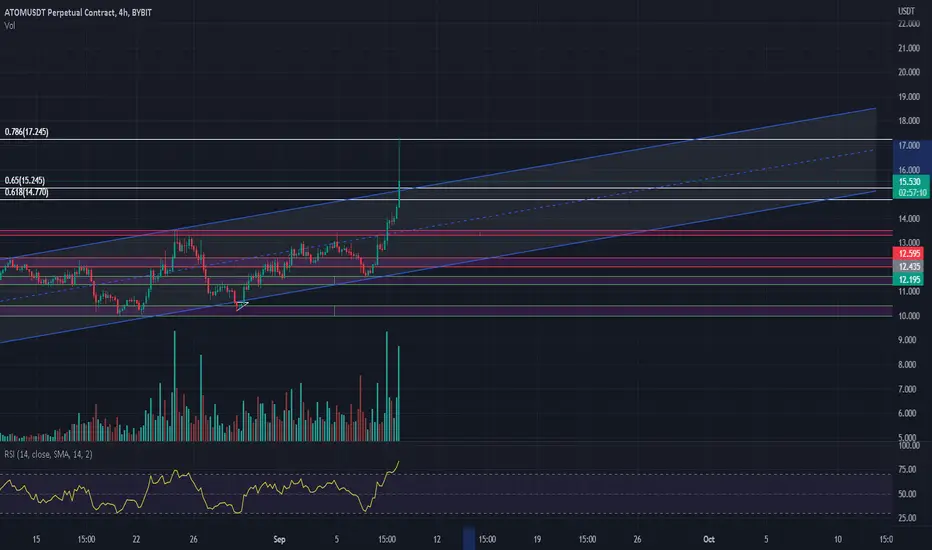
(1D chart)
We need to see if we can continue the uptrend within the short-term bullish channel.
If the price is maintained above the HA-High indicator, the uptrend is expected to continue.
So, the key is to keep the price above 15.083.
------------------------------------------------------------ -------------------------------------------
** All descriptions are for reference only and do not guarantee a profit or loss in investment.
** The MRHAB-T indicator, which is inactive on the chart, contains indicators that indicate support and resistance points.
** Background color of Long/Short-S indicator: RSI oversold and overbought sections
** Background color of CCI-C indicator: When the short-term CCI line is below -100 and above +100, oversold and overbought sections are displayed.
** The OBV indicator was re-created by applying a formula to the DepthHouse Trading indicator, an indicator disclosed by oh92. (Thanks for this.)
(Short-term Stop Loss can be said to be a point where profit and loss can be preserved or additional entry can be made through split trading. It is a short-term investment perspective.)
---------------------------------

~$11 ATOM before relief bounce?Picture paints a thousand words, if ATOM breaks the neck line of $13.3, down to $11.45 which is also the 0.5 fib retrace before expecting any bounce.

ATOM/COSMOSHitting the resistance here, I think the top is in for this one, I think it will come back down to 8$ level.
Cosmos Double Top and 1hr bearish divergenceThoughts on ATOM?
Cosmos still has a Double Top and 1hr bearish divergence in play


Perfect possible Double Top into the Cosmo?ATOM/USD
Bearish Case
- Double Top can be seen (white line)
- 1hr and 8hr RSI shows a exaggerated bearish divergence
- BTC is retracing, eventually ATOM will follow to in this bear market
Target Zone
- $13.41 (neck line of the bottom of double top)
- $12.81 (0.618 fib retrace)
- $11.60 (0.5 fib retrace & start of double top)
Bullish Case
- May break higher 8hr Histogram showing reversal
Thoughts?

Games of Capital Rotation, example with $ATOM and $AXS$AXS was a coin that hit peak hype and coincidentally has some of the worst tokenomics. $ATOM on the other hand _might_ be forming to be a winner in the next cycle. Simple pair trade, shorting the past hype, longing the future hype and avoiding the crab bites. Similar to SAMA Long below ( + $SOL , $MANA)

ATOM.Usdt (Y22.P3.Video2).Rising wedge and inverted BAR scenarioHi All,
I look at a few scenarios that could work out great to short and long but we need some clues and hence confirmation to be able to do this.
If you have the skills, you will find a good entrance to short and then long.
This by the way could be a great introduction to some technical skills for reading the charts.
Please give me a like and share.
All the best,
S.SAri

The Market Has Spoken - "Liquid Staking" is the FutureFollowing this week's inflation report and the much-anticipated "The Merge" on Ethereum's ecosystem, the crypto markets took a massive dip - in particular, ETH itself. This is the classic "buy the rumor, sell the news" pattern as the hype towards the merge date neared, then the massive-selloff right after.
But not all coins were in the red - COSMOS (ATOM) did very well this week, and showed a very strong decoupling pattern from the rest of the pack. Why? Because they currently offer the best staking rewards (15%+!) out there, beating both the banks and its competitors by a very large margin. If you wanted to sell ETH but stay in crypto, it was the most obvious option to go with, at least on paper.
ETH2 has the problem of being illiquid (there is no set date for when you can withdraw your funds), as well as expensive - which will likely lead to the coin struggling over the long-term as coins that offer low-fee liquid staking (ADA, XTZ, DOT, MATIC, AVAX, etc.) has had a much longer time. ETH2 "final form" isn't likely to happen any time soon (some say as long as 6 years) so they are currently behind the curve of industry standards, not ahead. Whether they can catch up to the rest is yet to be seen.
Now that ETH has de-coupled itself from proof-of-work, we're going to start to see public attention towards different aspects of Web3 and DeFi - and staking rewards is likely to be the talk of the town, especially as we go further into the recession.

ATOM COSMOS simple volume profile analysisATOM simple volume profile analysis
COSMOS turned $13.50 from resistance to support
Next target $20 dear Crypto Nation
Follow 4 updates
*not financial advice
do your own research before investing

Cosmos: Well begun is half done!Cosmos seems to have taken this motto to heart and is appearing at its best. The altcoin has already managed quite some altitude difference on its way upwards to the resistance at $21.54, and it should keep going. Once above this mark, Cosmos should be well-positioned for further ascent. A 40% chance remains, though, that the altcoin could lose its steam and drop below the support at $5.54. In that case, Cosmos should make a detour through the turquoise zone between $5.27 and $0 first before starting to rise anew.

Atom (cosmos) Atom is over sold now , i expect down trend from tomorrow or next week maximum
My target 7-5-4

Ethereum Completes its "Merge". What's Next for ETH2?The much anticipated "merge" has happened on the Ethereum network as of last night - so far there doesn't seem to be any major shifts, although if you're an ETH holder you may have noticed a sharp drop-off in price as of this morning. (The market is down as a whole, but ETH took a bigger hit than most, as of today.) This pattern can be seen pretty often in the industry, where a technical upgrade or public hype often triggers a short-term rally as it gets close to the date, then a massive sell-off right after. (Dogecoin in particular tends to be very susceptible to this especially on Twitter, I've noticed.)
While some attribute this behavior as "whale activity", it's usually a sign that ETH still has downward pressure in terms of price - experienced investors often try to time their liquidations by riding short-term hype cycles of clearly-defined dates, as seen here.
While the merge was a momentous occasion for the chain for sure, now that it's over it's going to shift the attention of the project to a number of challenges that will likely determine the viability of ETH2 in the long-term. A few of them are:
- Yesterday probably marks the beginning of the proof-of-stake era for the crypto industry, especially as we head further into the recession and staking rewards (interest rates) start looking more appealing as a place for people to park their money, longer-term. ETH has made that transition, but there are also already many competitors out there (Tezos, Cardano, Cosmos, TRON, etc.) that outperforms ETH2's staking rewards by a very large margin right now. (Though to be fair, ETH2 is still beating the banks, which still is trying to stay at near-0, despite the Fed's rate hikes.)
- "The merge" is only 1 out of 5 steps (Merge, Surge, Verge, Purge, Splurge) until ETH2 is "fully done", which is estimated to take 6 years or longer. Gas fees won't be affected until their "sharding" upgrade is complete, which doesn't have a deadline as of yet. (Until then, most ETH apps will largely sit idle/abandoned since practical usage is just not possible right now.) 6 years is a very long time to sit idle, really.
- ETH2 is currently not liquid (you're not allowed to withdraw from ETH2 accounts until they're "ready"), which makes it much more inflexible and risky than traditional CDs and bonds that have fixed end dates. This is likely to make it very unappealing for most investors out there who will need more clarity and stability in their returns, especially during bear markets.
- Though in theory they are supposed to be independent, we don't actually know what sorts of after-effects ETH2 will have on Layer 2s and ERC tokens built on top of the original chain. Time will tell, but if the price continues to drop (which is likely at this point), we may start to see unintended effects start to pop up. (A lot of crypto projects "balance" their economy with the idea of the price always going up - but that strategy has already backfired in a number of projects already.)
- ETH doesn't support on-chain governance systems (like Tezos - Vitalik was on record being against the idea for a very long time) so there is no way for people to know whether or not the outcomes of DAO or multi-chain votes were done with due-diligence or not. Many businesses and organizations will not participate in these activities until this is fixed. Until then, ETH holders will have to just get used to big decisions behind done behind closed doors.
- What happens with the migration of miners in the ecosystem (ETH was the go-to in terms of mining profitability until now) will be interesting to see since this will be major shift in hash-power allocation in the industry as a whole. Bitcoin mining - due to its fixed supply - has a extremely high difficulty curve and very difficult to turn a profit on so most miners are unlikely to go there, either. It may be an opportunity for a lesser known proof-of-work chains to make its move. (Especially "useful" PoW projects like Gridcoin and Golem.)
--
All in all, the merge came and went, as with like most technical upgrades in the past, the market didn't seem too concerned -- at least, not yet. Ethereum has the bigger challenge now of addressing use-cases and business concerns in order to re-attract the talent and resources that had fled the scene since its gas-fee problem started becoming all too apparent. Can it stay competitive among the proof-of-stake league that have had more time to refine their process? Time will tell.

ATOM HELLO GUYS THIS MY IDEA 💡ABOUT ATOM is nice to see strong volume area....
Where is lot of contract accumulated..
I thing that the Seller from this area will be defend this SHORT position..
and when the price come back to this area, strong SELLER will be push down the market again..
DOWNTREND + Support from the past + Strong volume area is my mainly reason for this short trade..
IF you like my work please like share and follow thanks
TURTLE TRADER 🐢

Trading opportunity for ATOMUSDTBased on technical factors there is a Long position in :
📊 ATOMUSDT
🔵 Long Now or by Breakout
🧯 Stop loss 13.490
🏹 Target 1 19.900
🏹 Target 2 25.000
💸Capital : 1%
We hope it is profitable for you ❤️
Please support our activity with your likes👍 and comments📝

ATOMUSDT 3D Good growth prospect for medium and long-term tradesIt can be assumed that for the last 2.5 years the ATOMUSDT price has been moving up through a large channel.
Now the liquidity zone $20-25 acts as a magnet for ATOMUSD price growth, it is possible that the price will be able to reach there in this wave of growth.
"The sweet" buying zone for medium and long-term positions is around $10 per Atom
In general, the Cosmos Atom token price showed a very good 200% rebound from the bottom of July 2022 among liquid coins
This fact indicates that "buyers with money" believe in the future growth of the ATOMUSDT price.
_______________________________
Since 2016, we have been analyzing and trading the cryptocurrency market.
We transform our knowledge, trading moods and experience into ideas. Each "like under the idea" boosts the level of our happiness by 0.05%. If we help you to be calmer and richer — help us to be happier :)

ATOM, great more than 130% in few week!At the beginning of July we posted an image of ATOM in which it was in a macro support at the price of $ 7.8 we opened a Long the result was very interesting.
we made more than 130% in a few weeks.
There is currently an important resistance (red box) where the price could go down a bit or break up.
Much will depend on BTC, if the bear market comes to its end, ATOM will also do very well.
We stay in HODL, see you soon for new updates.
LPI.sa

atom cosmos trading idea 2hera are a potential a good short setup to trade. follow if yuo want see more

ATOM USDHELLO GUYS THIS MY IDEA 💡ABOUT ATOM is nice to see strong volume area....
Where is lot of contract accumulated..
I thing that the buyers from this area will be defend this long position..
and when the price come back to this area, strong buyers will be push up the market again..
UPTREND + Support from the past + Strong volume area is my mainly reason for this long trade..
IF you like my work please like share and follow thanks
TURTLE TRADER 🐢

ATOM Cosmos - at volume resistance $13.50ATOM Cosmos - at volume resistance $13.50
Breaking the current resistance could lead to a relief run to next higher volume cluster at $20.00
A bearish divergence on RSI occurred - a correction to $8.50 likely
What do you think dear Crypto Nation?
*not financial advice
do your own research before investing

