#COS/USDT : Breakout setup ? #COS
The price is moving within an ascending channel on the 1-hour frame, adhering well to it, and is poised to break it strongly upwards and retest it.
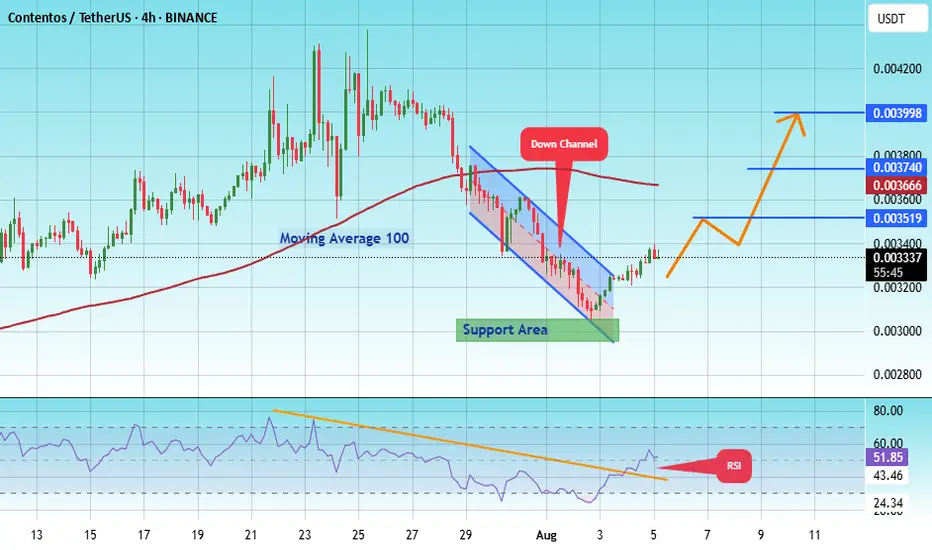
We have support from the lower boundary of the ascending channel, at 0.003071.
We have a downtrend on the RSI indicator that is about to break and retest, supporting the upward trend.
There is a key support area (in green) at 0.002970, which represents a strong basis for the upward trend.
Don't forget one simple thing: ease and capital.
When you reach the first target, save some money and then change your stop-loss order to an entry order.
For inquiries, please leave a comment.
We have a trend of stability above the Moving Average 100.
Entry price: 0.003339
First target: 0.003520
Second target: 0.003740
Third target: 0.004000
Don't forget one simple thing: ease and capital.
When you reach the first target, save some money and then change your stop-loss order to an entry order.
For inquiries, please leave a comment.
Thank you.
Cosmosbtc
Cosmos | ATOMAfter taking profit at 15$ its correction time and here we are, but whats next?
The price of ATOM is $11 today with a 24hour trading volume of 120 million dollar. This represents a -1% price decline in the last 24 hours and a -15% price decline in the past 7 days
Cosmos bills itself as a project that solves some of the “hardest problems” facing the blockchain industry. It aims to offer an antidote to “slow, expensive, unscalable and environmentally harmful” proof-of-work protocols, like those used by Bitcoin, by offering an ecosystem of connected blockchains.
The project’s other goals include making blockchain technology less complex and difficult for developers thanks to a modular framework that demystifies decentralized apps. Last but not least, an Interblockchain Communication protocol makes it easier for blockchain networks to communicate with each other — preventing fragmentation in the industry.
Cosmos’ origins can be dated back to 2014, when Tendermint, a core contributor to the network, was founded. In 2016, a white paper for Cosmos was published — and a token sale was held the following year. ATOM tokens are earned through a hybrid proof-of-stake algorithm, and they help to keep the Cosmos Hub, the project’s flagship blockchain, secure. This cryptocurrency also has a role in the network’s governance.
I will start average buying at 9$ and I will close my shorts at 9.3$

COSMOS Bullish Reversal to $25 - 100% gain in following months!Weekly candled closed inside cloud, signalling E2E trade activation with target of $25.
At the same time we broke out from a multi-year descending triangle formation, which signals a bullish price reversal. Fibonacci extension on the parter targets $24-25 area as well.


ATOM Looks AMAZINGATOM looks like a BUY here.
Broke out of resistance and landed on support.
Doesnt get any better than this.

#ATOMBTC - If we Break this Mid-Line We've got a Big Drop!Look at some of these trades CTv2 has generated for us recently!
We've got another one here with this Short trade, if price breaks this mid-line we're adding on another 30% to our portfolio!
____________________________
What Do You Think?
If you enjoyed or agree with this idea - drop us a comment, like & follow! 😀
Ideas by theCrypster meet the guidance notes and disclaimer as mentioned below and within our website. See Signature for more info! ✌️
🔥🔥🔥
Crypto Tipster v2
theCrypster
🔥🔥🔥

#COSMOS/SUSDT Bullish Pullback in Uptrend EmergingSetting up a trade:
Possible bullish trend forming with price making Higher Highs and Higher Lows. Price was rejected 2x at $17 resistance. Pullback near $12.50-14.00 support could be a swing entry point, with upside potential back to $17 resistance zone. (set a price alert).
As a trend:
Downtrend on Short- and Medium-Term basis and Neutral on Long-Term basis.
Momentum is Bearish ( MACD Line is below MACD Signal Line, and RSI is below 45).
OBV ( On Balance Volume ) :
Is flat, indicating that volume on Up days is equal to volume on Down days. Hence, demand from buyers and supply from sellers are in equilibrium
Support and Resistance:
Nearest Support Zone is $12.50, then $10.00. The nearest Resistance Zone is $14.00 (previous support), then $17.00, and $20.00.

ATOM - 1H Bearish signsThe daily trend line was broken and it had a pullback on the 4H chart. In the 4H time frame, The price crossed the support zone and had a pullback to the zone with a perfect doji candle that we can consider as a signal bar. We have a powerful bearish candle at the end that indicates the price could decrease more.

Cosmos (ATOM) formed bullish Butterfly for upto 634% big pumpHi dear friends, hope you are well and welcome to the new update on Cosmos (ATOM) coin.
On a weekly time frame chart, the price action of ATOM has formed a big bullish Butterfly pattern.
Note: Above idea is for educational purpose only. It is advised to diversify and strictly follow the stop loss, and don't get stuck with trade.

ATOM strong supportAtom is sitting at a strong support area and it looks ready for a small reversal.
My price target is $28.70.
Looking forward to read your opinion about it.

long trem atomIn this price range, there is a long-term dynamic support that is expected to have price growth in this area. And in case of loss of this support. It has an extremely important static support in the price range of 20 and 21, which is suitable for purchase ...

Cosmos Posible Target 34.24Hey!
I have put together this analysis to help with the understanding of the support and resistance levels! On this occasion, I have compared a lot of levels with the progress of the crypto, after which it rises or falls depending on what the allcoin market looks like. My target is $ 34.24 (24.25%)

ATOM, COSMOS, DAY TRADING, SIGNAL$ATOM Never #FOMO into trades. Wait for retest of support levels and buy in. There is always time. If first support doesnt hold wait for next level.

💥ATOM FORECAST - TO HIT NEW ALL TIME HIGH🚀Please support this idea with a LIKE👍 if you find it useful🥳
Not a financial advice🙅🏼♂️
Right here is a weekly chart with price is an ascending triangle.
A successful close above the resistance region at $44 is will take price to a new ATH.
If the trend will continue, the Best Buy zone to bag more cosmos is within $24 & $28.
What do you think?
Share your opinion in the comment section✍️
Follow me to receive more updates on COSMOS (ATOMUSDT ) 🤗
Happy Trading💰🥳🤗

ATOM, COSMOS, DAY TRADING, SIGNAL$ATOM waiting on 4HR close for #ATOM to get above 30, then going long to 37 #COSMOS

ATOM, CASMOS, DAILY TRADE, SIGNAL#ATOM bullish divergence on the daily timeframe supported by decent volume… ATOM $44 incoming 🚀🚀

ATOM topping out?In stark contrast with the rest of the market, Cosmos was able to make a nice run up during the past couple of weeks. Especially if we hold it up against its Bitcoin pairing.
It has currently twice rejected its ATH resistance zone and is playing with RSI overbought levels. EMA's are still curling away from each other so a continuation is also still in the cards. Although I strongly believe Bitcoin will regain some strength here which can offer a nice shorting opportunity for this pair.
What do you think?

ATOM BTC COSMOSCHALLENGE:
Post a better chart.
I am interested by the green lines and I have to see how the price develops on these lines on shorter timeframes.
The green box would be a real and Christmas present.
Red box flipping is for me the first signal for bull momentum to resume. Red line flipping and I'm going really big long on this one.

COSMOSUSDT , One of the amazing projectHello everybody
Do you know anything about cosmos ? do you what it wanna do ??
After rally that made,the price is going to correction-downward trend and is coming toward the support zone.
As long as the price is trading above the trend line, the potential for price rise remains
If you have any question or need any help just send us messages
Good Luck
Abtin

ATOMUSDT-LONGThere is a long position in ATOMUSDT Cosmos
ATOMUSDT Cosmos
🔵Long Now or set on Key Level 25.85
🟢Target 1 28.90
🟢Target 2 32.95
❌Stop loss 24.55
#K_Level

If we break support, then down to $24, but im buying the dip.Cosmos is one of the most severely undervalued large cap tokens - once its ecosystem becomes as robust as DOT, then it will also surpass it in cap IMO; ATOM has great tech and a great team. Long.

Bullish On ATOM/BTC Game Plan Here!!$ATOM will soon start moving upside.
Currently sitting in a good support area.
RSI also dipped.
Let's HODL and wait. 🚀

ATOMUSDT , Trend coin in these days ...Hello guys
One the most trend coin in crypto market because of the news and the technical of it
In here , After a long time correction we are in sensitive area for take decision that where the market want to go
We have 2 scenario that market can do , We can say the trend is upward because in the past we have a key , but because of the compresion the price these days we should have a little correction and after that we can break the long term trend line and we can the long position and buy until the first target reach , but the second scenario that have the lower chance to happen is the that price is fall down and juggling with the sensitive zone and after a little upward price cant hold the price and fall down until that main support zone , we will try to update and publish it but remember these 2 scenario
Dont forget use stop loss and attention to money management
Good Luck
Abtin
