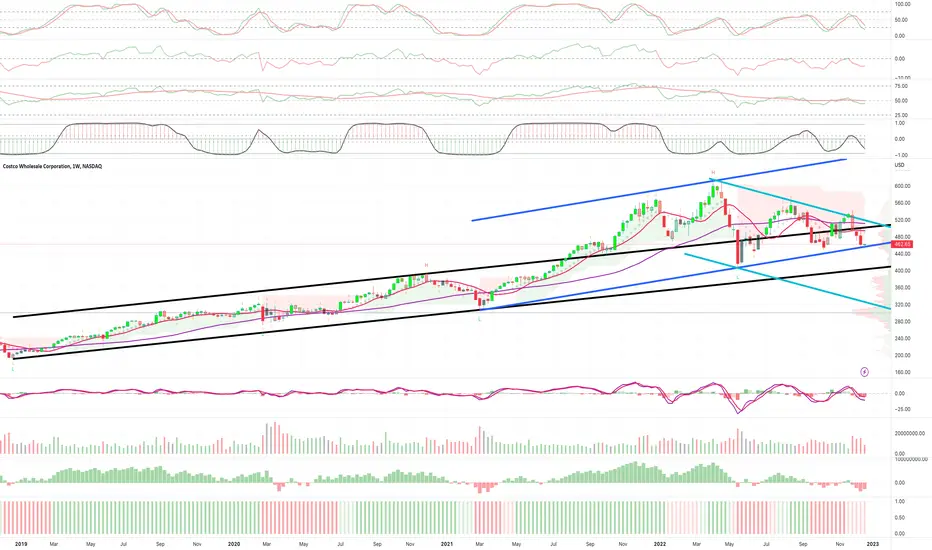
COST testing meaningful supportCOST testing meaningful support at the BLUE channel structure.
The overall bias remains to the downside.
A break below the BLUE structure could allow price to slip into the lower $400 handle.
COST
$COST Costco 2-2 Reversal Month$COST took the 2-2 reversal Month and is headed to the target 1 of $449.03
$COST also has triggered the Inside Quarter down with magnitude to $406.91 but the Q ends 12/31
Currently $COST is FTFC down

COSTHigher lows are being formed on Costco although it seems that this one could continue to fall, not much was able to be done above 533 on it which was a major resistance.

COSTCO - BEARISH SCENARIOCostco is set to report its fiscal first-quarter earnings Thursday after the market close.
The company experienced cooling sales in November as shoppers spend more cautiously amid news of increasing layoffs and stubbornly high inflation.
Also, In the near-term future, Costco may face margin pressure from elevated supply chain costs (retailers have been receiving inventory earlier than expected), greater promotional activity, and higher wages.
The short-term expectations are for a breakout of the triangle and a target of $ 450.
Risk Disclosure: Trading Foreign Exchange (Forex) and Contracts of Difference (CFD's) carries a high level of risk. By registering and signing up, any client affirms their understanding of their own personal accountability for all transactions performed within their account and recognizes the risks associated with trading on such markets and on such sites. Furthermore, one understands that the company carries zero influence over transactions, markets, and trading signals, therefore, cannot be held liable nor guarantee any profits or losses.

FIL rises in value to $4.38.Today's bullish Filecoin price analysis
$4.40 offers the greatest resistance.
FIL/USD support is indicated at $4.18.
According to Filecoin price research, the price of FIL/USD has been moving strongly upward during the past 24 hours. The cost has continued to rise dramatically and has come close to reaching the $4.18 level. The cryptocurrency appears to be moving upwards, but the market is moving in a favorable way. With a trading volume of $95,408,859, the price of FIL has increased by 3.63% during the past 24 hours as of today, November 29, 2022. Hence, having a live market capital of $1,433,268,246 and is ranked #31 in the cryptocurrency ranking.
Analysis of the 4-hour price of Filecoin: Recent developments


DOGE still HODLING overallReferring to the cost basis of DOGE/USD, realised profit/loss suggests that a majority of holders of DOGE are HODL'ing with an extremely small fraction realising losses overall. Only a small fraction of the market trading DOGE actively.
Cost basis has remained unchanged at around USD 0.20, which in my opinion has formed an important breakeven point and a level to keep an eye on particularly if event news sees DOGE stalling around this area. Certainly we would want to gauge this area not just for "break trades" to surpass it - but for continued support to come in over this market-wide break even point.

$COST Short Idea - First target 465Market has been rallying but today seemed suspect and pop in VIX implies smart money possibly hedging under the hood.
Time to start looking for hedges / short opportunities , whether we get a large move down or just a pullback before going higher, IMO in the near term we see some selling.
Costco is at trend line resistance and therefore I see it as a good hedge/ short candidate. Also at the top of the BB , implying as a mean reversion trade we at least see 495, with 465 being the max profit taking level for me.
For the less risk adverse can trade a 525/530 call credit spread or a 525/520 put debit spread, although all out short / long put is also an option ... I'm looking at DEC opex.
Cheers - Frisco

COST (COSTCO) massively bearish head and shoulders patternCOST (COSTCO) has formed a massive head and shoulders pattern over the past year, which seems like a no-brainer opportunity to get short.
COST could possibly reach 440 by the middle of October and 407 by the first week of November if the price breaches the neckline around 464. A period of consolidation could delay these estimates by several days.
Disclaimer: I am not a financial advisor, and the above statements are not investment advice. My comments are only intended for educational purposes. You are solely responsible for your own trading decisions.

COST daily bullish hammerOrder BUY COST NASDAQ.NMS Stop 473.44 LMT 473.44 will be automatically canceled at 20230401 01:00:00 EST
COST daily bullish hammer with RSI divergence gotta be quick 1.2R countertrend.

Costco slashing prices! COSTAbout to go through pivot level in what otherwise looks like a finished impulse. Picking conservative, fractally evident levels.
We are not in the business of getting every prediction right, no one ever does and that is not the aim of the game. The Fibonacci targets are highlighted in purple with invalidation in red. Confirmation level, where relevant, is a pink dotted, finite line. Fibonacci goals, it is prudent to suggest, are nothing more than mere fractally evident and therefore statistically likely levels that the market will go to. Having said that, the market will always do what it wants and always has a mind of its own. Therefore, none of this is financial advice, so do your own research and rely only on your own analysis. Trading is a true one man sport. Good luck out there and stay safe.

COST, Bearish Quasimodo pattern is beautifully forming !COST is showing nicely a very popular price action Quasimodo pattern .
Quasimodo pattern is also called Over-Under pattern. It is simply formed by series of Highs and lows as shown on the chart.
Sell zone (568-571 USD) was shown on the chart for COST. In addition to strong static resistance of pattern we also have 0.786 Retracement level of the last major decline in this zone. Moreover, Pull back to broken up trend line might be completed at mentioned Sell zone.
It is also worth to note, All indicators will be extremely overbought if COST can reach to shown sell zone.
As Quasimodo pattern has been proved to be of high probability success , we certainly keep COST in our short watch list but do not jump into trade blindly. As always we need a reversal trigger at sell zone to open our position . Take profit targets are also shown on the chart by green lines.
The reference of the inserted picture was shown on the chart . You can find many other pics and examples simply by googling " Quasimodo pattern ".
Good luck everybody.

COST Costco Wholesale Corporation Options Ahead Of EarningsLooking at the COST Costco Wholesale Corporation options chain, i would buy the $475 strike price Puts with
2022-9-30 expiration date for about
$5.15 premium.
Looking forward to read your opinion about it.

COST trade setup idea 8 september 2022530.5 is an important level for Costco. This level coincides with 34 EMA.
If the stock crosses this level, then we can go long with a target of 543.
If the stock is not able to cross this level, then I would go short with target of 510

$COST wait for the break of pennantCOST is primed for a move out of Pennant. Wait for break of Pennat to determine direction.
It’s lost the 9ema on weekly. A slight bearish bias
#RedDevilTrades #RDT


COSTCostco chart here shows a head and shoulders formation which is bearish..
Chart got originally striked so had to repost this lol -- 510 bearish target with a 390 buy in mind for the long term portfolio.
510
390

2X $COST 1D Tech. Analysis!COSTCO IS A GREAT STOCK, but the price action is showing a cool off after this strong run up almost 40% from the May lows! The current bull trend is in a Huge rising Wedge, and also the overall chart is showing a head and shoulders formation in the making in the near future. Look to load up on puts at these 2 marked areas!

$COST Running to 550!-RECAPSo, I called this out 5-days ago in my channel.. $COST would rebound from our regression channel and run to at least $550. This isn't difficult, and trading should be simple... we have the greatest indicator ever created; and led to a $26 burst from $537 to $564. No, I do not have a crystal ball... I have Trendsi, and normal technical analysis; and I know that my Dashboard indicated a continuation from my money momentum moving up, my green middle bar, and a key ema cross over. There isn't a guarantee, but we get pretty close with this indicator; and what we post on TV is just the tip of the ice berg!

Ethereum CHAOS £100 Next?Ethereum cost drops lower as the current week's misfortune matches back the increases from a week ago.
ETH cost is set to proceed with its decay going into the following week.
With the mid-year, the money departure proceeds, and the ETH cost is in danger of falling toward £470.22.
Ethereum (ETH) cost is disappointing dealers attempting to focus on any break underneath £824.95 to get the cost activity and be important for a meeting that will swing them back to all-time highs into the following year. Nonetheless, that isn't how it works in exchanging, and positively not in cryptographic forms of money. Taking a gander at a week-after-week graph the £824.95 marker holds no significance and either needs a bob off $570 or a break above $1,404 before brokers can begin taking positions.
ETH cost holds 45% space to the drawback
Ethereum cost sees dealers consuming a ton of money to attempt to exchange around £824.95 to use as section level for a convention. Taking a gander at the more extensive time, it pays off to see and find that although it is a mental level, it holds no bearing at all. All things considered, it's smack in the center between £1158.69 for the potential gain and the disadvantage. With bulls consuming money, bears can undoubtedly neglect to move and watch cost activity drop further in their favor.ETH cost will tank further and could certainly still cover another 45% of space to the drawback before a huge essential level gets reached at £470.41. The new month-to-month S1 support level at £533.96 could currently be a sandbox where bears begin offloading and shutting their short positions. The message here is that bulls should make an effort not to impede the low steam roller that will crush any bull out of this endeavor to get the plunge instead of sitting tight for the bob. As currently referenced, bulls that need to be important for a more drawn-out term rally will rather need to trust that a solid bullish sign will arise. That could be conveyed once cost activity pops above £1158.69 and potentially break the red plummeting pattern line. With that move, the room gets up to £1393.07 in an underlying stage and next £1591.14, playing with £1650.56.

COSTCostco is one i've been watching. The close before the long weekend was ideal if you entered short once again underneath this yellow trendline.
An overshoot to 508-510 is still possibly in play and that's where i'd be looking to start a longer dated short position or even sell out of the position if we get to that target.
Costco is a very strong company don't get it wrong. This is a stock i'd buy in my retirement account at nearly all support lvls below 480.

COST 39 PE consumer is cutting backMany of these consumers will be losing their jobs! Credit card debt record $1.1 trillion, $7 a gallon gas here in CA. 30 year mortgages went from 3.25% to 6.5-7% something's got to give! Costco is overvalued on a PE standard and EARNINGS compressions are coming! Bear market rallies are to be sold, not bought!! PE of 39 is sky high compared to TGT at 11

COSTIchimoku R is near 510 and would be the bullish target
Now rejecting at yellow trendline that used to act as some support
380 PT
