Costco Targeting HVN & Equality TestIn this update we review the recent price action in Costco and identify the next high probability trading opportunity and price objectives to target
COST


COST Costco the next TGT?TGT is down 25% after the earnings today.
Could COST be next?
if we look at the P/E ratio, TGT has a P/E of 15.58, while COST much higher, 39.87.
I wouldn`t be surprised to see a retracement of COST at the pre-pandemic level of $387.
Looking forward to read your opinion about it.

COSTDouble top currently formed, holding onto support. Would love to see a bounce on Costco. Long term portfolio would love to see this break lower.

One more touch of BTC production cost is here, Long opportunityProduction cost indicator, shows, how much it cost BTC farms to mine bitcoin and everytime it hits it they buy it up as it's cheaper to buy it then let their farms run to mine it.

We are in for a pullback! 📉Hi there, Yurii Domaranskyi here.
Risk vs Reward = 1 to 5.1
It means if you risk here 100$ you may make 510$ Not bad, huh?

Costco looking toppishCostco has reached its upper channel and is in a parabolic move. Seems due for at least a pulback towards the bottom of its rising channel.

COSTCO - Looking very strongRefer chart mark up - looking very strong - in case if fall from here have strong area of support.
If you like try to accumulate from that area.
Let me know your thoughts.

Costco going for discounts. COSTGoals 485, 468, 440.
We are not in the business of getting every prediction right, no one ever does and that is not the aim of the game. The Fibonacci targets are highlighted in purple with invalidation in red. Fibonacci goals, it is prudent to suggest, are nothing more than mere fractally evident and therefore statistically likely levels that the market will go to. Having said that, the market will always do what it wants and always has a mind of its own. Therefore, none of this is financial advice, so do your own research and rely only on your own analysis. Trading is a true one man sport. Good luck out there and stay safe

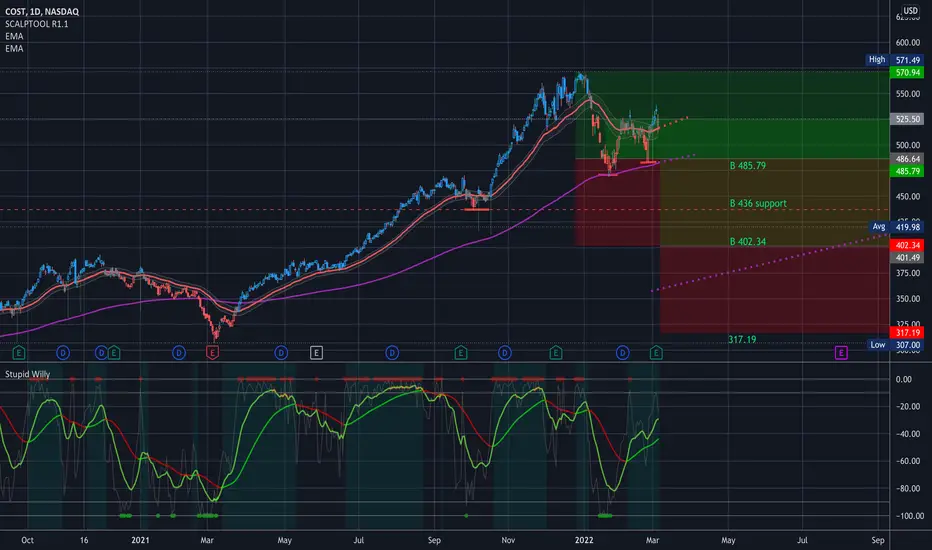
$COST Key Levels, Analysis & Targets$COST Key Levels, Analysis & Targets
I have to be sentimental with COST. I didn’t analyze it differently… the MA’s just are what they are…
But I think that COST is an efficient company. I think they deserve their market value. I do think it will fall a little bit, but this company is strong. I’d hold.
-----
—
On the far right of the chart is my Average (Grey) Current Target (Green), and Next Level to add (Red) Percentage to target is from my average.
ONLY ADD at support levels & FIB levels… labeled (most of the time)
(Support=Green, Resistance=Red, Trendlines=Blue) Fib will be labeled if any and their colors will vary.)
I start every position with .5 - 1% of my account and build from there as needed and as possible.
I am not your financial advisor. Watch my setups first before you jump in… My trade set ups work very well and they are for my personal reference and if you decide to trade them you do so at your own risk. I will gladly answer questions to the best of my knowledge but ultimately the risk is on you. I will update targets as needed.
GL and happy trading.
IF you need anything analyzed Technically just comment with the Ticker and I’ll do it as soon as possible…
COSTCO - COSTUpdate here on Costco, looking to become heavy buyer towards the 390-446 range. Weekly looks like it’ll break down further from here based off technicals.

COST daily470 area held, this demand zone look like a nice buy area keep it on your radar. Oversold defensive stock, good for portfolio diversification with the current economic environment.

Another Money Shifts is about to happen in the market..!I would like to start this forecast with this Peter Lynch quote:
“In this business, if you’re good, you’re right six times out of ten. You’re never going to be right nine times out of ten.”
It means, the best traders are never right all the time, they make losses too. Focus on getting more trades right than wrong and you’ll be considered successful.
Having said that, If you want to increase your chance of success you need to evaluate the market situation, individual sectors and industires; and then find the best stocks with the highest chance of appreciation to go long and highest chance of depreciation to go short!
I monitored Waren Buffet's porfolio and Berkshire performance for a year and compared it with Nasdaq 100 and find out a possible top in BRK.A could be an early sign of the end of Nasdaq 100 correction..!
BRK.A vs NDX:
(Some times there is value in a comparing Apple and Oranges)
In my Dec 16, 2021 analysis (Editor's Pick) I mentioned:
Based on the pattern in the charts and the past 2 days of high volatility in the market, the most probable scenario could be a complex correction and a shift from tech stocks to Banks, Energy, and Telecommunications.
Please review the performance of these sectors in the past 3-4 weeks!
Now let's review the current situation:
Based on my current observation Value stocks started forming top patterns:
Example:
NASDAQ:COST
NYSE:UNH
NYSE:HD
NYSE:KO
NYSE:MCD
Berkshire owns all the aboe mentioned stocks except UNH!
Conclusion:
I think there is a good chance we see shift from value stocks to Tech stocks once again in the next one or two weeks which could push them up around 5%!
Best,
Moshkelgosha
DISCLAIMER
I’m not a certified financial planner/advisor, a certified financial analyst, an economist, a CPA, an accountant, or a lawyer. I’m not a finance professional through formal education. The contents on this site are for informational purposes only and do not constitute financial, accounting, or legal advice. I can’t promise that the information shared on my posts is appropriate for you or anyone else. By using this site, you agree to hold me harmless from any ramifications, financial or otherwise, that occur to you as a result of acting on information found on this site.

ROTATION ? OR TRANSITION TO BEAR QQQ VS QQQE has started to show a very clear move out and is just stating to hit the Big mega caps names . I DO NOT have any sign of a bottom now ! the line in the sand is at 375.91 in the QQQ and I would think that we will see the QQQE breaking the neckline of its head and shoulder pattern that has formed .Cycles are neg now till late jan to early feb . One by one of the winning mega caps cost msft seem to have now formed a top and i look for downside to be picking up rather soon . have a good weekend and best of trades WAVETIMER


COSTNice uptrend since December, 21. Bullishly out of a minor downtrend. I expect it to enter 600s this year.

Costco ~ COSTCostco is a monster .. Looks like it wants 585-590 area where there will be some trendline resistance.
Wouldn't want to even short this thing near the top of the pattern iMO. Can reach 620 if it breaks that 590.
LIS 565 once above.

COST: Consolidation.Consolidation is broken upwards with the minimum target level around 408. The long-term resistance level around 386 is also broken upwards. Therefore, the long-term target can be around 465.

Costco May Witness A Big Jump After Earnings
Costco Wholesale COST is set to give its latest quarterly earnings report on Thursday after the closing bell, Costco will likely report an Earnings Per Share (EPS) of $2.61.
Costco bulls will hope to hear the company to announce they've not only beaten that estimate, but also to provide positive guidance, or forecasted growth, for the next quarter.
Last quarter the company beat EPS by $0.33, which was followed by a 3.31% increase in the share price the next day.
The stock is currently forming a potential continuation pattern (Symmetrical Triangle) to be confirmed by the violation of the $543.00 resistance point. After the pattern being confirmed supported by a probable earnings beant, the price will likely hit the pattern's minimum target around $572.00 point.

COST - 950 by July 2022Please see chart and curve line taking us to top of channel after the impulse move above middle channel.

COSTco is a winnerCostco made a classic buy the uptrend support on Friday. With that boost this looks really good and ready for breakout again for another big run. All indicators are bullish. If Monday holds that $550 support and breakout above $561 it will continue to run. High trend breaking ATH with RSI 66. Explosive, one of my favorite setups.
If you want a slow moving but will continuously go up stock, then Costco can’t be beat for long term hold either.
$COST
Like and follow for more, comment to discuss

$COST... another beautiful breakout...We sold premium into earnings on this one for about 90% profit!
