Short Idea on EURUSDBased on :
- Periodic volume profile
- Seasonality
- Currency strength of usd and eur are weakest vs strongest
- small divergence on Poiv but on weekly timeframe is more evident
- Cot data
Cotdata

Is it going to happen again? My view to the markets right now...CBOT_MINI:YM1!
Is the Dow Jones breaking the downtrend again?
I believe there's a strong chance the markets are setting up for another move higher. From a fundamental standpoint, the recent pause in tariffs is a big deal. It removes an immediate layer of uncertainty that’s been hanging over the global economy, especially for exporters and multinational companies. On top of that, the fact that key tech products have been left out of the latest tariff actions is boosting confidence in the sector that has been leading market strength for years.
Economically, we’re still seeing resilience in key indicators. Unemployment remains low, consumer spending is steady, and central banks are staying cautious with tightening. The environment still leans more towards slow growth than recession, which supports equities over the medium term.
More importantly, my own criteria for a favorable market setup are lining up. Whether it’s sentiment, intermarket signals, or trend conditions—this looks like a solid spot for a bullish stance.
You can see my chart to check out my current viewpoint on the Dow Jones and how I’m positioning based on all this.
Not Financial Advice
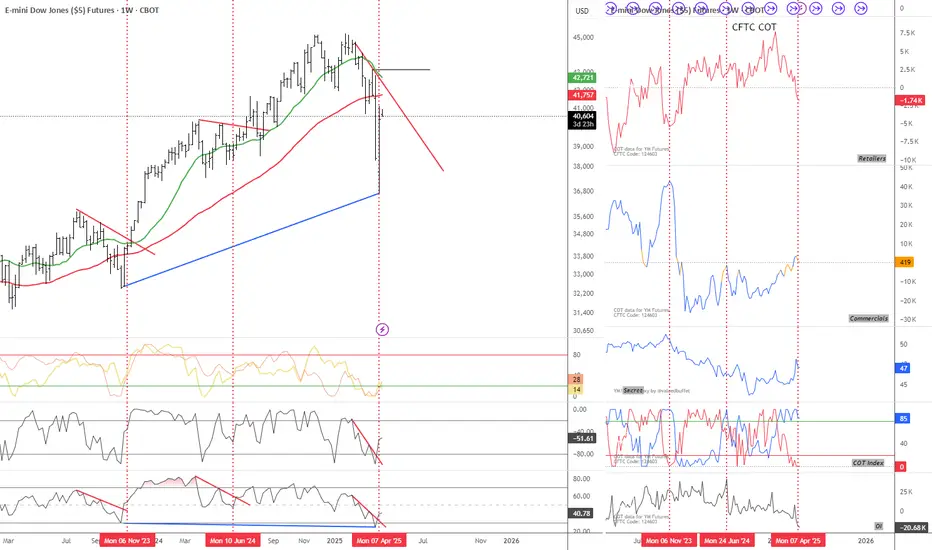
Promising Breakout Setup Ahead! Chart 1W CBOT_MINI:YM1! BLACKBULL:US30
Promising Breakout Setup Ahead!
The chart highlights RSI and Williams %R trendline breakout plays. My strategy? Identify trendlines on the chart, monitor RSI and Williams %R, and target breakouts on these momentum indicators.
Current Situation:
All key signals have already triggered.
Strong bullish seasonality
Favorable COT data (small specs bearish, commercials bullish)
Low open interest
This setup aligns with high-probability breakout criteria.
Chart Indicator
SMA 1W 52 (red)
SMA 1W 18 (green)
Bottom Indicators
WilVal
Williams R% 9 length
RSI 9 length
Not Financial Advice
for more questions ask in the comments or
check my X @valuebuffet

Corn Short, Technical, Fundamental and COT Analysis Current Corn Short
Entered originally, and admittedly prematurely, when we saw price touch the 61.8% fib retracement level.
Entered a short position last month as price has been steadily falling since June last year.
The falling price of corn is being caused by simply an overabundance of supply, and a lack of increased demand.
On the supply side, we have seen Corn acreage in the USA increase by ~10%.
At the same time, Brazil has also been growing record amounts of corn.
One of the factors which lead to Corns high in 2022 was the Russo-Ukrainian war and Ukraine's inability to export their produce. This is simply not the case anymore, as of now, Ukrainian exports have begun to pick back up to pre-invasion levels.
Demand has failed to increase with these pro-supply events.
Over the past four years we have seen American cattle herds, who are the largest consumers of Corn, slowly shrinking to lows not seen since the 50s. This is mostly due to an increase in local droughts which have made it harder to graze cattle, a preferable alternative to cattle feed due to the cheaper costs. This has caused the overall demands for Corn to shrink as there are less cattle overall to consume Corn and Corn products due to the drought.
Non-Commercial traders, as can be seen through COT filings, are a majority short Corn.
528,280 short positions are currently held by Non-Coms vs 295,676 longs.
Latest COT filings do show a slight increase in Net Positions (Longs-Shorts) compared to the previous. Possibly due to profit taking by Non-Commercials.
My Entry was based on Technical analysis, mostly an apparent Fib retracement. I saw price close in the "Golden Zone" on the 27th of Feb and as I am heavily Bearish on Corn, took it as an opportunity to enter short.
This entry was rather early and if I am closed, with my SL at 4.208, I will look to re-enter at a later date.

EURUSD to continue SHORT RUNHere we look at EURUSD holistically.
We check out the commitment of traders and the sentiment that all suggests we should expect more shorts in the near future... We discuss and show a few reasons why retail is short and as always do the opposite

AUDcad Short H4 Double TopSeeing that AUDcad seems to be failing to close above recent highs.
It appears that AUDcad was losing bullish momentum.
COT data reported a weakening AUD and a strengthening CAD.
Market came to test dynamic Daily Resistence. The test seems to have apprached the resistance in a rising wedge/flag correction. The top of this inner corrective channel formed a Double Top on the H4/H1 timeframes at its own resistance trendline. This appears to be enough confluence to consider selling AUDcad at this point.
Use the discretion of your own entry strategies to confirm any possible entry opportunities that you may find. as for me.

AUDUSD How will it go downhill?FOREXCOM:AUDUSD After the rejection from monthly & weekly resistance.
I’m on the bearish side on AUDUSD for now.
Let’s see what is the reaction of the price in the next few days!
price will start a down trend. from 0.7765 to about 0.7680
ENTRY PRICE = 0.7735
T/P =0.7680
S/L = 0.7750
Risk/Reward Ratio : 3.67 FOREXCOM:AUDUSD
