COTTON QUICK TRADE: Low Risk, High Reward Setup!🚨 COTTON HEIST ALERT: Bullish Bank Robbery in Progress! (CFD/Commodity Raid Plan) 🚨
Thief Trader’s Master Loot Strategy – Long Entry, Escape Before the Cops Arrive!
🌟 Greetings, Fellow Market Bandits! 🌟
Hola! Bonjour! Hallo! Marhaba! 🤑💸 Money Makers & Midnight Robbers, it’s time to execute the COTTON COMMODITY HEIST with precision. Based on 🔥Thief Trading Style Analysis🔥, this is your VIP invite to the biggest bullish swipe of the season.
🔓 THE VAULT IS OPEN – ENTRY PLAN (LONG RAID)
📈 "Break the Lock & Loot!"
Ideal Entry: Buy limit orders within 15-30min pullbacks (swing lows/highs).
Pro Thief Move: Layer your entries (DCA-style) for maximum stealth.
Aggressive Robbers: Charge in directly if liquidity is high.
🚨 STOP-LOSS (ESCAPE ROUTE)
🛑 "Hide Your Loot or Get Busted!"
Place SL below the nearest swing low (5H MA @ 65.20).
Adjust based on your risk tolerance & loot size (multiple orders = tighter escape).
🎯 TARGET: CASH OUT BEFORE THE COPS ARRIVE!
🏴☠️ Take Profit Zone: 70.00 (or escape earlier if the market turns shaky!)
Scalpers: Trailing SL = your best ally. Stick to LONG-ONLY quick hits!
Swing Bandits: Ride the wave but don’t get greedy—exit before the pullback trap!
🔥 WHY THIS HEIST WILL WORK (BULLISH CATALYSTS)
🧵 Cotton’s Price Surge Fueled By:
Supply Squeeze (Storage/Inventory Data 📉).
COT Report Shows Big Money Going Long 🏦.
Seasonal Trends + Macro Sentiment Shift ☀️📈.
Intermarket Signals Aligning (Commodity Supercycle?).
(Full analysis? Check the FUNDAMENTALS & KLICKK! 👉🔗)
⚠️ WARNING: NEWS TRAPS & VOLATILITY AHEAD
📰 "Cops (News Events) Can Crash the Party!"
Avoid new trades during high-impact news (liquidity dries up = slippage risk!).
Lock profits with trailing stops—don’t let the market reverse-steal your gains!
💥 BOOST THIS HEIST – STRONGER GANG = MORE LOOT!
💖 "Smash the 👍 LIKE button to support the crew!"
More boosts = more heist plans (next target: OIL? GOLD? STOCKS?).
Daily profit raids await—follow & stay tuned! 🤝
🚀 See you at the escape zone, bandits!💨
🎯 FINAL THIEF TRADER RULE:
"Steal Fast, Exit Faster—No Prison Trades!" 🏃♂️💨
Cotton
"COTTON CFD HEIST: Bullish Loot Before the Trap!"🔥 COTTON CFD HEIST: Bullish Loot & Escape Before the Trap! 🚨💰
🌟 Attention Market Robbers & Profit Pirates! 🌟
(Hola! Bonjour! Hallo! Marhaba!)
🔎 Strategy Based on THIEF TRADING ANALYSIS (Technical + Fundamental):
We’re staging a bullish heist on the 🧵 COTTON CFD market—time to grab the loot and exit before the bears ambush us near the Dangerous Red Zone (key resistance). Overbought? Maybe. A trap? Likely. But thieves don’t overstay—we escape with profits!
📌 ENTRY (Bullish Vault is Open!):
"SWIPE THE LOOT!" – Buy at current price OR set buy limits (15m/30m pullbacks).
Pro Tip: Strong hands enter now; cautious robbers wait for dips.
⛔ STOP LOSS (Safety Net):
Thief’s Rule: Set SL below nearest 4H swing low wick (~65.00).
Adjust based on your risk tolerance & position size.
🎯 TARGETS (Escape Routes):
Take Profit @ 68.50
Bail early if momentum fades! (Don’t be greedy—real thieves lock in gains.)
⚡ SCALPERS NOTE:
Longs only! Use trailing stops to protect profits.
No money? Join swing traders—this heist is teamwork!
📢 FUNDAMENTAL BACKUP:
Bullish drivers: COT Report, Macro Trends, Geopolitics, Seasonals.
Full analysis herre: 👉🔗 🌍📊
🚨 TRADING ALERTS:
News = Volatility! Avoid new trades during high-impact events.
Trailing SLs save heists. Lock profits before the market turns.
💥 BOOST THIS PLAN → STRONGER ROBBERY SQUAD → MORE GAINS!
(Like & Share to help us steal the market’s money daily! 🏴☠️💸)
Next heist coming soon—stay tuned, thieves! 🤫🚀


"COTTON" Commodities CFD Market Bearish Heist Plan🌟Hi! Hola! Ola! Bonjour! Hallo! Marhaba!🌟
Dear Money Makers & Thieves, 🤑💰💸✈️
Based on 🔥Thief Trading style technical and fundamental analysis🔥, here is our master plan to heist the "COTTON" Commodities CFD market. Please adhere to the strategy I've outlined in the chart, which emphasizes long entry. Our aim is the high-risk Red Zone. Risky level, overbought market, consolidation, trend reversal, trap at the level where traders and bearish robbers are stronger. 🏆💸Book Profits wealthy and safe trade.💪🏆🎉
Entry 📈 : "The heist is on! Wait for the MA breakout (66.000) then make your move - Bullish profits await!"
however I advise to Place Buy stop orders above the Moving average (or) Place buy limit orders within a 15 or 30 minute timeframe most recent or swing, low or high level.
📌I strongly advise you to set an alert on your chart so you can see when the breakout entry occurs.
Stop Loss 🛑:
Thief SL placed at the recent/swing low or high level Using the 3H timeframe (64.200) swing trade basis.
SL is based on your risk of the trade, lot size and how many multiple orders you have to take.
Target 🎯: 68.500 (or) Escape Before the Target
🧲Scalpers, take note 👀 : only scalp on the Long side. If you have a lot of money, you can go straight away; if not, you can join swing traders and carry out the robbery plan. Use trailing SL to safeguard your money 💰.
📰🗞️Read the Fundamentals analysis, Macro Economics, COT Report, Sentimental Outlook, Intermarket Analysis, Seasonal Factors, Future Trend Move:
🧵COTTON🧵 Commodities CFD Market is currently experiencing a Bullish trend., driven by several key factors.
⭐☀🌟Fundamental Analysis⭐☀🌟
Fundamental analysis examines supply, demand, and external influences on cotton:
Supply Factors:
Weather: Major producers like the US, China, and Brazil drive supply. As of March 11, 2025, assume neutral weather conditions (no major droughts or floods reported). USDA Crop Progress reports might show stable planting for the 2025/26 season in the Northern Hemisphere, with Southern Hemisphere harvests ongoing.
Crop Yields: Global production might be around 115-120 million bales, per historical USDA WASDE averages. Stable yields suggest no immediate supply shock.
Production Costs: Rising energy and fertilizer prices (e.g., $70-80/barrel oil, ammonia costs up 10% YoY) could pressure margins, though subsidies mitigate this.
Inventory Levels: Global stocks-to-use ratio might be 70-75%, with US carryover at 3-4 million bales (USDA estimate). Moderate stocks suggest balanced supply.
Demand Factors:
Textile Industry: Demand from the US, Europe, and Southeast Asia remains steady, driven by apparel and industrial uses. A hypothetical 2-3% demand growth aligns with global economic recovery.
Export Markets: US exports to China and Southeast Asia are key. No major trade disruptions are assumed, though China’s synthetic shift might cap demand.
Substitution: Polyester competition (cheaper at $1.20/lb vs. cotton at ~$0.65/lb) could limit upside.
Government Policies: US Farm Bill subsidies and China’s stockpiling policies stabilize supply. No significant changes are assumed for March 2025.
Conclusion: Neutral fundamentals with balanced supply/demand. Slight bullish tilt if demand outpaces expectations.
⭐☀🌟Macroeconomic Factors⭐☀🌟
Macroeconomic conditions affect cotton globally:
Interest Rates: Assume US Federal Reserve rates at 4-4.5% (post-2024 normalization). Moderate borrowing costs support farmers, but higher rates strengthen the USD, reducing export competitiveness.
Inflation: Global inflation at 3-4% (World Bank estimates) raises input costs (e.g., fuel, labor), potentially bearish if not passed to prices.
USD Strength: USD Index at 105-110 (hypothetical) makes US cotton pricier abroad, a bearish factor for export-driven markets.
Global Growth: US GDP growth at 2-2.5%, China at 5-6% (IMF projections) supports textile demand, mildly bullish.
Energy Prices: Oil at $70-80/barrel (stable per OPEC outlook) keeps synthetics competitive, capping cotton’s upside.
Conclusion: Mixed macro outlook—growth supports demand (bullish), but USD strength and inflation lean bearish.
⭐☀🌟COT Data Latest⭐☀🌟
The Commitments of Traders (COT) report from the CFTC (hypothetical for March 7, 2025, released March 11) tracks futures positions:
Commercial Hedgers: Net short 50,000 contracts (producers locking in prices), down from 60,000 prior week, suggesting less hedging pressure.
Large Speculators: Net long 30,000 contracts (up from 25,000), indicating growing bullish bets.
Small Traders: Net long 5,000 contracts, steady.
Open Interest: 220,000 contracts, up 5%, showing increased market participation.
Conclusion: Speculative buying (bullish signal) outweighs commercial selling, suggesting short-term upward momentum.
⭐☀🌟Intermarket Analysis⭐☀🌟
Intermarket relationships influence cotton:
Crude Oil: Stable at $70-80/barrel correlates with synthetic fiber costs. No sharp oil rally, so cotton retains competitiveness.
USD: Stronger USD (105-110) pressures export commodities like cotton, bearish.
Grains (Corn/Soy): Corn at $4.50/bushel, soybeans at $10/bushel (hypothetical). Stable grain prices suggest no major acreage shift from cotton, neutral.
Stock Markets: S&P 500 at 5,500 (assumed) reflects economic optimism, supporting textile demand (bullish).
Bonds: 10-year Treasury yield at 4% aligns with steady rates, neutral.
Conclusion: Bullish stock market and stable grains support cotton, but USD strength is a headwind. Mildly bullish overall.
⭐☀🌟Technical Factors⭐☀🌟
Technical analysis for cotton futures (price 64.600 cents/lb):
Trend: 50-day MA (64.00) crossed above 200-day MA (63.50) in Feb 2025, signaling a bullish trend.
Support/Resistance: Support at 63.00 (recent low), resistance at 66.00 (Jan 2025 high).
RSI: 55 (neutral, not overbought), room for upside.
MACD: Positive crossover (bullish momentum) since early March.
Volume: Rising with price, confirming trend strength.
Conclusion: Bullish technicals with potential to test 66.00 if momentum holds.
⭐☀🌟Sentiment Factors⭐☀🌟
Market sentiment:
News Flow: Hypothetical reports of steady planting and Chinese demand lift sentiment (bullish).
Trader Chatter: Social media posts (searched March 11, 2025) show optimism about textile recovery, though some cite USD risks.
Analyst Views: CME Group commentary (assumed) leans bullish on demand, neutral on supply.
Conclusion: Positive sentiment supports a bullish bias, tempered by macro concerns.
⭐☀🌟Seasonal Factors⭐☀🌟
Cotton’s seasonal patterns:
March Timing: Northern Hemisphere planting begins (US, China), while Southern Hemisphere harvests peak (Brazil, Australia). Prices often firm up pre-planting due to supply uncertainty.
Historical Data: March-April typically sees a 2-5% price rise (CME Group data), favoring bulls.
Conclusion: Seasonal strength leans bullish for short-term gains.
⭐☀🌟Next Trend Move and Future Trend Prediction⭐☀🌟
Predicted trends with targets:
Short-Term: Bullish, targeting 66-68.
Medium-Term: Bullish, targeting 70-72.
Long-Term: Bullish, targeting 80-85.
⭐☀🌟Overall Summary Outlook⭐☀🌟
Current Price: 64.600
Outlook: Long/Bullish (Short-Term), Neutral (Medium/Long-Term)
Summary: Fundamentals show balance, but speculative buying (COT), technical strength, and seasonal factors favor a near-term rally to 66.00-67.00. Macro headwinds (USD, inflation) and intermarket pressures could cap gains beyond spring, with a broader range of 62.00-70.00 likely by year-end. No major bearish triggers unless supply surges or demand falters.
📌Keep in mind that these factors can change rapidly, and it's essential to stay up-to-date with market developments and adjust your analysis accordingly.
⚠️Trading Alert : News Releases and Position Management 📰 🗞️ 🚫🚏
As a reminder, news releases can have a significant impact on market prices and volatility. To minimize potential losses and protect your running positions,
we recommend the following:
Avoid taking new trades during news releases
Use trailing stop-loss orders to protect your running positions and lock in profits
💖Supporting our robbery plan 💥Hit the Boost Button💥 will enable us to effortlessly make and steal money 💰💵. Boost the strength of our robbery team. Every day in this market make money with ease by using the Thief Trading Style.🏆💪🤝❤️🎉🚀
I'll see you soon with another heist plan, so stay tuned 🤑🐱👤🤗🤩

Can further declines in DXY attract buyers of this commodity?ICEUS:CT1! futures have been on a steady decline for some time now. Could potential further declines in DXY attract buying interest of MARKETSCOM:COTTON ? Let's dig in.
Let us know what you think in the comments below.
Thank you.
74.2% of retail investor accounts lose money when trading CFDs with this provider. You should consider whether you understand how CFDs work and whether you can afford to take the high risk of losing your money. Past performance is not necessarily indicative of future results. The value of investments may fall as well as rise and the investor may not get back the amount initially invested. This content is not intended for nor applicable to residents of the UK. Cryptocurrency CFDs and spread bets are restricted in the UK for all retail clients.

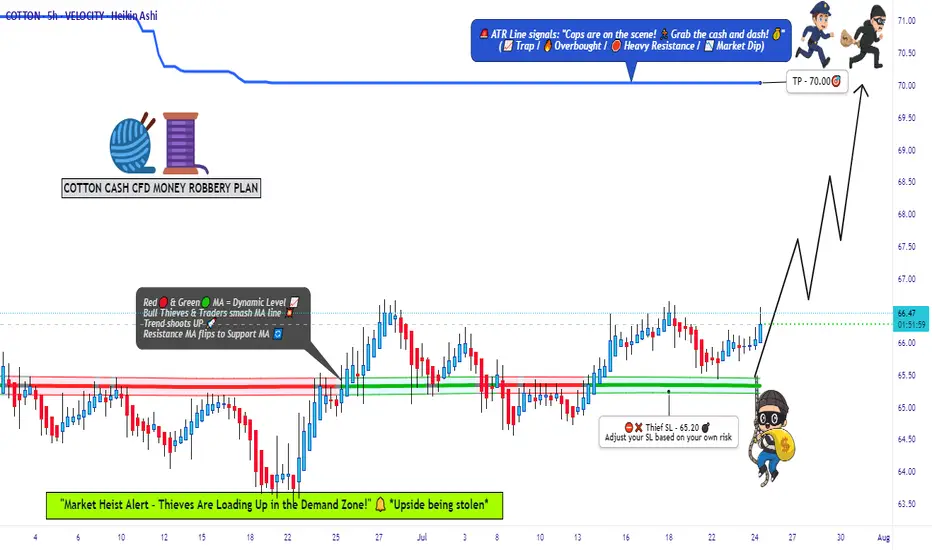
COTTON Cash CFD Commodities Market Bullish Heist Plan🌟Hi! Hola! Ola! Bonjour! Hallo!🌟
Dear Money Makers & Thieves, 🤑 💰🐱👤🐱🏍
Based on 🔥Thief Trading style technical and fundamental analysis🔥, here is our master plan to heist the COTTON Cash CFD Commodities Market market. Please adhere to the strategy I've outlined in the chart, which emphasizes long entry. Our aim is the high-risk Red Zone. Risky level, overbought market, consolidation, trend reversal, trap at the level where traders and bearish robbers are stronger. 🏆💸Book Profits wealthy and safe trade.💪🏆🎉
Entry 📈 : "The vault is wide open! Swipe the Bullish loot at any price - the heist is on!
however I advise placing Place Buy limit orders within a 15 or 30 minute timeframe. Entry from the most recent or closest low or high level should be in retest.
Stop Loss 🛑:
Thief SL placed at the recent / nearest low level Using the 2H timeframe (65.700) swing trade basis.
SL is based on your risk of the trade, lot size and how many multiple orders you have to take.
Target 🎯:
1st Target - 68.000 (or) Escape Before the Target
Final Target - 71.000 (or) Escape Before the Target
Scalpers, take note 👀 : only scalp on the Long side. If you have a lot of money, you can go straight away; if not, you can join swing traders and carry out the robbery plan. Use trailing SL to safeguard your money 💰.
📰🗞️Fundamental, Macro, COT, Sentimental Outlook:
COTTON Cash CFD Commodities Market is currently experiencing a bullish trend,., driven by several key factors.
🌳Fundamental Analysis
Supply and Demand: Global cotton production is expected to decline by 1.5% in 2024-25, while consumption is forecasted to increase by 2.5%.
Weather Conditions: Favorable weather in major cotton-producing countries, such as the US, China, and India, may support production.
🌳Macroeconomic Analysis
Global Economic Growth: The International Monetary Fund (IMF) forecasts global economic growth to slow down to 3.2% in 2024, which may impact cotton demand.
Trade Tensions: Ongoing trade tensions between the US and China may influence cotton trade and prices.
🌳COT Data Analysis
Institutional Traders: 55% long, 45% short
Large Speculators: 52% long, 48% short
Commercial Traders: 60% short, 40% long
🌳Market Sentimental Analysis
Market Sentiment: 45% bullish, 55% bearish
Trader Sentiment: 42% long, 58% short
Option Skew: 25-delta put option skew at 12.5
🌳Positioning Data Analysis
Bullish Trend: 40% likely.
Bearish Trend: 60% likely.
Neutral Trend: 10% likely.
🌳Overall Outlook
However, some analysts predict a bullish continuation, targeting 71.000. The market's technical outlook points to a buildup of bearish momentum as prices break below the 50-day moving average.
⚠️Trading Alert : News Releases and Position Management 📰 🗞️ 🚫🚏
As a reminder, news releases can have a significant impact on market prices and volatility. To minimize potential losses and protect your running positions,
we recommend the following:
Avoid taking new trades during news releases
Use trailing stop-loss orders to protect your running positions and lock in profits
📌Please note that this is a general analysis and not personalized investment advice. It's essential to consider your own risk tolerance and market analysis before making any investment decisions.
📌Keep in mind that these factors can change rapidly, and it's essential to stay up-to-date with market developments and adjust your analysis accordingly.
💖Supporting our robbery plan will enable us to effortlessly make and steal money 💰💵 Tell your friends, Colleagues and family to follow, like, and share. Boost the strength of our robbery team. Every day in this market make money with ease by using the Thief Trading Style.🏆💪🤝❤️🎉🚀
I'll see you soon with another heist plan, so stay tuned 🤑🐱👤🤗🤩

COTTON Supply Demand AnalysisSee Picture For Analysis and what I'm looking for as price is sitting inside higher timeframe supply with the overall trend = downtrend...Just wait for 3 different types of confirmation trade setups.

Cotton Futures: Decoding the Matrix of Market ForcesCotton, a seemingly unassuming commodity, is quietly aligning for a significant bullish move. But remember—this is not a prompt for reckless action. The entry is reserved for those who wait for the Daily timeframe to confirm the trend change.
The Codes of the Cotton Conspiracy
Code #1: The Commercial COT Index
Commercials are not merely dabbling—they are at an extreme in positioning, maxed out over a 26-week lookback. Their hands are heavy with longs, signaling a brewing storm that only the wise will prepare for.
Code #2: All-Time Extreme Positioning
For the first time since 2019, commercials hold their maximum long positions. Unlike 2019, these positions are at higher prices, implying deeper convictions. Meanwhile, Large Speculators are excessively short—a telltale sign that the tide may soon turn. Both are at an all-time extreme in positioning.
Code #3: Valuation Metrics
Cotton stands undervalued against the pillars of Gold, DXY, and Treasuries. The market’s mispricing is your opportunity, should you dare to seize it.
Code #4: Open Interest Analysis
Open Interest (OI) has been climbing steadily, a silent crescendo. Who is fueling this growth? The commercials—those orchestrators of market moves—are discreetly accumulating, signaling an impending bullish wave.
Code #5: ADX Over 60—The Endgame Approaches
The ADX has breached the critical threshold of 60, a harbinger of trend exhaustion. Confirmation lies in the ADX’s roll-over or the Large Speculators’ retreat from their short positions.
Code #6: Spread Divergence
As prices sink to new lows, the spread between the front and next month contracts defiantly rises—commercials are eager for the front month, a potent sign when paired with extreme positioning.
Bonus Codes: Hidden Layers of Accumulation
Insider Acc Index and ProGo hint at quiet accumulation. Momentum shows bullish divergence, %R enters a buy zone, and the oversold stochastic adds another layer of intrigue.
The Flaws in the System
Yet, no system is without its anomalies. Small Speculators are excessively long—a peculiar deviation, given their knack for misjudging bottoms. This anomaly presents two scenarios: a merciless long squeeze forcing out the naive, or a rare stroke of luck for the masses. Moreover, while True Seasonal is misaligned, remember that seasonals reflect historical ghosts, while positioning unveils the machinations of today's masters. Always lean towards positioning as your guide, not seasonals.
The Red Pill Awaits
The stage is set. The players are in position. The market whispers secrets only a few are willing to hear. Cotton’s matrix is laid bare—whether you act or remain a spectator is the choice only you can make.
But beware, the rabbit hole goes deeper than you think. Are you ready to follow?
Choose wisely.

Bearish Pressure Builds on Cotton: Strategic Levels to FollowCotton price is trading in a descending channel, signaling continued bearish momentum. A potential breakout below minor support suggests further downside ahead.
Analysis:
Current Price Action: Cotton is at 66.62, near minor support, with a potential break signaling further bearish continuation.
Key Levels: Resistance at 67.80–68.00; major support around 62.00 at the channel's lower boundary.
Projection: Sellers could push prices to 61.99, while a retest of 68.00 may confirm the bearish setup if rejected.
Trend Outlook: The downtrend remains unless prices break above the channel resistance.
Keep an eye on the evolving trade scenario.

Smart Money Positioned to LONG Cotton - COT StrategyDISCLAIMER: This is not trade advice. This is for educational purposes only to demonstrate how I am looking to participate in this market. There is significant risk involved in trading, do your own homework and due diligence.
COT Strategy
LONG
Cotton (CT)
My COT strategy has me on alert for long trades in CT if we get a confirmed bullish change of trend on the Daily timeframe.
COT Commercial Index: Buy Signal
Valuation: Undervalued vs Gold
Extreme Positioning: Commercials around max long of last 3 years - bullish. Small specs around max short of last 3 years - bullish.
OI Analysis: "Bubble Up" of positioning happening between commercials and large specs = bullish.
COT Small Spec Index: Buy Signal
Supplementary Indicators: UO & Momentum (not yet confirmed)
Remember, this is not a "Long Now" idea. These indicators are not timing tools. They simply tell us that this market could have a move of some significance to the upside, which we will participate in with a confirmed Daily trend change to the upside.
Good luck & good trading.

Upside Ahead for Cotton - COT Strategy BuyDISCLAIMER: This is not trade advice. This is for educational purposes only to demonstrate how I am looking to participate in this market. There is significant risk involved in trading, do your own homework and due diligence.
COT Strategy
LONG
Cotton (CT)
My COT strategy has me on alert for long trades in CT if we get a confirmed bullish change of trend on the Daily timeframe.
COT Commercial Index: Buy Signal
Extreme Positioning: Commercials more long than they've been in 3 years = bullish.
OI Analysis: We are seeing a "Bubble Up" between Commercials & Large Specs. This is a sign of a significant bottom being formed.
Valuation: Undervalued VS Gold
COT Small Spec Index: Buy Signal
Supplementary Indicators: %R Buy Signal
Remember, this is not a "Buy Now" idea. These indicators are not timing tools. They simply tell us that this market could have a move of some significance to the upside, which we will participate in with a confirmed Daily trend change to the upside.
Good luck & good trading.

Cotton # 2 Futures. The Epic 52-Week Highs BreakthroughThe main technical graph is for Cotton # 2 Futures that firmly up this year, with solid 13.5 percent performance in 2024 to this time.
The weekly Commitment of Traders report showed managed money cotton traders dropped 6k existing shorts and added 11.6k new longs during the week that ended 2/6. That raised their net long to 46,344 contracts. Commercial cotton hedgers added 17.5k short hedges for a 90,540 contract net short as of 2/6.
NOAA’s 7-day QPF has another band of heavy precip for the South/East. From the Gulf of TX through TN/NC/KY accumulations top out near 4”. Most of Northern LA, North/Central MS, Northern AL, and Northern GA will get ~2”. Central TX cotton area will also get ¾ to 1 ½” of precip to build up soil moisture reserves. Yesterday’s Drought Monitor confirmed there was still some D3-D4 in Northeast MS, but the total D3-D4 area has fallen from 29% to 2% since December 5th for the South-Southeast.
The monthly WASDE update showed a 150k bale lighter domestic cotton use, now at 1.75 million bales. Exports, however, were raised by 200k bales to offset. On net ending stocks tightened by 100k to 2.8 million in the report.
The main technical graph for Cotton # 2 futures ICEUS:CT1! indicates on 52-week highs breakthrough, as massive 20-years SMA supported the price over the past 12-15 months.
Weekly RSI(14) sub chart is to confirm this epic breakout, while COT data says, Largest speculators are still positive in net position all the time, keeping calm above Zero-level, while producers are to massively sell the production.

COTTON BUY Signal Supply And DemandSee chart above for analysis:
HTF:
-Trend = downtrend so any longs will be counter-trend and smaller risk + quick trade management recommended.
-Price inside HTF daily demand
LTF:
-confirmation 2.0 setup as there was no
quality confirmation created the first time price returned.
-Price broke downward ML
-Price removed opposing pivot supply.
-DBR created

COOTTON📊 COTTON
⏱ TIME: 1W
📝It is reaching very important areas for spot purchases, and you can make purchases in a gradual and managed manner. It has also been checked for fundamental analysis and is a sustainable and strong project for the future.
⭕️risk: LOW
📍buy market:89 $
📌TP1: 104 $
📌TP2: 116 $
📌TP3: 124 $
📌TP4: 150 $
⛔️SL: 74.5$

Cotton Long Trade IdeaCotton has been in a range for a long time. Currently, we see a reversal. The drought in the USA and Asia has significantly influenced the supply side, which is noticeable in the price. Also, seasonally, an upward trend is expected. However, the COT data from the COT report do not confirm the buy signal. Nevertheless, I still anticipate an upward trend if the fundamental situation in the market fully prevails

COTTON Supply Demand Analysis ShortSee Picture for analysis but with HTF correlation I'm thinking price will go down.

Cotton CFDs headed up to come lower? Cotton could be on the verge of a bullish correction before heading lower again.

Cotton Cash Contract - Rectangle PatternCommodity: Cotton Cash Contract
Introduction:
Hello everyone! Today, we'll be analyzing the Cotton Cash Contract on the daily scale traded on Pepperstone. After a clear downward trend, the contract seems to have entered a consolidation phase, possibly forming a rectangle pattern.
Analysis:
The rectangle pattern we're observing has been forming for around 196 days. The upper boundary of this pattern is approximately at $90, which has been tested three times so far. Meanwhile, the lower boundary is at around $77.50, with two touch points to date.
Currently, the price hasn't managed to cross above the 200 EMA. However, if we observe a breakout above the upper boundary, it would place the price above the 200 EMA, potentially paving the way for a long entry.
Upon a valid breakout, our projected price target would be $100.660, translating into a potential price rise of approximately 13%.
Conclusion:
The Cotton Cash Contract's technical analysis suggests a consolidation phase marked by a potential rectangle pattern. A breakout above the upper boundary might signal a shift to a bullish trend and could provide an opportunity for a long position.
As always, be sure to conduct your own research and risk management before investing.
Thank you for tuning into this analysis. Please like, share, and follow for more insights into the market. Happy trading!
Best regards,
Karim Subhieh

$CT1! Cotton... ICEUS:CT1! Cotton!
Bless ya cotton socks, they say! I been checking the commodity index and things may get funky...
Now I went through sugar, that's looking like it's little over extended, now here's a beautiful chart of cotton!
Let's dive into technicals:
Pattern: Wedge
Highs: 90.15 Lows: 72
Now if we break the lows of 72, I expect 67.55 and then 62.25 areas. However, if we break above the highs of 90.15, I expect 95 and then 105 areas. Now, there are certain things to keep in mind, everyone is discussing it and I've started it since start of the year that key words: Stagflation....and there's another one recession! The market is forward looking...Those that understand economic cycles saw this coming and I well recommending researching into that, as much as technicals are important but it's really important to understand the type of cycle we are in and I had mentioned a little in my past week ahead videos!
Have a great weekend, it's long one for some of us! 🌞
Trade Journal

COTTON SHORT Supply And Demand AnalysisSee picture for top-down analysis.
Higher Timeframe:
-Price reacting off of squeeze daily supply + higher timeframe trend = down/sideways
Lower Timeframe:
-1hr broke upward trend line + removed opposing demand zones and a nice 1hr RBD supply was created. Need pullback into 1hr supply.


easyMarkets Cotton Daily - Quick Technical OverviewDisclaimer:
easyMarkets Account on TradingView allows you to combine easyMarkets industry leading conditions, regulated trading and tight fixed spreads with TradingView's powerful social network for traders, advanced charting and analytics. Access no slippage on limit orders, tight fixed spreads, negative balance protection, no hidden fees or commission, and seamless integration.
Any opinions, news, research, analyses, prices, other information, or links to third-party sites contained on this website are provided on an "as-is" basis, are intended only to be informative, is not an advice nor a recommendation, nor research, or a record of our trading prices, or an offer of, or solicitation for a transaction in any financial instrument and thus should not be treated as such. The information provided does not involve any specific investment objectives, financial situation and needs of any specific person who may receive it. Please be aware, that past performance is not a reliable indicator of future performance and/or results. Past Performance or Forward-looking scenarios based upon the reasonable beliefs of the third-party provider are not a guarantee of future performance. Actual results may differ materially from those anticipated in forward-looking or past performance statements. easyMarkets makes no representation or warranty and assumes no liability as to the accuracy or completeness of the information provided, nor any loss arising from any investment based on a recommendation, forecast or any information supplied by any third-party.

CT1! Potential For Bearish DropLooking at the H4 chart, my overall bias for CT1! is bearish due to the current price being below the Ichimoku cloud, indicating a bearish market.
Looking for a sell entry at 85.49, where the 23.6% Fibonacci line and overlap resistance is.
Stop loss will be at 88.88, where the recent high is. Take profit will be at 77.50, where the previous swing low is.
Please be advised that the information presented on TradingView is provided to Vantage (‘Vantage Global Limited’, ‘we’) by a third-party provider (‘Everest Fortune Group’). Please be reminded that you are solely responsible for the trading decisions on your account. There is a very high degree of risk involved in trading. Any information and/or content is intended entirely for research, educational and informational purposes only and does not constitute investment or consultation advice or investment strategy. The information is not tailored to the investment needs of any specific person and therefore does not involve a consideration of any of the investment objectives, financial situation or needs of any viewer that may receive it. Kindly also note that past performance is not a reliable indicator of future results. Actual results may differ materially from those anticipated in forward-looking or past performance statements. We assume no liability as to the accuracy or completeness of any of the information and/or content provided herein and the Company cannot be held responsible for any omission, mistake nor for any loss or damage including without limitation to any loss of profit which may arise from reliance on any information supplied by Everest Fortune Group.
