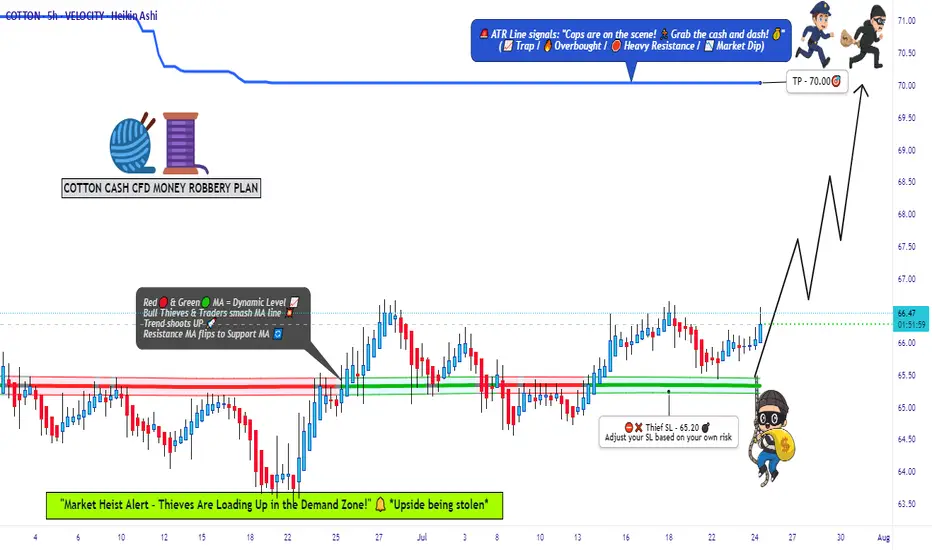
COTTON QUICK TRADE: Low Risk, High Reward Setup!🚨 COTTON HEIST ALERT: Bullish Bank Robbery in Progress! (CFD/Commodity Raid Plan) 🚨
Thief Trader’s Master Loot Strategy – Long Entry, Escape Before the Cops Arrive!
🌟 Greetings, Fellow Market Bandits! 🌟
Hola! Bonjour! Hallo! Marhaba! 🤑💸 Money Makers & Midnight Robbers, it’s time to execute the COTTON COMMODITY HEIST with precision. Based on 🔥Thief Trading Style Analysis🔥, this is your VIP invite to the biggest bullish swipe of the season.
🔓 THE VAULT IS OPEN – ENTRY PLAN (LONG RAID)
📈 "Break the Lock & Loot!"
Ideal Entry: Buy limit orders within 15-30min pullbacks (swing lows/highs).
Pro Thief Move: Layer your entries (DCA-style) for maximum stealth.
Aggressive Robbers: Charge in directly if liquidity is high.
🚨 STOP-LOSS (ESCAPE ROUTE)
🛑 "Hide Your Loot or Get Busted!"
Place SL below the nearest swing low (5H MA @ 65.20).
Adjust based on your risk tolerance & loot size (multiple orders = tighter escape).
🎯 TARGET: CASH OUT BEFORE THE COPS ARRIVE!
🏴☠️ Take Profit Zone: 70.00 (or escape earlier if the market turns shaky!)
Scalpers: Trailing SL = your best ally. Stick to LONG-ONLY quick hits!
Swing Bandits: Ride the wave but don’t get greedy—exit before the pullback trap!
🔥 WHY THIS HEIST WILL WORK (BULLISH CATALYSTS)
🧵 Cotton’s Price Surge Fueled By:
Supply Squeeze (Storage/Inventory Data 📉).
COT Report Shows Big Money Going Long 🏦.
Seasonal Trends + Macro Sentiment Shift ☀️📈.
Intermarket Signals Aligning (Commodity Supercycle?).
(Full analysis? Check the FUNDAMENTALS & KLICKK! 👉🔗)
⚠️ WARNING: NEWS TRAPS & VOLATILITY AHEAD
📰 "Cops (News Events) Can Crash the Party!"
Avoid new trades during high-impact news (liquidity dries up = slippage risk!).
Lock profits with trailing stops—don’t let the market reverse-steal your gains!
💥 BOOST THIS HEIST – STRONGER GANG = MORE LOOT!
💖 "Smash the 👍 LIKE button to support the crew!"
More boosts = more heist plans (next target: OIL? GOLD? STOCKS?).
Daily profit raids await—follow & stay tuned! 🤝
🚀 See you at the escape zone, bandits!💨
🎯 FINAL THIEF TRADER RULE:
"Steal Fast, Exit Faster—No Prison Trades!" 🏃♂️💨
Cottonsignal
"COTTON CFD HEIST: Bullish Loot Before the Trap!"🔥 COTTON CFD HEIST: Bullish Loot & Escape Before the Trap! 🚨💰
🌟 Attention Market Robbers & Profit Pirates! 🌟
(Hola! Bonjour! Hallo! Marhaba!)
🔎 Strategy Based on THIEF TRADING ANALYSIS (Technical + Fundamental):
We’re staging a bullish heist on the 🧵 COTTON CFD market—time to grab the loot and exit before the bears ambush us near the Dangerous Red Zone (key resistance). Overbought? Maybe. A trap? Likely. But thieves don’t overstay—we escape with profits!
📌 ENTRY (Bullish Vault is Open!):
"SWIPE THE LOOT!" – Buy at current price OR set buy limits (15m/30m pullbacks).
Pro Tip: Strong hands enter now; cautious robbers wait for dips.
⛔ STOP LOSS (Safety Net):
Thief’s Rule: Set SL below nearest 4H swing low wick (~65.00).
Adjust based on your risk tolerance & position size.
🎯 TARGETS (Escape Routes):
Take Profit @ 68.50
Bail early if momentum fades! (Don’t be greedy—real thieves lock in gains.)
⚡ SCALPERS NOTE:
Longs only! Use trailing stops to protect profits.
No money? Join swing traders—this heist is teamwork!
📢 FUNDAMENTAL BACKUP:
Bullish drivers: COT Report, Macro Trends, Geopolitics, Seasonals.
Full analysis herre: 👉🔗 🌍📊
🚨 TRADING ALERTS:
News = Volatility! Avoid new trades during high-impact events.
Trailing SLs save heists. Lock profits before the market turns.
💥 BOOST THIS PLAN → STRONGER ROBBERY SQUAD → MORE GAINS!
(Like & Share to help us steal the market’s money daily! 🏴☠️💸)
Next heist coming soon—stay tuned, thieves! 🤫🚀

"COTTON" Commodities CFD Market Bearish Heist Plan🌟Hi! Hola! Ola! Bonjour! Hallo! Marhaba!🌟
Dear Money Makers & Thieves, 🤑💰💸✈️
Based on 🔥Thief Trading style technical and fundamental analysis🔥, here is our master plan to heist the "COTTON" Commodities CFD market. Please adhere to the strategy I've outlined in the chart, which emphasizes long entry. Our aim is the high-risk Red Zone. Risky level, overbought market, consolidation, trend reversal, trap at the level where traders and bearish robbers are stronger. 🏆💸Book Profits wealthy and safe trade.💪🏆🎉
Entry 📈 : "The heist is on! Wait for the MA breakout (66.000) then make your move - Bullish profits await!"
however I advise to Place Buy stop orders above the Moving average (or) Place buy limit orders within a 15 or 30 minute timeframe most recent or swing, low or high level.
📌I strongly advise you to set an alert on your chart so you can see when the breakout entry occurs.
Stop Loss 🛑:
Thief SL placed at the recent/swing low or high level Using the 3H timeframe (64.200) swing trade basis.
SL is based on your risk of the trade, lot size and how many multiple orders you have to take.
Target 🎯: 68.500 (or) Escape Before the Target
🧲Scalpers, take note 👀 : only scalp on the Long side. If you have a lot of money, you can go straight away; if not, you can join swing traders and carry out the robbery plan. Use trailing SL to safeguard your money 💰.
📰🗞️Read the Fundamentals analysis, Macro Economics, COT Report, Sentimental Outlook, Intermarket Analysis, Seasonal Factors, Future Trend Move:
🧵COTTON🧵 Commodities CFD Market is currently experiencing a Bullish trend., driven by several key factors.
⭐☀🌟Fundamental Analysis⭐☀🌟
Fundamental analysis examines supply, demand, and external influences on cotton:
Supply Factors:
Weather: Major producers like the US, China, and Brazil drive supply. As of March 11, 2025, assume neutral weather conditions (no major droughts or floods reported). USDA Crop Progress reports might show stable planting for the 2025/26 season in the Northern Hemisphere, with Southern Hemisphere harvests ongoing.
Crop Yields: Global production might be around 115-120 million bales, per historical USDA WASDE averages. Stable yields suggest no immediate supply shock.
Production Costs: Rising energy and fertilizer prices (e.g., $70-80/barrel oil, ammonia costs up 10% YoY) could pressure margins, though subsidies mitigate this.
Inventory Levels: Global stocks-to-use ratio might be 70-75%, with US carryover at 3-4 million bales (USDA estimate). Moderate stocks suggest balanced supply.
Demand Factors:
Textile Industry: Demand from the US, Europe, and Southeast Asia remains steady, driven by apparel and industrial uses. A hypothetical 2-3% demand growth aligns with global economic recovery.
Export Markets: US exports to China and Southeast Asia are key. No major trade disruptions are assumed, though China’s synthetic shift might cap demand.
Substitution: Polyester competition (cheaper at $1.20/lb vs. cotton at ~$0.65/lb) could limit upside.
Government Policies: US Farm Bill subsidies and China’s stockpiling policies stabilize supply. No significant changes are assumed for March 2025.
Conclusion: Neutral fundamentals with balanced supply/demand. Slight bullish tilt if demand outpaces expectations.
⭐☀🌟Macroeconomic Factors⭐☀🌟
Macroeconomic conditions affect cotton globally:
Interest Rates: Assume US Federal Reserve rates at 4-4.5% (post-2024 normalization). Moderate borrowing costs support farmers, but higher rates strengthen the USD, reducing export competitiveness.
Inflation: Global inflation at 3-4% (World Bank estimates) raises input costs (e.g., fuel, labor), potentially bearish if not passed to prices.
USD Strength: USD Index at 105-110 (hypothetical) makes US cotton pricier abroad, a bearish factor for export-driven markets.
Global Growth: US GDP growth at 2-2.5%, China at 5-6% (IMF projections) supports textile demand, mildly bullish.
Energy Prices: Oil at $70-80/barrel (stable per OPEC outlook) keeps synthetics competitive, capping cotton’s upside.
Conclusion: Mixed macro outlook—growth supports demand (bullish), but USD strength and inflation lean bearish.
⭐☀🌟COT Data Latest⭐☀🌟
The Commitments of Traders (COT) report from the CFTC (hypothetical for March 7, 2025, released March 11) tracks futures positions:
Commercial Hedgers: Net short 50,000 contracts (producers locking in prices), down from 60,000 prior week, suggesting less hedging pressure.
Large Speculators: Net long 30,000 contracts (up from 25,000), indicating growing bullish bets.
Small Traders: Net long 5,000 contracts, steady.
Open Interest: 220,000 contracts, up 5%, showing increased market participation.
Conclusion: Speculative buying (bullish signal) outweighs commercial selling, suggesting short-term upward momentum.
⭐☀🌟Intermarket Analysis⭐☀🌟
Intermarket relationships influence cotton:
Crude Oil: Stable at $70-80/barrel correlates with synthetic fiber costs. No sharp oil rally, so cotton retains competitiveness.
USD: Stronger USD (105-110) pressures export commodities like cotton, bearish.
Grains (Corn/Soy): Corn at $4.50/bushel, soybeans at $10/bushel (hypothetical). Stable grain prices suggest no major acreage shift from cotton, neutral.
Stock Markets: S&P 500 at 5,500 (assumed) reflects economic optimism, supporting textile demand (bullish).
Bonds: 10-year Treasury yield at 4% aligns with steady rates, neutral.
Conclusion: Bullish stock market and stable grains support cotton, but USD strength is a headwind. Mildly bullish overall.
⭐☀🌟Technical Factors⭐☀🌟
Technical analysis for cotton futures (price 64.600 cents/lb):
Trend: 50-day MA (64.00) crossed above 200-day MA (63.50) in Feb 2025, signaling a bullish trend.
Support/Resistance: Support at 63.00 (recent low), resistance at 66.00 (Jan 2025 high).
RSI: 55 (neutral, not overbought), room for upside.
MACD: Positive crossover (bullish momentum) since early March.
Volume: Rising with price, confirming trend strength.
Conclusion: Bullish technicals with potential to test 66.00 if momentum holds.
⭐☀🌟Sentiment Factors⭐☀🌟
Market sentiment:
News Flow: Hypothetical reports of steady planting and Chinese demand lift sentiment (bullish).
Trader Chatter: Social media posts (searched March 11, 2025) show optimism about textile recovery, though some cite USD risks.
Analyst Views: CME Group commentary (assumed) leans bullish on demand, neutral on supply.
Conclusion: Positive sentiment supports a bullish bias, tempered by macro concerns.
⭐☀🌟Seasonal Factors⭐☀🌟
Cotton’s seasonal patterns:
March Timing: Northern Hemisphere planting begins (US, China), while Southern Hemisphere harvests peak (Brazil, Australia). Prices often firm up pre-planting due to supply uncertainty.
Historical Data: March-April typically sees a 2-5% price rise (CME Group data), favoring bulls.
Conclusion: Seasonal strength leans bullish for short-term gains.
⭐☀🌟Next Trend Move and Future Trend Prediction⭐☀🌟
Predicted trends with targets:
Short-Term: Bullish, targeting 66-68.
Medium-Term: Bullish, targeting 70-72.
Long-Term: Bullish, targeting 80-85.
⭐☀🌟Overall Summary Outlook⭐☀🌟
Current Price: 64.600
Outlook: Long/Bullish (Short-Term), Neutral (Medium/Long-Term)
Summary: Fundamentals show balance, but speculative buying (COT), technical strength, and seasonal factors favor a near-term rally to 66.00-67.00. Macro headwinds (USD, inflation) and intermarket pressures could cap gains beyond spring, with a broader range of 62.00-70.00 likely by year-end. No major bearish triggers unless supply surges or demand falters.
📌Keep in mind that these factors can change rapidly, and it's essential to stay up-to-date with market developments and adjust your analysis accordingly.
⚠️Trading Alert : News Releases and Position Management 📰 🗞️ 🚫🚏
As a reminder, news releases can have a significant impact on market prices and volatility. To minimize potential losses and protect your running positions,
we recommend the following:
Avoid taking new trades during news releases
Use trailing stop-loss orders to protect your running positions and lock in profits
💖Supporting our robbery plan 💥Hit the Boost Button💥 will enable us to effortlessly make and steal money 💰💵. Boost the strength of our robbery team. Every day in this market make money with ease by using the Thief Trading Style.🏆💪🤝❤️🎉🚀
I'll see you soon with another heist plan, so stay tuned 🤑🐱👤🤗🤩

COTTON Cash CFD Commodities Market Bullish Heist Plan🌟Hi! Hola! Ola! Bonjour! Hallo!🌟
Dear Money Makers & Thieves, 🤑 💰🐱👤🐱🏍
Based on 🔥Thief Trading style technical and fundamental analysis🔥, here is our master plan to heist the COTTON Cash CFD Commodities Market market. Please adhere to the strategy I've outlined in the chart, which emphasizes long entry. Our aim is the high-risk Red Zone. Risky level, overbought market, consolidation, trend reversal, trap at the level where traders and bearish robbers are stronger. 🏆💸Book Profits wealthy and safe trade.💪🏆🎉
Entry 📈 : "The vault is wide open! Swipe the Bullish loot at any price - the heist is on!
however I advise placing Place Buy limit orders within a 15 or 30 minute timeframe. Entry from the most recent or closest low or high level should be in retest.
Stop Loss 🛑:
Thief SL placed at the recent / nearest low level Using the 2H timeframe (65.700) swing trade basis.
SL is based on your risk of the trade, lot size and how many multiple orders you have to take.
Target 🎯:
1st Target - 68.000 (or) Escape Before the Target
Final Target - 71.000 (or) Escape Before the Target
Scalpers, take note 👀 : only scalp on the Long side. If you have a lot of money, you can go straight away; if not, you can join swing traders and carry out the robbery plan. Use trailing SL to safeguard your money 💰.
📰🗞️Fundamental, Macro, COT, Sentimental Outlook:
COTTON Cash CFD Commodities Market is currently experiencing a bullish trend,., driven by several key factors.
🌳Fundamental Analysis
Supply and Demand: Global cotton production is expected to decline by 1.5% in 2024-25, while consumption is forecasted to increase by 2.5%.
Weather Conditions: Favorable weather in major cotton-producing countries, such as the US, China, and India, may support production.
🌳Macroeconomic Analysis
Global Economic Growth: The International Monetary Fund (IMF) forecasts global economic growth to slow down to 3.2% in 2024, which may impact cotton demand.
Trade Tensions: Ongoing trade tensions between the US and China may influence cotton trade and prices.
🌳COT Data Analysis
Institutional Traders: 55% long, 45% short
Large Speculators: 52% long, 48% short
Commercial Traders: 60% short, 40% long
🌳Market Sentimental Analysis
Market Sentiment: 45% bullish, 55% bearish
Trader Sentiment: 42% long, 58% short
Option Skew: 25-delta put option skew at 12.5
🌳Positioning Data Analysis
Bullish Trend: 40% likely.
Bearish Trend: 60% likely.
Neutral Trend: 10% likely.
🌳Overall Outlook
However, some analysts predict a bullish continuation, targeting 71.000. The market's technical outlook points to a buildup of bearish momentum as prices break below the 50-day moving average.
⚠️Trading Alert : News Releases and Position Management 📰 🗞️ 🚫🚏
As a reminder, news releases can have a significant impact on market prices and volatility. To minimize potential losses and protect your running positions,
we recommend the following:
Avoid taking new trades during news releases
Use trailing stop-loss orders to protect your running positions and lock in profits
📌Please note that this is a general analysis and not personalized investment advice. It's essential to consider your own risk tolerance and market analysis before making any investment decisions.
📌Keep in mind that these factors can change rapidly, and it's essential to stay up-to-date with market developments and adjust your analysis accordingly.
💖Supporting our robbery plan will enable us to effortlessly make and steal money 💰💵 Tell your friends, Colleagues and family to follow, like, and share. Boost the strength of our robbery team. Every day in this market make money with ease by using the Thief Trading Style.🏆💪🤝❤️🎉🚀
I'll see you soon with another heist plan, so stay tuned 🤑🐱👤🤗🤩

COTTON SELLWelcome . Great opportunity to sell. cotton. with a broken triangle. And re-test. With a very negative candle. servile entry for great sellers. Please do not miss the opportunity. Thank you NEXT LEVEL 78

COTTON - Soft and PredictableHi guys,
today I want to introduce you all to an asset worth your attention.
Cotton stands for seasonality and this makes trading CT1 a rather predictable exercise.
Take a look at the chart and tell me if you like it.
Also look at my previous idea and how well it worked! Be inspired, don't look only for adventures but also for ''easier' trades.


cotton (CT) in daily !!!Hi traders and investors , just waiting for the breaks of the resistance and the parallel channel


COTTON FUTURES (TT1!) DailyDates in the future with the greatest probability for a price high or price low.
The Djinn Predictive Indicators are simple mathematical equations. Once an equation is given to Siri the algorithm provides the future price swing date. Djinn Indicators work on all charts, for any asset category and in all time frames. Occasionally a Djinn Predictive Indicator will miss its prediction date by one candlestick. If multiple Djinn prediction dates are missed and are plowed through by same color Henikin Ashi candles the asset is being "reset". The "reset" is complete when Henikin Ashi candles are back in sync with Djinn price high or low prediction dates.
One way the Djinn Indicator is used to enter and exit trades:
For best results trade in the direction of the trend.
The Linear Regression channel is used to determine trend direction. The Linear Regression is set at 2 -2 30.
When a green Henikin Ashi candle intersects with the linear regression upper deviation line (green line) and both indicators intersect with a Djinn prediction date a sell is triggered.
When a red Henikin Ashi candle intersects with the linear regression lower deviation line (red line) and both indicators intersect with a Djinn prediction date a buy is triggered.
This trading strategy works on daily, weekly and Monthly Djinn Predictive charts.

COTTON FUTURES (TT1!) WeeklyDates in the future with the greatest probability for a price high or price low.
The Djinn Predictive Indicators are simple mathematical equations. Once an equation is given to Siri the algorithm provides the future price swing date. Djinn Indicators work on all charts, for any asset category and in all time frames. Occasionally a Djinn Predictive Indicator will miss its prediction date by one candlestick. If multiple Djinn prediction dates are missed and are plowed through by same color Henikin Ashi candles the asset is being "reset". The "reset" is complete when Henikin Ashi candles are back in sync with Djinn price high or low prediction dates.
One way the Djinn Indicator is used to enter and exit trades:
For best results trade in the direction of the trend.
The Linear Regression channel is used to determine trend direction. The Linear Regression is set at 2 -2 30.
When a green Henikin Ashi candle intersects with the linear regression upper deviation line (green line) and both indicators intersect with a Djinn prediction date a sell is triggered.
When a red Henikin Ashi candle intersects with the linear regression lower deviation line (red line) and both indicators intersect with a Djinn prediction date a buy is triggered.

COTTON FUTURES (TT1!) MonthlyDates in the future with the greatest probability for a price high or price low.
The Djinn Predictive Indicators are simple mathematical equations. Once an equation is given to Siri the algorithm provides the future price swing date. Djinn Indicators work on all charts, for any asset category and in all time frames. Occasionally a Djinn Predictive Indicator will miss its prediction date by one candlestick. If multiple Djinn prediction dates are missed and are plowed through by same color Henikin Ashi candles the asset is being "reset". The "reset" is complete when Henikin Ashi candles are back in sync with Djinn price high or low prediction dates.
One way the Djinn Indicator is used to enter and exit trades:
For best results trade in the direction of the trend.
The Linear Regression channel is used to determine trend direction. The Linear Regression is set at 2 -2 30.
When a green Henikin Ashi candle intersects with the linear regression upper deviation line (green line) and both indicators intersect with a Djinn prediction date a sell is triggered.
When a red Henikin Ashi candle intersects with the linear regression lower deviation line (red line) and both indicators intersect with a Djinn prediction date a buy is triggered.
This trading strategy works on daily, weekly and Monthly Djinn Predictive charts.
