EUR/CAD: Shorting the Climactic Rally Near 1.6000The strong rally in EUR/CAD has pushed the pair into extreme territory, approaching a major psychological and structural resistance zone. While momentum has been strong, this looks like a potential climactic or "blow-off" top, offering a highly favorable risk/reward opportunity to short the pair in alignment with the weak underlying Euro fundamentals.
The Fundamental Why 📰
The core thesis remains bearish for the Euro. The European Central Bank (ECB) maintains a distinctly dovish tone, signaling a willingness to ease policy further to support a slowing Eurozone economy. This fundamental headwind suggests that extreme rallies in Euro pairs are often exhaustive and present prime shorting opportunities.
The Technical Picture 📊
Major Supply Zone: The price is entering a critical multi-month supply zone between 1.5950 and the key psychological level of 1.6000. This is a major ceiling where significant selling pressure is anticipated.
Fibonacci Extension: This area aligns with a key Fibonacci extension level (1.272) from the last major impulse wave, a common zone where trending moves become exhausted and reversals begin.
Pronounced RSI Divergence: A clear bearish divergence is forming on the daily chart. As price makes this final push to a new high, the Relative Strength Index (RSI) is making a significantly lower high, signaling a deep exhaustion of buying momentum.
The Counter-Trade Rationale 🧠
This is a high-level fade. We are positioning for a reversal at a major, technically significant ceiling. The extreme price extension, combined with clear momentum divergence, indicates that the risk of buying at these highs is substantial. By shorting here, we are betting that the powerful technical resistance and weak fundamentals will trigger a significant correction.
The Setup ✅
📉 Pair: EUR/CAD
👉 Direction: Short
⛔️ Stop Loss: 1.63230
🎯 Entry: 1.59490
✅ Take Profit: 1.52008
⚖️ Risk/Reward: ≈ 2:1
Countertrend

AUD/JPY: Fading the Rally at a Major Resistance ZoneWhile AUD/JPY has been in a clear uptrend, the rally is now approaching a significant technical ceiling where sellers have previously stepped in. We see a compelling opportunity for a counter-trend short, betting that this resistance level will hold and that the current bullish momentum is showing signs of exhaustion.
This trade is for those watching for a market turn, offering a well-defined risk-to-reward setup for a swing position.
🤔 The "Why" Behind the Short Setup
📰 The Fundamental Risk
The Australian Dollar is a "risk-on" currency, meaning it performs well when global markets are optimistic. The Japanese Yen, however, is a classic "safe-haven" asset that strengthens during times of uncertainty. With the upcoming high-impact Australian CPI data, any sign of economic weakness could disappoint the market, increase pressure on the RBA, and trigger a "risk-off" move that would benefit the Yen and send AUD/JPY lower.
📊 The Technical Ceiling
The chart tells a clear story. The price is currently testing a major resistance zone. Attempting to short near a strong ceiling like this provides a strategic entry to capture a potential trend reversal. We are essentially betting that the trend's multi-week momentum will stall and reverse from this key technical juncture.
✅ The High-Clarity SHORT Trade Setup
📉 Pair: AUD/JPY
👉 Direction: Short
⛔️ Entry: 96.716
🎯 Take Profit: 92.080
🛑 Stop Loss: 98.907
Rationale: This setup plays for a significant swing move. The wide stop loss is designed to withstand volatility from news events, while the deep take profit targets a full reversal back to major support levels seen earlier in the year.

GBPJPY: Bullish 5-0 Setup on the 4-Hourly ChartFrom a higher-timeframe perspective, GBPJPY might seem like it's perfect for a shorting opportunity, but that doesn't mean there aren't great opportunities to go long as well.
Right now, on the 4-hourly chart, I've spotted an interesting Bullish 5-0 setup. To many traders, this might look like an invalid entry. But here’s the catch—if you know how to interpret candlestick patterns correctly, this is exactly the kind of setup that can pay off.
Here’s the Plan:
Bullish 5-0 Pattern Entry: Keep an eye on candlestick confirmations at the current zone.
Risk Management: Identify the key levels clearly—once price reaches these levels, shift your stops to entry to achieve a risk-free trade.
Key Reminder:
It’s not always about being right in direction; it’s about spotting clear entry setups, managing your risk effectively, and protecting your capital.
👉 Golden Rule: Secure a risk-free trade as soon as possible!
Have you traded the Bullish 5-0 before? Do you have similar experiences spotting opportunities against the broader trend?
Let’s discuss below! Happy trading, everyone! 🚀

May 8, 2025 EURUSD Buy📈 Bias: Countertrend Long | Risk: 1% (2 entries)
🎯 Target: Fill Asia range / 15mOB for LH
🧠 Reasoning:
London session opened inside a 5m OB, followed by a BOS in our direction.
Even though it's a countertrend trade, it aligns with the idea of forming a lower high from a strong reaction zone.
Waiting for 2 entries:
🔹 1 at the 5m OB
🔹 1 at a refined 1m OB

Bearish Shark Pattern with a Massive Profit FactorThis is how trading should be done . I've just spotted a Bearish Shark Pattern on the Weekly Chart and while it's not perfect, it's still a great trade worth keeping on the radar. The market has been hovering around the entry price for weeks, which tells me something is brewing.
The Smart Approach:
Now, I’m not entering based on the Weekly Chart alone , that would require a stop-loss that’s way too wide. Instead, I look for an execution timeframe within three levels down. That means the lowest timeframe I’d engage from this setup is the 4-hourly chart .
But here’s the twist...
The Trade Setup:
I spotted another Bearish Shark Pattern on the 15-minute chart.
What did I do?
> I traded what I saw. Simple as that.
It’s not always about having the "perfect" timeframe. It’s about:
Seeing a valid setup
Knowing your structure
And having a clear trade management plan.
Key Rule:
Once the market reaches a certain level, I’ll shift my stop to entry, securing a risk-free trade. That’s always the goal.
Golden Rule in Trading: “Don’t lose your capital.”
The Reward:
If this trade hits my final target, I’ll walk away with a Profit Factor of 27.45 .
That means for every dollar I risk, the projected return is $27.45. Let that sink in.
So now the question is - how much of your equity would you be risking on a trade like this? Would you go big, or stick to your usual risk percentage?
Let me know in the comments, how would you manage this kind of high-reward setup?
Stay sharp and happy trading, everyone! 🚀

USDJPY with a 2.95 Profit Factor on the 1-Hourly ChartI’m keeping a close eye on USDJPY right now, and here’s why:
- High Profit Factor : Target 1 offers a whopping 2.95 Profit Factor, which is quite attractive.
- Timing : Even though NFP is coming up tomorrow, this trade is on the 1-hourly chart. It’s possible that price action could reach my first target or meet the criteria that allows me to shift my stop to entry, thus achieving a risk-free trade, before the big event.
Key Points to Remember:
- Volatility Alert : NFP can cause sudden market movements. Keep that in mind and monitor your positions closely.
- Risk Management : Once the market fulfills the criteria for Target 1, I plan to shift my stop to entry. This approach helps protect any unrealized gains and reduces stress during high-volatility news.
If you’re considering this trade, stay cautious around the NFP release, and remember to include our stop-loss buffer to manage your risk effectively.
What’s your take on USDJPY heading into NFP? Are you eyeing any other setups? Share your thoughts below!
Happy trading, everyone! 🚀

MASI Short- Weekly timeframe: Bullish trend
- 4H timeframe
- Entry price (16021.76)
-Target: 15446.33
This is a short term counter trend short position into a weekly key level, let's see how it's going to play

DAX // risky phase of the correctionThe market has printed a deep correction of the last weekly impulse.
The correction fibo 61.8 is already done, and we may be heading towards the 78.6
There is a clean (not yet tested) H1 breakout, where entry signals have some chance, but don't forget, we are deep into the correction, where the accumulation phase may be built up with frequent changes in direction.
———
Orange lines represent impulse bases on major timeframes, signaling the direction and validity of the prevailing trend by acting as key levels where significant momentum originated.
———
Stay grounded, stay present. 🏄🏼♂️
<<boost🚀 if you enjoy💚

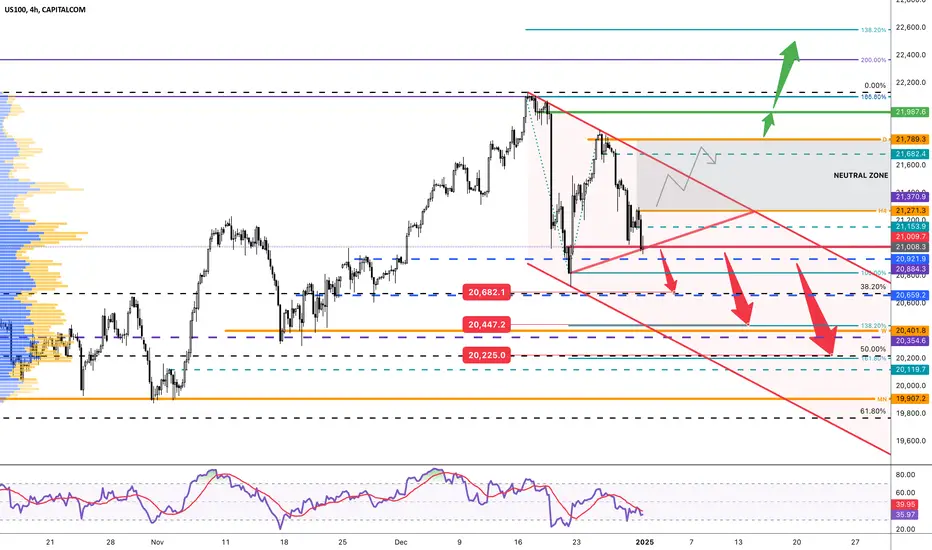
NASDAQ // daily countertrendThe daily countertrend is valid with 1-2-3 waves down.
As long as the H4 short trend is also valid (below the H4 impulse base), the market is in the expansion phase of the short countertrend.
Targets are correction fibo 38.2 and 50, and the H4 target fibo 138.2 in line with the weekly impulse base.
This is the correction. Keep it in mind when calculating position size!
———
Orange lines represent impulse bases on major timeframes, signaling the direction and validity of the prevailing trend by acting as key levels where significant momentum originated.
———
Stay grounded, stay present. 🏄🏼♂️
<<boost🚀 if you enjoy💚
GOLD // short countertrendThe trend is short on every major timeframe, and the market has a nice room till the correction fibo 38.2
There are 2 clean (not yet tested) H4 breakouts that can be excellent entry zones for short trades.
———
Orange lines represent impulse bases on major timeframes, signaling the direction and validity of the prevailing trend by acting as key levels where significant momentum originated.
———
Stay grounded, stay present. 🏄🏼♂️
<<boost🚀 if you enjoy💚

BITCOIN // daily countertrendAfter reaching the weekly target fibo 323.6 , the market broke the structure on the weekly chart (closed below the weekly impulse base).
This impulse looks nice on the H4 chart as well, and a long countertrend of this counter-impulse has been formed.
This minor long trend (the countertrend of the countertrend) is breaking at the short trigger zone (red).
If this happens, the correction fibo 38.2, and later even the 50 can become target in the valid countertrend.
———
Orange lines represent impulse bases on major timeframes, signaling the direction and validity of the prevailing trend by acting as key levels where significant momentum originated.
———
We may not know what will happen, but we can prepare ourselves to respond effectively to whatever unfolds.
Stay grounded, stay present. 🏄🏼♂️
Your comments and support are appreciated! 👊🏼

EURUSD // countertrend expansionThe countertrend is valid on H4, so if the trigger level is crossed up with a trigger candle on M15 or H1, the daily breakdown and the H4 breakdown zone become target.
———
We may not know what will happen, but we can prepare ourselves to respond effectively to whatever unfolds.
Stay grounded, stay present. 🏄🏼♂️
Your comments and support are appreciated! 👊🏼

GOLD // How can it reach the correction fibo 38.2?The daily short countertrend is valid, and the W/D/H4 timeframes are in sync, resulting in my bearish view.
As long as the daily impulse base is not broken by the buyers, there are two clean breakouts that may trigger the shorts and lead the price to the target zone.
———
We may not know what will happen, but we can prepare ourselves to respond effectively to whatever unfolds.
Stay grounded, stay present. 🏄🏼♂️
Your comments and support are appreciated! 👊🏼

SOLANA // Will the correction reach 61.8?The daily short countertrend is valid, and the market has reached the correction fibo 50 level.
The question is: will it reach 61.8?
If the market can significantly break the last clear H4 breakout, it may have a chance.
If it turns up, and there is a significant (trigger) candle in the long trigger zone, my target is the weekly target fibo 200.
———
Stay grounded, stay present. 🏄🏼♂️
Your comments and support are appreciated! 👊🏼

BITCOIN // Start of the weekly correction?After a nice expansion, Bitcoin has reached the weekly target fibo 300 and the monthly 200.
From this level, the chance of a deep correction is significant.
If the weekly candle closes like this, below the weekly impulse base, the market breaks the weekly structure and enters the correction space of the last weekly impulse.
There may be a correction of the corrective impulse, but chances are high that it will turn below the peak and go south.
There is a clean (not yet tested) H4 breakdown that triggers the longs. Below that, I'll be looking for short trades.
I don't know anything about the fundamentals, though, can anyone enlighten me in the comments?
———
We may not know what will happen, but we can prepare ourselves to respond effectively to whatever unfolds.
Stay grounded, stay present. 🏄🏼♂️
Your comments and support are appreciated! 👊🏼

GOLD // trade the correctionThe correction is valid, and the daily is in sync with H4 in the short countertrend.
There is a clean (not yet tested) brekout on H4 that may stop the price from falling, but scale-in is possible when the valid H4 long countertrend breaks.
Target zone is the daily 138.2 and the correction fibo 38.2 levels.
———
We may not know what will happen, but we can prepare ourselves to respond effectively to whatever unfolds.
Stay grounded, stay present. 🏄🏼♂️
Your comments and support are appreciated! 👊🏼

DAX // Possible start of the CountertrendThe daily trend still holds at all-time highs and beyond every measurable target, but H4 has already turned south.
The last clear breakout is on H1 at the countertrend line break, and the market crossed it by a couple of pips.
Not significant, but still a close below the trigger level.
The position should be closely watched at the daily impulse base.
Either to close the trade, or to add to it.
———
We may not know what will happen, but we can prepare ourselves to respond effectively to whatever unfolds.
Stay grounded, stay present. 🏄🏼♂️
Your comments and support are appreciated! 👊🏼

SOLANA // idea for both directionsThe daily short countertrend is valid, and the market has reached the correction fibo 50 level.
The question is: will it reach 61.8?
If the market can significantly break the last clear H4 breakout significantly, it may have a chance.
If it turns up, and there is a significant (trigger) candle in the long trigger zone, my target is the weekly target fibo 200.
———
We may not know what will happen, but we can prepare ourselves to respond effectively to whatever unfolds.
Stay grounded, stay present. 🏄🏼♂️
Your comments and support are appreciated! 👊🏼

DAX // What needs to happen before the deep correction?The market has almost reached the daily target fibo 238.2 after an unbelievable run!
But every impulse has a correction, so mabe it's time to be prepared.
The H4 structure already broke, but there is no new wave, and there is a clear H1 breakout that may push the balance for the sellers.
Smart money (my tick-by-tick volume analysis indicator) is selling for more than a week.
The daily impulse base is very close, and may trigger sell orders.
If there will be a huge fight, we may also see a sideways market for some time.
———
We may not know what will happen, but we can prepare ourselves to respond effectively to whatever unfolds.
Stay grounded, stay present. 🏄🏼♂️
Your comments and support are appreciated! 👊🏼

Spotting Trends & Unlocking Opportunities in CountertrendDear Traders,
Sometimes my ideas' wording may be weird for you.
This is because I use a quite unique method to find opportunities on the market.
It is not just unique, but quite simple as well.
Best,
Zen
———
Stay Patient, Stay Disciplined! 🏄🏼♂️
Your comments, questions, and support are greatly appreciated! 👊🏼

ASX 200 futures could tease bears at these highsThe ASX 200 futures market has struggled to retest 8500, after a brief and uninspiring spell above it. Overnight gains on Tuesday were seen on low volumes, and Wall Street indices have provided a weak lead today. A bearish divergence has also formed on the daily and 1-hour chart.
While prices have rebounded from the weekly pivot point, price action looks corrective. Hence the bias for it being a corrective channel that could break to the downside.
If we see prices rise at the open, I am on guard for it being a 'last hurrah", which could make it a suitable market to fade into with a stop above the record high. The weekly pivot (8390), weekly VPOC (8348) and weekly S1 around 8300 make viable downside targets for bears.
MS

GBP/USD Longs from this weekly demand This week, my analysis suggests that GU is likely to experience a bullish reaction from its current position. Price is sitting within a key weekly demand zone and has already surpassed the 50% retracement mark, signaling a potential area for long opportunities.
At the current level, there is a 1-hour demand zone nearby, with another demand zone just below it. I plan to watch for price accumulation in these areas, particularly to take out the weekly low. Once that occurs, I’ll look for my lower time frame confirmation to enter long positions. My primary target will be the Asian session high near the supply zone above.
Confluences for GBP/USD Longs:
- Liquidity Targets: Significant liquidity rests above, including the Asian session high.
- Supply Zone Mitigation: A strong supply zone above has yet to be mitigated.
- Retracement Setup: The bearish trend suggests the need for a retracement upward.
- Imbalances Above: Price has left clear imbalances that need to be filled.
- Weekly Demand Zone: Price is currently reacting within a high-probability weekly demand area.
P.S.: If price opens the week with bullish momentum but doesn’t provide a clear entry setup, I’ll shift my focus to the mitigation of the supply zone above. This would present potential sell opportunities to continue the broader bearish trend.

Market Scenario and Potential Buying OpportunitiesAnalysis of Key Support Levels and Candlestick Pattern Confirmation
The financial markets are often characterised by their volatility and the constant ebb and flow of prices. In this intricate dance, key support levels play a pivotal role in determining the direction of market movements. This aims to provide an in-depth analysis of the current market scenario, focusing on two significant support levels, $2,378.36 and $2,327.67, and the potential buying opportunities that arise should the market break and close below these levels. Additionally, the importance of candlestick pattern confirmation at the $2,035.97 level for a Bullish Deep Crab Pattern setup will be emphasised.
Understanding Support Levels
Support levels are price points on a chart where a security tends to find buying interest as it falls. These levels often act as a floor by preventing the price from being pushed downward. Identifying such levels is crucial for traders, as they help in making informed decisions about entry and exit points in the market.
In the current market scenario, the two significant support levels to watch are $2,378.36 and $2,327.67. These levels have historically shown strong buying interest and have acted as a base for price rebounds. However, should the market break and close below these critical levels, it signals a potential shift in market sentiment.
Significance of the $2,378.36 Support Level
The $2,378.36 level has been a key area of support in the recent trading history. A break below this level would suggest a weakening of the bullish sentiment, prompting traders to reassess their positions. It is essential to observe the market behaviour around this level closely.
Importance of the $2,327.67 Support Level
The $2,327.67 support level is another crucial price point. Historically, this level has provided a strong base for price recoveries.
A break below this level would likely indicate a further decline in market confidence, leading to increased selling pressure.
Waiting for Candlestick Pattern Confirmation
In the event that the market breaks and closes below the two significant support levels, attention should then be directed to the $2,035.97 level.
At this juncture, it is crucial to wait for a candlestick pattern confirmation.
Candlestick patterns are graphical representations of price movements for a given period.
They are widely used by traders to predict future price movements based on past patterns. In this scenario, a candlestick pattern confirmation is required to validate a potential buying opportunity.
Potential Buying Opportunities at $2,035.97
The $2,035.97 level is significant for the Bullish Deep Crab Pattern setup. This advanced harmonic pattern is known for its precision in predicting price reversals. The Bullish Deep Crab Pattern consists of four distinct price movements that create a specific geometric pattern, indicating a potential reversal point.
For a reliable trade entry, it is essential to wait for a candlestick pattern to confirm the validity of this setup. This confirmation ensures that the market is indeed reversing and increases the probability of a successful trade.
The Bullish Deep Crab Pattern
The Bullish Deep Crab Pattern is a harmonic pattern identified by its precise Fibonacci ratios. The structure of the pattern includes:
Confirmation Candlestick Patterns
Several candlestick patterns can serve as confirmation for the Bullish Deep Crab Pattern.
These patterns provide visual cues to traders, signalling a potential shift in market sentiment. Waiting for these confirmations ensures that traders enter the market with a higher degree of confidence.
Conclusion
In summary, the market's behaviour around the significant support levels of $2,378.36 and $2,327.67 is crucial for determining future price movements. Should the market break and close below these levels, the $2,035.97 level becomes the focal point for potential buying opportunities. However, waiting for a candlestick pattern confirmation is essential to validate the Bullish Deep Crab Pattern setup.
By adhering to these technical analysis principles, traders can make informed decisions, minimizing risk and maximizing potential returns. The importance of patience and confirmation cannot be overstated in achieving successful trading outcomes in a volatile market environment.
