[UPDATE] USDCAD Fibonacci levels [countertrend]Trend has reversed :
Current intraday trend likely DOWN
I will try to take LONG positions at these levels :
N1: 1.2585
N2: 1.2575
N3: 1.2555
Countertrend

USDCHF Fibonacci levels for intraday trading [countertrend]These are the Fibonacci retracement I am watching for USDCHF today :
N1: 0.8961
N2: 0.8969
N3: 0.8982
Current intraday trend likely UP
I will try to take SHORT positions on these levels.

USDCAD Fibonacci levels for intraday trading [countertrend]These are the Fibonacci retracement I am watching for USDCAD today :
N1: 1.2617
N2: 1.2636
N3: 1.2668
Current intraday trend likely UP
I will try to take SHORT positions on these levels.

EURUSD Bullish ForecastThis pair was analyzed with multi timeframe analysis and zooming out on EU, it looks quite bullish and I am forecasting further upside. Yes, I understand that we are at (and potentially rejected off) a critical resistance level but we are also in a corrective structure projecting a bigger move to the upside.
While looking at DXY, we have the exact opposite, where we have a Bearish Structure currently consolidating for further downside.
Some confluences to support this idea:
Inverted Head & Shoulders pattern formed
Counter-trend of Daily Bearish Structure with Break & Retest
Daily Bullish Wick that should normally be filled
Previous COT data shows an increase in longs. New data will need to be reviewed when released.
Potential formation of weekly ICI pattern
Potential formation of new Daily Bullish Structure
The first step in order to validate this idea, will require a clean break above the resistance zone around 1.22.
Let me know your thoughts.
Trade Safe!
HEET
ps. I generally post alot of updates as the idea/trade evolves. If you want to stay updated, please click the "Follow this idea" button.

USDCHF Fibonacci levels for intraday trading [countertrend]These are the Fibonacci retracement I am watching for $USDCHF today :
N1: 0.8986
N2: 0.9005
N3: 0.9031
Current intraday trend likely UP
I will try to take SHORT positions on these levels.

USDJPY Fibonacci levels for intraday trading [countertrend]These are the Fibonacci retracement I am watching for $USDJPY today :
N1: 105.76
N2: 105.98
N3: 106.28
Current intraday trend likely UP
I will try to take SHORT positions on these levels.

AUDUSD Fibonacci levels for intraday trading [countertrend]These are the Fibonacci retracement I am watching for $AUDUSD today :
N1: 0.7867
N2: 0.7841
N3: 0.7800
Current intraday trend likely DOWN
I will try to take LONG positions on these levels.

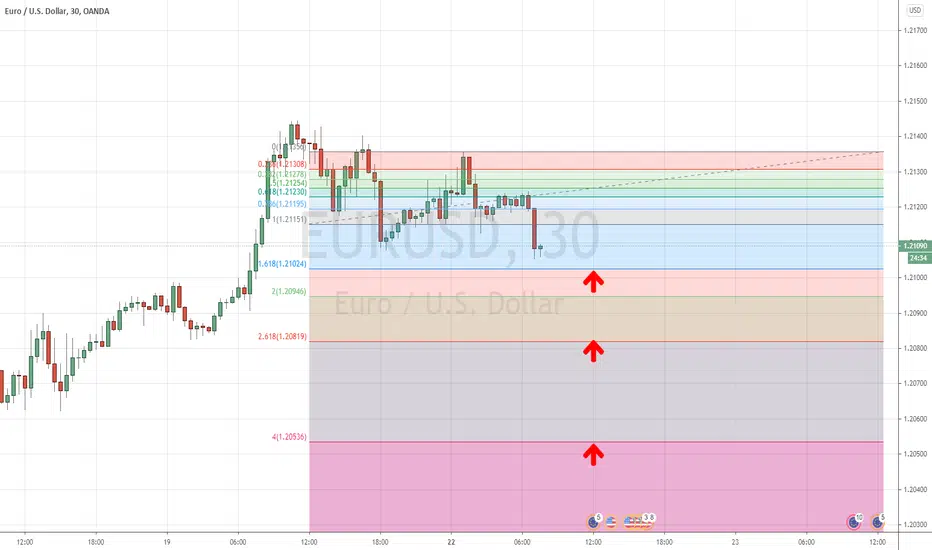
[UPDATE] EURUSD Fibonacci levels [countertrend]New intraday trend likely DOWN.
In this configuration, here are the new levels :
N1: 1.2102
N2: 1.2081
N3: 1.2053
I will try to take LONG positions.
EURUSD Fibonacci levels for intraday trading [countertrend]These are the Fibonacci retracement I am watching for $EURUSD today :
N1: 1.2125
N2: 1.2144
N3: 1.2161
Current intraday trend likely UP
I will try to take SHORT positions on these levels.

USDCAD Fibonacci levels for intraday trading [countertrend]These are the Fibonacci retracement I am watching for $USDCAD today :
N1: 0.7867
N2: 0.7841
N3: 0.7800
Current intraday trend likely UP
I will try to take SHORT positions on these levels.

USDCAD - Bullish CrabA V bottom on the bullish deep crab pattern is nice, but with the bearish engulfing candle, the movement towards profits isn't certain. A break and close below 1.2593 would create challenges for the short term appreciation.

USDCAD Fibonacci levels for intraday trading [countertrend]These are the Fibonacci intraday retracements I'm watching for USDCAD today :
N1: 1.2705
N2: 1.2717
N3: 1.2737
Intraday current trend likely UP.
So I will try to take SELL trades at these levels.
See arrows on the chart.

USDJPY Fibonacci levels for intraday trading [countertrend]These are the Fibonacci intraday retracements I'm watching for USDJPY today :
N1: 105.91
N2: 106.04
N3: 106.26
Intraday current trend likely UP.
So I will try to take SELL trades at these levels.
See arrows on the chart.

AUDUSD Fibonacci levels for intraday trading [countertrend]These are the Fibonacci intraday retracements I'm watching for AUDUSD today :
N1: 0.7750
N2: 0.7738
N3: 0.7717
Intraday current trend likely DOWN.
So I will try to take BUY trades at these levels.
See arrows on the chart.

USDJPY Fibonacci intraday retracements [COUNTERTREND]These are the levels I am watching for #USDJPY today :
N1: 105.846
N2: 105.60
N3: 105.27
Possible current intraday trend : DOWN
So i will try to open BUY positions at these levels.

USDCAD Fibonacci intraday retracements [COUNTERTREND]These are the levels I am watching for #USDCAD today :
N1: 1.2687
N2: 1.2668
N3: 1.2638
Possible current intraday trend : DOWN
So i will try to open BUY positions at these levels.

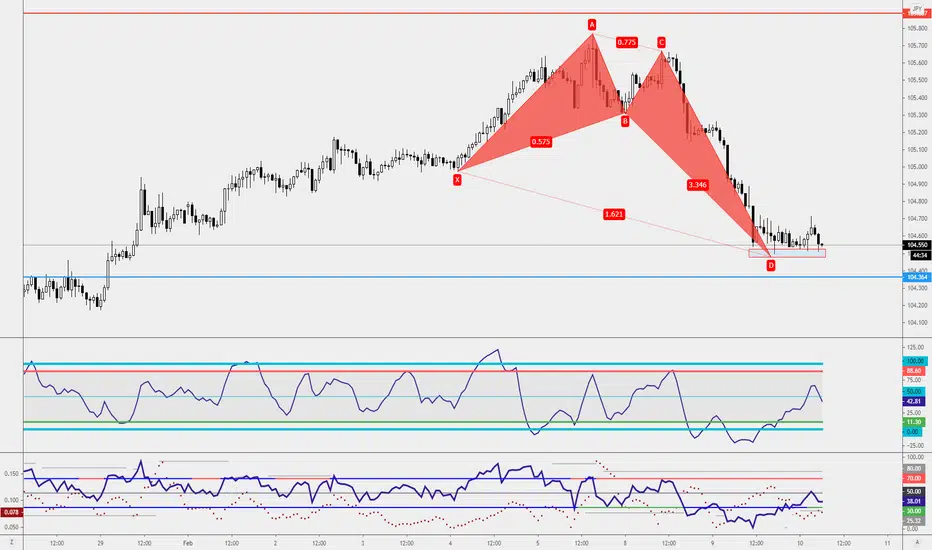
USDJPY - Support and ResistanceAs mentioned a few months back that USDJPY will hit a few bumpers along the way and 1 of it is at 106.01(chart at bottom)
I've engaged in an aggressive short and that is an attribute to candlestick formation, a doji on the resistance level way before the actual movement.
Once the price come in contact with the trendline, I will shift stops to entry and the candlestick close will be my main deciding point if I will intervene and exit the trade.

AUDUSD Fibonacci intraday retracements [COUNTERTREND]These are the levels I am watching for #AUDUSD today :
N1: 0.7759
N2: 0.7777
N3: 0.7806
Possible current intraday trend : UP
So i will try to open SELL positions at these levels.

EURUSD Fibonacci intraday retracements [COUNTERTREND]These are the levels I am watching for #EURUSD today :
N1: 1.2086
N2: 1.2071
N3: 1.2047
Possible current intraday trend : DOWN
So i will try to open BUY positions at these levels

USDCAD - Bullish BatA Bullish Bat Pattern setup with a warning sign, despite such, I'm going to place a pending buy limit at 1.2631(-41) for the immediate buying opportunity. Stop-Loss will place at 1.2590 and Target1 at 1.2706(+116), Target2 will be kept a secret.
This is our Chinese Lunar Near Year give away. Wishing all having a Huat Huat Year!
*Please do your own analysis and do not follow blindly.

ETHUSD - Key LevelEthereum is at the key level of resistance, would you like to engage in a shorting opportunity?
RSI is at Overbought position which gives a good consideration, the conservative trader can wait for a candle confirmation before engaging the trade.

GBPUSD-Weekly Market Analysis-Feb21,Wk3GBPUSD on all 3-timeframe shows a retest of the previous high and market is unable to break and close above it.
On the 1-hourly chart, I'm waiting for a retest of the previous high for me to short the market base on a double-top setup with RSI Divergence.

USDJPY - Bullish CrabThe crab pattern has not formed yet but a consolidation happens before it. If you don't mind to engage 2pips ahead of the completion, you can consider that. Stop-Loss I'm looking at 104.01.