Weak Bull Formation and Short-Term Buy/Sell OpportunitiesEURUSD presents a potential shorting opportunity with the Bearish Butterfly Pattern on the 4-hourly chart at 1.1045. This aligns with the backdrop of a weaker bull trading setup observed on its Weekly chart.
For those seeking a buying opportunity, consider monitoring the 1-hourly chart at 1.0993, where a potential support trading setup might offer an entry for bullish positions.
What's your analysis or stance on EURUSD? Share your thoughts below!
Countertrend

usdjpy sell analysisFX:USDJPY
Overall structure based on the daily and 4h is bearish. price broke countertrend structure on the 1h and made a retest to the new resistance area. Entry is based on the bearish engulfing candlestick the the 30 min timeframe

Bearish Bat Confirmed, Shorting Opportunites AheadHave you observed the eclipse on the weekly chart of JPY pairs? It's a prevailing theme, reflecting a retest of structural support across all Yen pairs in my list.
This setup hints at a potential buying opportunity emerging in the upcoming week.
However, for those like me, eyeing the Bearish Fib-3 Bat Pattern on the weekly chart, there are two enticing opportunities on the 1-hourly chart.
Option 1 presents a Bearish Gartley Pattern at X, likely completing at 145.30.
Alternatively, Option 2 showcases a Bearish Fib-3 Bat Pattern, completing at 146.87.
Both scenarios necessitate a 3-bar reversal before considering trade engagement.
What's your strategy for USDJPY?
Share your thoughts or trade plans in the comments below!
Let's explore the potential moves in this market together. 💬📈

Balancing Bullish Signals And Counter-Trend StrategiesGBPUSD showcases a Bearish Bat pattern on the daily chart, signaling a potential shorting opportunity with a likely retest around 1.2691.
Another approach would be to watch for resistance retesting, aiming for a double top with RSI divergence at 1.2606 on the 1-hourly chart.
However, if you're leaning towards a buying opportunity, considering the Weaker Bull trading setup on the weekly chart, the 1-hourly chart reveals a Bullish Butterfly Pattern.
Keep an eye out for a retest around 1.2522 as a potential entry point for a buying opportunity! 🦋💱🐂
What's your game plan for GBPUSD? Share your thoughts or trade strategies in the comments below!
Let's discuss and analyze potential moves in this market. 💬📊

Monitoring Key Level Post Bullish Shark Pattern ConfirmationCADJPY exhibits a confirmed Bullish Shark Pattern on the 1-hourly chart, prompting my engagement in the pattern. However, my attention is focused on the critical 108.55 level.
I'm closely monitoring the market's behaviour around this level. A preferred scenario would involve a break and close above 108.55, signifying potential bullish momentum.
What's your analysis or stance on CADJPY?
Share your thoughts below!

Balancing Bullish Signals And Counter-Trend StrategiesDespite GBPUSD showcasing a bullish trend, I'm eyeing a shorting opportunity on this pair. The daily chart signals the completion of a Bearish Bat Pattern, yet a direct engagement at this level poses considerable risk.
To mitigate this, my strategy involves patience, awaiting a market retest on the 1-hourly chart. Coincidentally, this timeframe also displays a Bearish Bat Pattern, offering a more favourable risk-reward ratio with reduced exposure.
Share your thoughts or strategies on GBPUSD below!

GBPJPY ANALYSISFX:GBPJPY
Overall structure based on the weekly, daily, 4h and 1h, hence i have a bullish bias on GBPJPY. Price was countertrending and eventually broke and closed above 187.275 1H key support area and also broke countertrend structure and made a retest what is now 187.275 1h key support area. a bullish engulfing candlestick on the 30min and also a double bottom pattern on the 15 min are my confirmations to continue bullish bias on GBPJPY

Leveraging Multi-Timeframe Bearish Shark PatternsI've identified an intriguing counter-trend setup on NZDJPY, which showcases alignment across the Weekly, 4-hourly, and 1-hourly charts, all converging around the same entry point featuring Bearish Shark Patterns.
A notable aspect is the different starting points of the Shark Patterns across these timeframes, culminating in an intriguing entry zone. This convergence offers an opportunity with potentially lower risk and higher return probabilities.
For a comprehensive view, check out the weekly chart within TradingView and explore related ideas.
What are your thoughts or trade plans on NZDJPY?
Feel free to share your insights or potential strategies below!

Potential Bearish Moves Amidst Bullish SignalsNZDJPY presents an intriguing trading setup despite being a counter-trend trade.
The observation of a Bearish Shark Pattern checkback on the Weekly Chart , along with RSI Divergence , adds weight to this potential trade opportunity.
I'm waiting for a shorting opportunity on lower timeframes and, specifically, looking for a 1-1 trading setup , intending to initiate a short position at 91.99 on the Daily Chart.
Trade plans can vary among traders based on their analysis and risk management approach.
What's your trade plan or strategy for NZDJPY?
Feel free to share your insights or plans below!

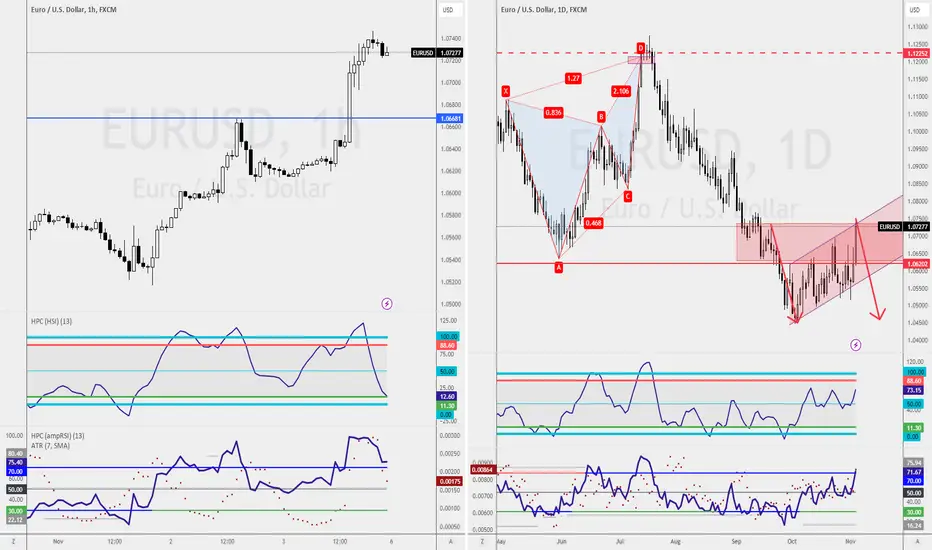
Navigating A Weaker Bull Trend For Strategic TradingIt appears EURUSD is currently within a Weaker Bull Trading setup.
For trend traders, waiting for a counter-trend opportunity might be a potential strategy.
Counter-Trend Traders, here are two considerations for your approach:
As the market resides in the supply zone on the Daily Chart, waiting for a double top formation coupled with RSI Divergence could offer an entry point for your trade.
Alternatively, keep an eye out for an ABCD Pattern as it unfolds, presenting another counter-trend trading setup.
These strategies aim to navigate against the prevailing trend, so it's essential to apply rigorous risk management practices.
Happy trading!

A Lucrative Trading Opportunity with Cautious ConfirmationA retest of the Bearish Gartley Pattern, especially on a Friday, presents an intriguing opportunity.
Waiting for candlestick confirmation before initiating a short on the Gartley pattern aligns with a counter-trend trade strategy.
This cautious approach can often mitigate risks associated with abrupt market movements.
Good luck with your trade and stay vigilant with risk management!

after all is said and done15min and 4h timeframes following an uptrade have a potential do actually not configure a bear div/break supports. in such case we should look for bear divs developed before such developments.

look for bear divs aftre 4h div validationafter 4h bear div likely retracement chances in lower timeframes

GBPCAD Counter Trendline BreakoutWe expect further upside on this pair, signalled by the breakout of the counter trendline. We can also see the breakout, close and retest of price above a key level further supporting our directional basis.

Navigating the Bearish Shark PatternGBPJPY currently positions itself at the Bearish Shark Pattern. While the pattern is not yet confirmed, aggressive traders might be tempted to seize the opportunity early, either to ride the potential high or out of fear of missing the move.
It's important to note that a shark pattern could offer as many as three entry points.
I'm intrigued to know your trade plan for GBPJPY. How do you intend to approach this setup? Share your insights below!

Exclusive Insights Inside!Last week, I issued a warning: "it's not a good idea to short the USDJPY!" Despite months of anticipation, the bull run on USD is not yet complete. If you're still waiting for a shorting opportunity, keep an eye on the 4-hourly chart for the development of the bearish shark pattern—a potential entry point for this counter-trend trade.
Now, let's discuss trade plans and your thoughts on the USD trend. What's your approach to USDJPY, and where do you see the US Dollar heading? Share your insights below!

Dive into GBPUSD Trading InsightsGBPUSD currently exhibits a Weaker Bullish Trend on the weekly chart, introducing interesting dynamics.
On the 1-hourly chart, a bearish shark pattern emerges, presenting a counter-trend trading setup. Simultaneously, the 4-hourly chart showcases a bullish bat pattern within the buy zone.
My preference in this scenario is clear—I favor the bullish bat pattern on the 4-hourly chart.
Now, I'm curious about your preference. What's your take on these setups? Feel free to share your insights below!

Money Making Opportunities in EURUSDEURUSD is currently navigating a weaker bullish trend on the weekly chart, adding an interesting layer to the market dynamics.
On the daily chart, a bearish flag pattern setup unfolds, creating an intriguing scenario. Furthermore, the 1-hourly chart reveals a bullish bat pattern, while the 4-hourly chart showcases a bearish bat pattern.
In the week ahead, I'm poised to engage in whichever trading setup comes to fruition first.
Now, I'm keen to hear about your trade plan. Do you carry any trend biases, and if so, what factors influence them? Your insights matter—please share them below!

IoTeXUSDT - Trendline Breakout Idea ! Hey guys! It's been over 100 days that IoTeX has been in a downtrend. This could be yet the bottom to be confirmed. We need a good breakout of the trendline to the upside with nice strong volume otherwise this could go back into ranging more for a long time or even continue falling despite the bullish bounce off this key monthly level.
TRADING PLAN AS FOLLOWS:
First we need to see a solid trendline breakout.
First TP would be 0.020 a psychological level. However, it could get pierced through so we need to monitor price action once it gets there.
My desired level is the weekly mean reversion area where price has struggled in the past and it's also a key flip zone but in the weekly timeframe. This area has been a magnet for price so it could get there again. TP here would be around 0.02470 - 0.02680
If the trendline breakout fails, close position at breakeven IF price goes sideways and no direction whatsoever or it hits stop loss.
I suggest to SPOT rather than futures as this is a counter trend trade set up. Risk is higher unless you follow rules strictly per your plan.
Hope you find analysis useful!
Kina 🙏

Potential Bearish Setup on Weekly ChartThe Bearish Fib-3 Bat formation on the Weekly chart certainly catches the eye, particularly with the presence of a long-shadow candle.
However, it's important to acknowledge that the trading setup remains unconfirmed. Waiting for confirmation may entail missing out on potential profits, to the tune of 200 pips.
Here are some strategic considerations:
Option 1: Shorting Opportunity from Lower Timeframes
One approach is to anticipate a shorting opportunity on lower timeframes, thus potentially capitalizing on a downside move without waiting for full confirmation.
Option 2: Trading Within the Range (1-hourly Chart)
Both sellers and buyers find opportunities within the 2 zone. This entails engaging with the Resistance at 150.49 and the Support level at 149.00.
The pivotal question arises: What's your trade plan? Your insights matter. Please share your perspective below!

Potential Retracement Week AheadThe overall setup for EURUSD leans towards a Weaker Bullish stance. However, given the impact of Friday's NFP Candle, I anticipate a series of correction moves in the upcoming week. Therefore, I'll be ready to execute whichever trading strategy emerges.
Potential Strategies:
Daily Chart - Bearish Flag Pattern:
The Potential Bearish Flag Pattern is nearing the sell zone. You can opt to wait for candlestick confirmation, possibly during Tuesday or Wednesday's opening. Alternatively, consider heading to lower timeframes to await a double tops setup before entering a short position.
Support Retest - 1-hourly Chart:
Trend traders might want to keep an eye on the market's retest of the support level on the 1-hourly chart, signaling a potential buying opportunity.
Now, the crucial question: Which side of the chart aligns with your trading strategy? I'm eager to hear your perspective. Please share your insights below!
Navigating AUDJPY's Correction: What Lies Ahead?The AUDJPY currency pair has been in a bullish trend since late March, commencing at the level of 86.065. As of the current analysis, it seems that the pair is undergoing a corrective Wave 4, indicating a countertrend phase. This correction is composed of subwave A and subwave B within the larger context of Wave 4.
Presently, the pair appears to be in the process of forming Wave c of Wave 4, and my projection suggests that it is likely to decline in order to complete the Wave 4 correction. Two possible scenarios are: A pullback to 95.251 price zone and a trendline break at 94.321 to the downside. My anticipated price regions for the completion of this correction are identified at 92.038 and 90.46. Once this correction is completed, I expect the bullish trend to resume.
A breach of the price level at 96.969 to the upside would invalidate this wave count and the associated outlook.
Cheers!

Amazing Shorting OpportunitiesUpon careful examination of the chart, it's apparent that the majority of retail traders are poised for a buying opportunity, making any talk of shorting seem unconventional.
Yet, a different perspective emerges upon closer inspection.
Observations:
I've discerned indications that suggest a contrary approach may be prudent.
Trading Strategy:
I'm personally awaiting a shorting opportunity on the forthcoming completion of the Bearish Crab Pattern, projected at 1.3926. This stands in contrast to the previous crab pattern, offering a fresh tactical choice.
For those still inclined towards a buying stance, a retest of the trendline on the 1-hourly chart might present the awaited opportunity.
Now, the crux of the matter: What's your call? Your insights carry weight. Please share your perspective below!
