NZDUSD - ShortFX:NZDCHF One that has been on my radar for a while now, I will be waiting for a break of this counter trend-line before jumping in.
I think this could be a really nice swing, so one I will stay patient on!
Countertrend

GBPJPY - Support and ResistanceI've shorted GBPJPY and a support and resistance trade, it is a trend trading trade with a very tight stop.

NAS 100 TRADE UPDATE DESCENDING CHANNEL FORMING TARGETING 10,5159/26 XAU BROKE THE TRIANGLE TO THE DOWNSIDE AND CURRENTLY IS IN
THE BUY ZONE THERE WAS A RARE TWEEZER BOTTOM MADE ON FRIDAY
WHICH MEANS WE SHOULD SEE THE MARKET START TO PUSH BULLISH. WITH
THE USDX BEING OB WE SHOULD SEE PAIRS CORRELATED WITH THE JPY,
EUR, AUD & NZD SHOW SIGNS OF RETRACEMENT BEFORE STARTING TO
PUSH AGAIN BEARISH. IF THIS HAPPENS THE PAIR WILL COMPLETED THE
R5 MOVE TO THE DOWNSIDE.
POS 53%
ENTRY: WAIT UNTIL A COUNTER TREND LINE ON THE 2HR AND RETEST BELOW THE DESCENDING CHANNEL
WEEKLY: DOWN R5
DAILY: DOWN R2
ENTRY: CTL 2HR R2
POS: 71%

XAUUSD SELL UPDATE 400 PIPS LEFT OF 800 PIP SELLOFF 9/23 XAUUSD HAS STARTED TO BREAK BEARISH AFTER A LONG RUN UP TO 2072 AREA, THE WEEKLY & DAILY WILL BE CONSIDERED SHORT TERM BEARISH BASED BROKEN COUNTER TRENDLINES AND RETESTS THAT HAVE CONFIRMED THE DOWNSIDE MOVEMENT. ONE THE 2HR WE OUR STUDENTS TO A TRADE AFTER A BROKEN A TRIANGLE TO THE DOWNSIDE TARGETING THE 1830 AREA. IF YOU MISSED THIS ORGINIAL MOVE HERE IS AN UPDATED TO SO YOU CAN CATCH THE 400 PIPS LEFT OFF THE 800 PIPS SELL OFF.
IF YOU LIKE OUR ANALYSIS DROP A LIKE AND LEAVE A COMMENT ABOUT WHERE YOU THINK THE MARKET WILL EVENTUALLY GO

Week 39: Opportunistic Short on FCPOX 2020Week 39: 21 to 25 September 2020
FCPOX 2020 analysis
Despite the bullish momentum is very strong, personally we can short FCPOX2020 with a very good Risk Reward Ratio.
We only need to risk RM24 to get RM336, that is 14R.
Again, this is a risky move as we are trading against the trend, but, this is a worth trying.
Here is my personal trade:
Sell at market now RM3,111
Stop Loss at RM3,135
Take Profit 1 at RM3,000
Take Profit 2 at RM2,900
Risk Rewards Ratio = 14R
Disclaimer :
The analysis above for educational purposes only, I do not responsible for your losses. Please adjust your own lot-sizing according to your appetite.
If you are benefiting from my trade opinion, please buy me coffee .
As always, move your SL when you are in the profit zone.

NZDUSD - Bearish Bat checkbackThe bearish engulfing candle gives a strong indication of a bearish run on this trade. I'm waiting for a retest back to 0.6777 to engage the trade on the 1-hourly timeframe as a counter-trend trade.

Week 39: ZSX 2020 is into the Unknown Weekly analysis for ZSX2020
Week 39: 21 September to 25 September 2020
Currently the price is roaming in an unchartered territory, we have no reference on how far the price will go higher.
Instead of speculating on how high it will go, as a trader, we take decision on a signal that has a higher degree of certainty.
Therefore, we are setting a Sell Stop rather than hoping the price will go higher to unknown area.
This week, if the price hits our Sell Stop, it means the price will change it's direction.
My personal trade call:
Sell Stop: $1,034.5
Stop Loss: $1,048.5
Take Profit: $991.0
Risk Rewards Ratio: 3.48R
Disclaimer :
The analysis above for educational purposes only, I do not responsible for your losses. Please adjust your own lot-sizing according to your appetite.
If you are benefiting from my trade opinion, please buy me coffee .
As always, move your SL when you are in the profit zone.

EURUSD - Counter-TrendCounter-Trend Trading Opportunity on EURUSD Daily chart, so why do I short it? Well on the 1-hourly chart there is a candle confirmation and on the daily chart the uptrend movement kind of look weak to me. Looking at candle close this probably be it and I expect at least some form of retracement happening within the next few days.
Trade has already engaged as the AB=CD movement seems has completed and halted.

GBPJPY - Resistance and Supply ZoneLooking for shorting opportunity within the sell zone will be preferred. Engagement of this trade is based on the long term chart analysis, the daily timeframe.
Whether this trade will be an aggressive engagement depends on how this 1-hourly candle close.

NZDUSD - Bearish Deep CrabCompared to his siblings, NZDJPY, NZDUSD has a better setup. Both having bearish bat pattern o the daily chart, both having bearish engulfing with a pink arrow on the 1-hourly chart but only NZDUSD has a bearish deep crab setup. Pending Order place for his trade and let's see how this trade turns out.

USDJPY - Bullish Bat - Counter-TrendA counter-trend setup on the USDJPY trade, pending order, has been placed to capture the bullish bat trading opportunity.

NZDUSD - Bearish SharkA bearish shark trading opportunity has setup, I would need to have a bearish candle and a retracement before consider to engage this counter-trend trading opportunity.

USDJPY-Weekly Market Analysis-Sep20,Wk3Another trend reversal trading opportunity, waiting for a retest on the 5-0 pattern for a buying opportunity.

CADJPY - Bullish Crab checkbackWaiting for an indecision candle to engage the trade for a counter-trend trade on CADJPY. At the resistance level 76.60, traders have to observe if the market can break and close above the recent high before hitting the first target.

USDJPY-Weekly Market Analysis-Sep20,Wk4Last week video and the week before we did mention that we expect the market to retest at 104.30, right now we are waiting for that retest to relive itself and give us a trend reversal trading opportunity to engage the trade and exit the trade at 105.26.

EURUSD-Weekly Market Analysis-Sep20,Wk4Overall trend on EURUSD is bullish but on the lower timeframe, the 1-hourly chart I'm waiting for a break and close below 1.1825 then a pullback to 1.1841 for a shorting opportunity towards the buy zone.

GBPAUD - ShortPrice is coming towards a key descending trendline and Fibonacci levels. I would like to see further development going into tomorrow, a potential break and retest of the counter trendline, looking for a sell setup down to 1.7300

EURUSD-Weekly Market Analysis-Sep20,Wk3This week I'm looking for a trend reversal/ counter-trend trading opportunity on the EURUSD. In short, I'm looking for a selling opportunity. Even when there is a potential Bullish Gartley in play, I'm looking for the shorting opportunity after it has hit its target area(red box).

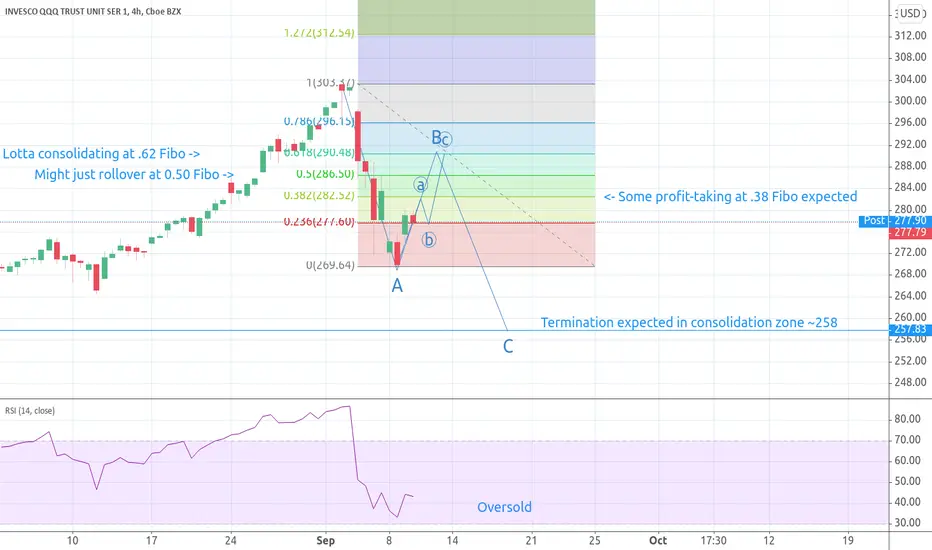
QQQ Correction A wave completedAnnotations in chart. Currently starting B wave countertrend move. How high it gets depends on greed, hope and fear.
This could rollover ANY DAY without completing a very high retracement; not a buy entry IMO!
Not investing advice; trade at your own risk!
USDJPY-Weekly Market Analysis-Sep20,Wk2This trendline will be the deal-breaker if the market didn't break and close below the trendline, I will be waiting for a buying opportunity as a counter-trend or even a trend reversal trade. However, if the market break and close at 106.04 or lower, I will be waiting for a retracement back to 106.34 to look for a shorting opportunity for this trend trading opportunity.

GBPUSD-Weekly Market Analysis-Sep20,Wk2I'm waiting for a shorting opportunity on GBPUSD, if the market didn't break and close above the red box I will be looking for a shorting opportunity.

EURUSD-Weekly Market Analysis-Sep20,Wk2You see there are 3 scenarios on EURUSD and all 3 I am waiting for shorting opportunity. That's because EURUSD on the daily chart there is an RSI Divergence. If the market can't break and close above the black box, I'll head in for a shorting opportunity base on the bearish flag pattern. If the market head up straight to the red box then I will be looking to sell within the preferred shorting zone(red box). Even if the market break and close above the red box, I'll be waiting at the bearish shark shorting opportunity.

AUDCAD - Bearish SharkTo dive in straight for a shorting opportunity isn't a sane action to do. A bearish candle confirmation is required before we could head in for a shorting opportunity.
There is another entry opportunity on a higher level for this Shark Pattern trading opportunity, so sit back, relax and wait for confirmation before engaging the trade.
