Inflation vs. Growth : Is the Fed Behind or Ahead of the Curve?CME_MINI:NQ1! CME_MINI:ES1! CME_MINI:MNQ1! CME_MINI:MES1! CBOT:ZN1!
Fed Policy recap:
There is an interesting and unusual theme to keep an eye on this week. The Fed is in a ‘blackout period’ until the FOMC meeting- this is a customary quiet period ahead of an FOMC policy meeting. Fed Chair Powell is scheduled to give a public talk on Tuesday. Although his address will be focused on the capital framework of the large banks, this appearance will be closely watched for any subtle signals on the FOMC policy stance.
Especially given that last week, Federal Reserve Governor Chris Waller made a speech, “The Case for Cutting Now” with a purpose as he stated to explain why the FOMC should reduce rate by 25 bps at the July 30th, 2025 meeting.
His stated reasons were:
1. Tariffs create one-off price level increases with transitory inflation effects, not sustained inflation momentum.
2. He argued that much of economic data points towards interest rates should be lowered to FOMC’s participants' median neutral rate, i.e, 3%.
3. His third stated reason notes that while the state of the labor market looks resilient on the surface, accounting for expected data revisions, private-sector payroll growth has peaked, with more data suggesting increased downside risks.
His speech further explains:
• Growth has decelerated sharply: Real GDP rose only ~1% annualized in 1H25, a significant slowdown from 2.8% in 2H24, and well below long-run potential.
• Consumer spending is weakening, with real PCE growth falling to ~1%, and June retail sales showing soft underlying momentum.
• Broader labor market indicators, including the Beige Book and JOLTS data, show declining labor demand and hiring caution, suggesting increasing downside risks to employment.
• Inflation is slightly above target (PCE ~2.5%) but driven primarily by temporary, one-off tariff effects. Core inflation ex-tariffs is likely near 2%, and expectations remain anchored.
• Current fed funds range (4.25%–4.50%) is well above neutral (3%), implying excessive restraint.
• With inflation risks subdued and macro conditions deteriorating, a preemptive rate cut now provides optionality and avoids falling behind the curve if the slowdown deepens. Further cuts may be warranted if trends persist.
• The tax bill contains pro-growth provisions, but its economic impact is expected to be minimal in 2025.
Source: Federal Reserve Speech, The Case for Cutting Now Governor Waller
Inflation Analysis:
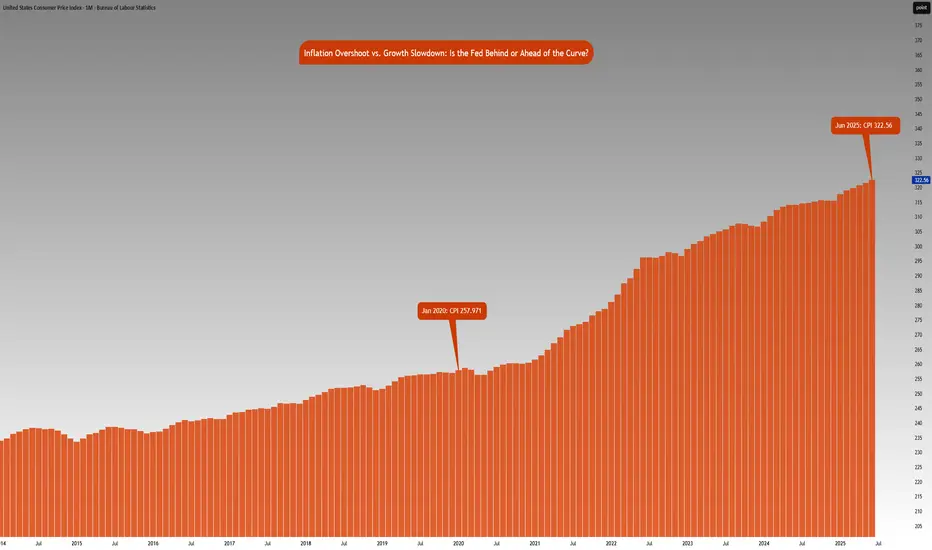
Let’s compare this with what we have previously mentioned regarding inflation. CPI index stood at 257.971 points in January 2020. Projecting this at a 2% Fed target, June 2025 inflation should be around 287.655 points. However, June 2025 inflation is currently at 322.56 index points, 12.2% higher above 2% the inflation trend. Effectively, this means annualized inflation since January 2020 is roughly 4.15%.
The Fed is in a real dilemma whether cutting rates given the inflation trend in the last 5 years and risks to inflation outlook justify cutting rates.
Key Questions to ask
Markets are forward looking. Investors and participants want to know:
• How will the rates impact the cost of debt service? Currently the third largest government expenditure, over $1.03 trillion.
• Will the tariff rate offset the tax revenue losses by extending tax cuts?
• Is the fiscal path sustainable?
• What happens to the long end of the yield-curve?
• Will the Fed monetize the debt issuance imbalance?
• Is this simply Governor Waller positioning himself for the next appointment of Fed Chair when Fed Chair Powell’s term expires in May 2026?
It seems there is a huge conflict between longer term implications vs quick short term fixes that align with US administration objectives.
The Week ahead:
It is a relatively light economic calendar in the US. Flash PMI readings and housing data on the docket. The primary focus as it has been for most weeks since President Trump took office, will be on the developments in trade policy and any further comments on Fed and Chair Powell. The threat of renewed tariffs starting August 1st, is also key to monitor and whether these protectionist measures will force US’s trading partners to make further concessions to negotiate trade deals.
The earnings season is off to a good start with major US banks reporting higher EPS and revenue than expectations. This week investors will be looking at Q2 earnings reports from Alphabet, Meta, Microsoft from the Mag 7 and Tesla.
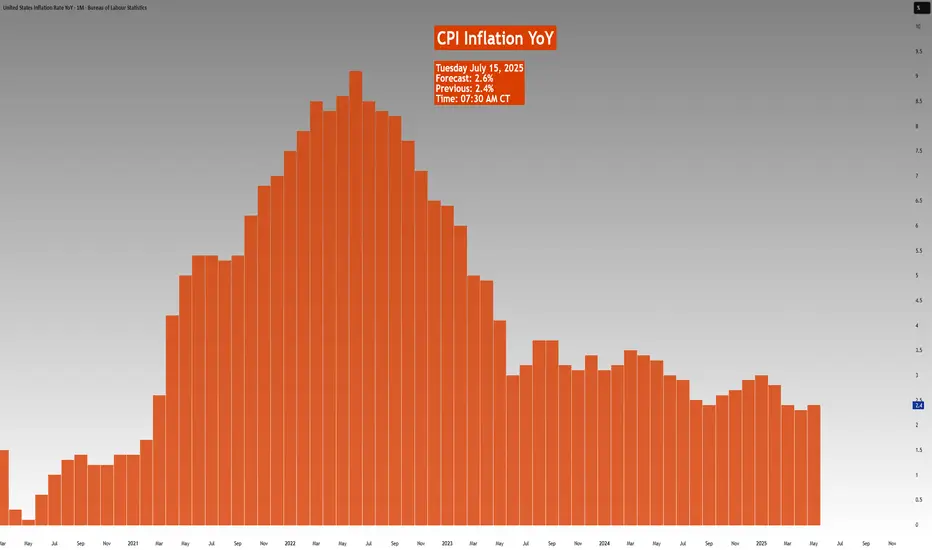
CPI
NZD/JPY: A Data-Driven Short SignalBefore I post a trade, I put it through a rigorous, multi-step analysis. Here’s exactly what I did for this NZD/JPY setup to build a data-driven case.
I Started with the 'Why': The Fundamental Story 📰
First, I identified the powerful divergence between the dovish RBNZ and the hawkish BoJ. This gave me my core bearish thesis for the pair.
I Challenged My Idea with Data: The Stress Test 🧠
A good story isn't enough. So, I ran this bearish idea through my mathematical models . My goal was to find any hidden risks and see if the hard data supported my fundamental view.
What My Analysis Revealed: A Warning and a Confirmation ⚠️
The data came back with two critical insights:
Confirmation: The models strongly validated the bearish direction with a high degree of mathematical probability.
Warning: They exposed a hidden danger—a standard entry had a very high probability of getting stopped out in the current market.
I Engineered the Solution: The Optimized Plan 🛠️
This is the most important step. I used these data insights to build a new trade plan from the ground up. The entry, stop loss, and take profit below are not guesses; they are the output of my analysis, specifically designed to navigate the risk the data uncovered.
The result is a trade with a huge 5.15-to-1 Risk-to-Reward ratio , where my fundamental view is now backed by a data-driven execution strategy. Let's get into it. 👇
The Complete Trade Plan
Strategy & Trade Parameters ✅
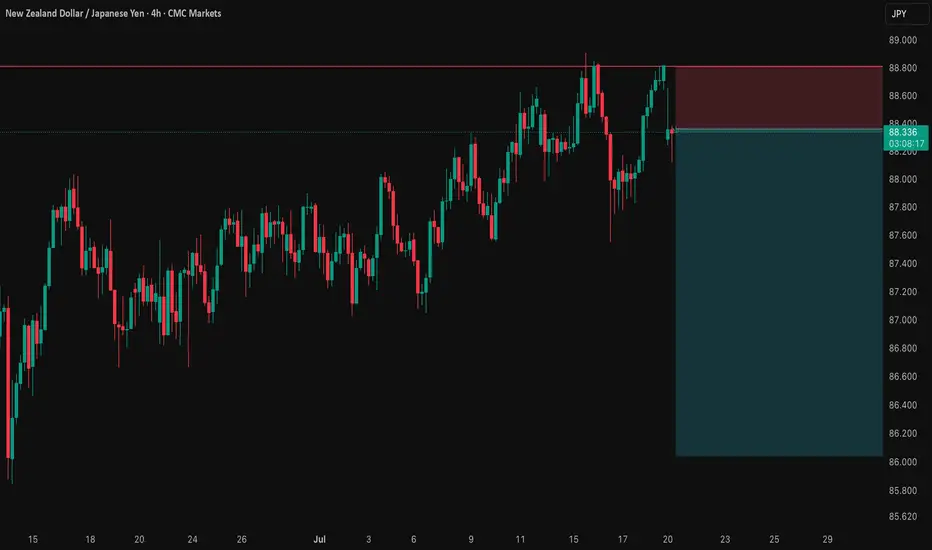
📉 Pair: NZD/JPY
👉 Direction: Short
⛔️ Entry: 88.35800
🎯 Take Profit: 86.04347
🛡️ Stop Loss: 88.80723
⚖️ Risk-Reward: 5.15
This setup represents my ideal trading approach: forming a strong fundamental thesis and then using disciplined, mathematical analysis to define the execution. The result is a plan where the direction is clear and the risk is precisely managed. Trade safe.
GOLD FULL UPDATE – July 15, 2025 | Post-CPI TrapPost-CPI Flip Zone Battle
Hello dear traders 💛
Today has been one of those heavy CPI days — full of volatility, sweeps, and doubt. But if we read it structurally and stop chasing candles, everything makes sense. Let’s break it all down step by step, clearly and human-like.
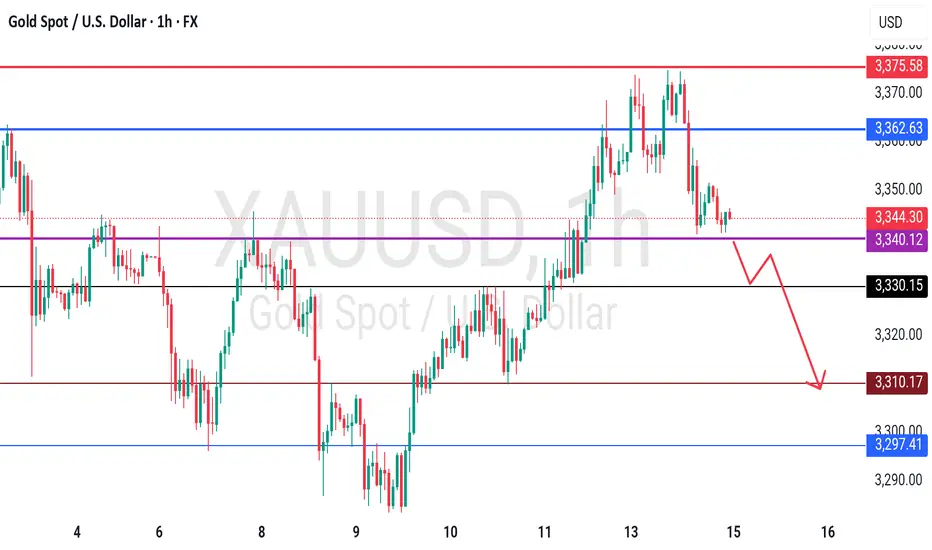
Current Price: 3330
Bias: Short-term bearish, reactive bounce underway
Focus Zone: 3319–3320 liquidity sweep + key decision structure unfolding
🔹 Macro Context:
CPI came in slightly hot year-over-year (2.7% vs 2.6%) while monthly stayed in-line at 0.3%. That gave the dollar a short-lived boost, and gold reacted exactly how institutions love to play it — sweeping liquidity under 3320, then pausing. Not falling, not flying. Just... thinking.
That reaction matters. Why? Because it shows us indecision. It tells us that gold isn’t ready to break down fully yet, and every aggressive move today was part of a calculated shakeout.
🔹 Daily Structure:
Gold is still stuck below the premium supply zone of 3356–3380. Every attempt to rally there for the past few weeks has failed — including today.
The discount demand area between 3280–3240 is still intact and untouched. So what does this mean?
We are in a macro-range, and price is simply rotating between key structural edges.
🔹 H4 View:
The rejection from CPI at 3355–3365 created a micro CHoCH, signaling the bullish leg is now broken.
After the 3345 fail, price dropped to 3320 — but it hasn’t tapped the full H4 demand at 3310–3300.
H4 EMAs are tilting down, showing pressure. This isn’t a breakout. It’s a correction inside a larger range.
🔸 Key H4 Supply Zones:
3345–3355: liquidity reaction during CPI
3365–3375: untested OB + remaining buy-side liquidity
🔸 Key H4 Demand Zones:
3310–3300: mitigation zone from the CHoCH
3282–3270: deep discount and bullish continuation zone if current fails
Structure-wise: We are in a correction, not a clean uptrend. That’s why every bullish attempt fails unless confirmed.
🔹 H1 Real Structure
This is where things got tricky today.
Price formed a bullish BOS back on July 14, when we first pushed into 3370. That was the start of the bullish leg.
But today, we revisited the origin of that BOS, right near 3320. This is a sensitive zone.
If it holds → it’s still a retracement.
If it breaks → we lose the bullish structure and shift full bearish.
So far, price touched 3320, bounced weakly, but has not printed a bullish BOS again.
🔸 H1 Zones of Interest:
Supply above:
3340–3345: micro reaction zone
3355–3365: CPI origin rejection
3370–3375: final inducement
Demand below:
3310–3300: current flip test
3282–3270: if this breaks, bias flips bearish
Right now, we are between zones. Price is undecided. RSI is oversold, yes — but that alone is never a reason to buy. We need structure. We need BOS.
🔻 So… What’s the Truth Right Now?
✅ If 3310–3300 holds and price builds BOS on M15 → a clean long opportunity develops
❌ If 3310 breaks, and we lose 3300, structure fully shifts and opens downside to 3280–3270
On the upside:
Only look for rejections from 3355–3365 and 3370–3375
Anything inside 3325–3340 is noise. No structure, no clean RR.
Final Thoughts:
Today’s move was not random. It was a classic CPI trap: induce longs early, trap shorts late, and leave everyone confused in the middle.
But we don’t trade confusion — we wait for structure to align with the zone.
If M15 or H1 prints a BOS from demand, that’s your green light.
If price collapses under 3300, flip your bias. The chart already told you it wants lower.
No predictions. Just real reaction.
—
📣 If you like clear and simple plans, please like, comment, and follow.
Stay focused. Structure always wins.
📢 Disclosure: This analysis was created using TradingView charts through my Trade Nation broker integration. As part of Trade Nation’s partner program, I may receive compensation for educational content shared using their tools.
— With clarity,
GoldFxMinds

GOLD - CUT n REVERSE area, what's next??#GOLD ... perfect move as per our video analysis and now market just reached at his today most expensive area, that is 3340-41
Keep close that area and only holding of that area can lead us towards further bounce otherwise not.
So keep in mind we should didn't holda our longs below 3340-41
And obviously we will go for cut n reverse below 3340-41 in confirmation.
Good luck
Trade wisely
GBP/USD still under pressure despite slightly weaker US core CPIThe US dollar, which had gained ground last week, was under a bit of pressure earlier today. And following a mixed inflation report, the greenback spiked before returning to pre-CPI levels. The inflation report hasn’t changed market’s perception about the likely path of interest rates.
US CPI comes in mixed
June’s CPI rose 0.3% MoM and 2.7% YoY—hotter than the prior 2.4% and above the 2.6% consensus. However, core CPI was a touch weaker, rising 0.2% m/m instead of 0.3%, while the y/y rate was 2.9% as expected.
The mixed CPI report means concerns that inflation may persist longer haven’t changed. The Fed may still delay or reduce the scope of any rate cuts, even if a September move is still on the table.
Adding to the dollar’s appeal, President Trump floated steep tariffs—35% on some Canadian goods and up to 30% on imports from Mexico and the EU—if deals aren’t reached by August 1. These protectionist signals and Trump’s expansive fiscal stance could further stoke inflation, supporting the greenback if confidence in US monetary policy holds.
Pound under pressure
Sterling has had a rough start to the week, extending last week’s 1% drop in GBP/USD before rebounding slightly earlier today. The pound's slide follows a run of soft UK economic data, boosting expectations for a Bank of England rate cut—likely in August. On Friday, data confirmed a second consecutive monthly contraction in the UK economy, driven by a worsening manufacturing slump. This has added to speculation that weakening growth and a stronger pound could help ease imported inflation, especially ahead of Wednesday’s UK CPI release.
Technical picture and key data ahead for GBP/USD
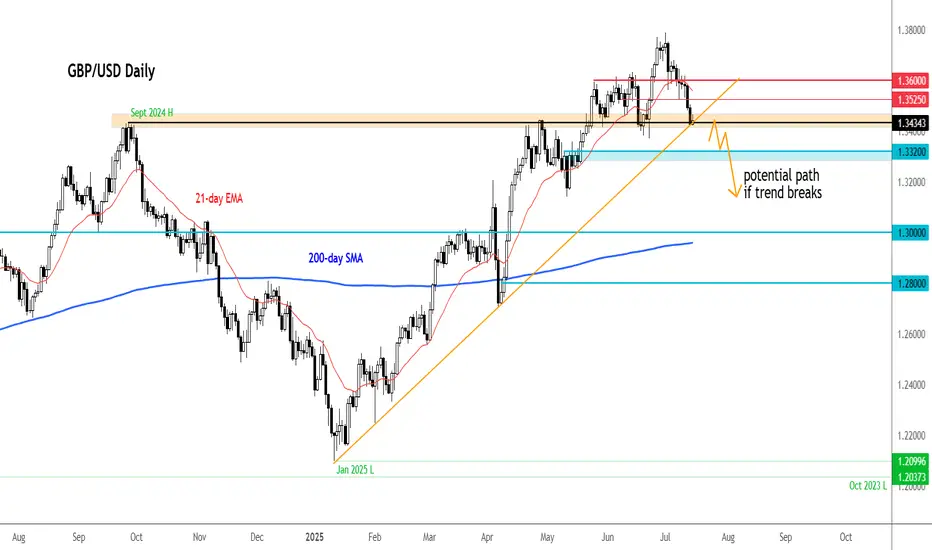
GBP/USD has broken below important support zones (1.3630 and 1.3530–1.3550), now turned resistance. It is currently testing the 1.3434 level, aligned with a key trendline. A breakdown here could open the door to deeper losses toward 1.3370 and potentially the low 1.30s.
Two major data points will guide the pair this week:
• UK CPI (July 16): A soft print would likely reinforce rate cut bets.
• US Retail Sales (July 17): After a May decline, a rebound could highlight US resilience and strengthen the dollar further.
By Fawad Razaqzada, market analyst with FOREX.com
Remains Below 1.3700 Ahead of CPI Data from the US and CADUSD/CAD Remains Below 1.3700 Ahead of CPI Data from the US and Canada
USD/CAD continues to decline ahead of inflation data from both the US and Canada.
The US inflation rate is expected to rise to 2.7% year-over-year in June, up from 2.4% recorded in May.
Meanwhile, Canada’s CPI is forecasted to increase by 1.9% year-over-year in June, up from 1.7% in May.
USD/CAD is trading around 1.3690 during the European session on Tuesday, following two days of gains. The pair is declining as the US dollar (USD) continues to weaken ahead of the June CPI data from the US. The inflation figures will provide new insights into the Federal Reserve's (Fed) monetary outlook.
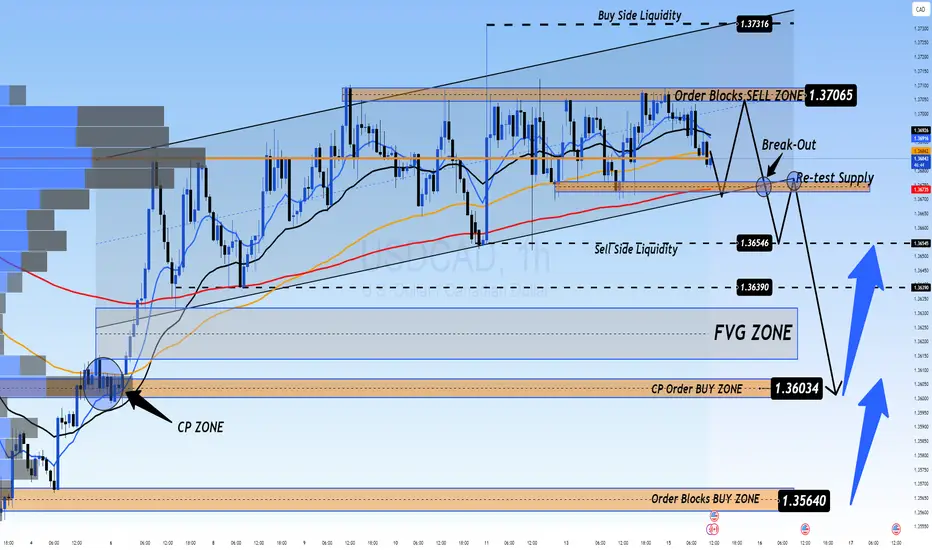
📉 Market Outlook for USD/CAD – Possible Drop on CPI Release
The USDCAD is still in a downtrend, and a sharp drop could occur with today’s CPI data release. Currently, there are two Buy Side Liquidity zones above and Sell Side Liquidity below, with the price balanced around the VPOC zone, which will soon decide the direction after the CPI announcement today.
Market liquidity still holds a FVG below, and with CPI data expected to favor USD, this could trigger a sharp drop towards this liquidity zone, possibly nearing CP OBS at 1.3600, followed by a potential rebound.
If price breaks CP zone, it may head toward a strong OB zone near 1.35xxx. Therefore, caution is advised when monitoring these OB zones.
🎯 Trading Strategy for Today
🟢 BUY ZONE: 1.36000
SL: 1.35500
TP: 1.36500 → 1.37000 → 1.37500 → ????
💬 What are your thoughts on USD/CAD ahead of the CPI data release? Do you expect a strong bounce or a continued decline? Share your views and join the conversation below!
👉 Follow for more updates and insights, and join the community to discuss real-time market moves!
Bitcoin Key 116800 Support Tested, US CPI as Decisive Catalyst__________________________________________________________________________________
Technical Overview – Summary Points
➤ Bullish momentum maintained across all major timeframes (1D to 1H). Key supports held at 116800-117200. Very high volume on low timeframes, indicating distribution/recharging. Risk On / Risk Off Indicator shows Buy across major TFs, micro-buy opportunity signaled on 15min. No extreme behavioral signals, except short-term positive micro-signal.
__________________________________________________________________________________
Strategic Summary
➤ Cautious bullish swing bias as long as 116800-117200 holds. Monitor strong tech sector momentum (Risk On / Risk Off Indicator). Heightened risk zone if support breaks (downward targets: 111000/110500/107200). Main catalyst: US CPI release—active trading management advised before/after. Tactical approach necessary: stop below 116200, TP 119000/120000. Closely watch low timeframe volumes and ISP signals.
__________________________________________________________________________________
Multi-Timeframe Analysis
➤
1D: Bullish, multiple supports at 10510/107200/11050-11190, resistance at 123000/119000-120000. Strong Risk On / Risk Off Indicator acquisition, normal volumes, no behavioral overheating.
12H: Momentum intact, 116800-117200 key area. Volume normal, stable mature market, no emotional excess.
6H: Bullish retest validated on 116800, rising volume but no dramatic spikes, key moment for trend.
4H: Dynamic support at 116800, resistance 119000-120000. Uptrend, healthy as long as support holds.
2H: Very high volume amid consolidation/reloading, increased volatility around 116800.
1H: Still Up, but extreme volume, increased caution. Possible stop hunting.
30min: Slowdown, volume still very high, micro-correction or local exhaustion.
15min: Micro-correction but ISP buy triggered; potential short-term bounce.
Key alignments: All TFs 1D–1H Up, supports held. 30min/15min correction on volume excess.
Major confluence: 116800-117200 = absolute pivot: break = correction, bounce = further up.
Divergences: Extreme volume not confirmed by ISP, except 15min.
Technical zone of action: Bullish scenario confirmed if bounce on 116800; invalidation on breakdown.
__________________________________________________________________________________
Macro & Fundamental Analysis
➤ No major macro event in the very near term
➤ Sole catalyst ahead: US CPI release, watch for possible whipsaws
➤ Institutional flows (ETF AUM record highs); on-chain stability, visible accumulation
➤ Volatility tightly compressed, coiling for next breakout on impulsive move
➤ Geopolitical noise present but limited direct impact in short term
To watch: post-CPI reactions, low timeframe volumes, defense/break of 116800-117200 cluster, micro ISP 15min signal, volatility & ETF institutional flows.
__________________________________________________________________________________
Summary & Action Plan
➤ Preferred scenario: Cautious swing long if 116800-117200 support cluster holds, stop <116200, TP 119000-120000+
➤ Invalidation: Prolonged breakdown of 116800: exit, wait for signal resynchronization.
➤ Catalysts: US CPI, watch for whipsaws (<1h pre/post-release).
➤ Risk management: Avoid adding if extreme volumes persist without ISP buy on short TFs (30m/1H), close monitoring ahead of data.
➤ On-chain context: Record volatility compression—major move likely soon; spot supply clustered—expect amplified reactions.
__________________________________________________________________________________

XAUUSD: Gold Moves Sideways, Awaiting Key Economic DataXAUUSD: Gold Moves Sideways, Awaiting Key Economic Data – Correction or Continued Uptrend?
🌍 Macro Overview – Waiting for CPI Data from the US
At the moment, Gold is trading in a wide sideways range between the 3x and 4x price levels, while traders are awaiting key economic data this week from USD, GBP, AUD, and EUR.
📊 Important Economic Data Today:
US CPI Report will be released during the US session today, making it one of the most important reports of the month.
CPI forecast is at 0.3%, which is considered positive for the US economy.
This report is expected to align with the recent Nonfarm data, and could lead to significant price movements upon release, potentially helping to adjust liquidity in the market.
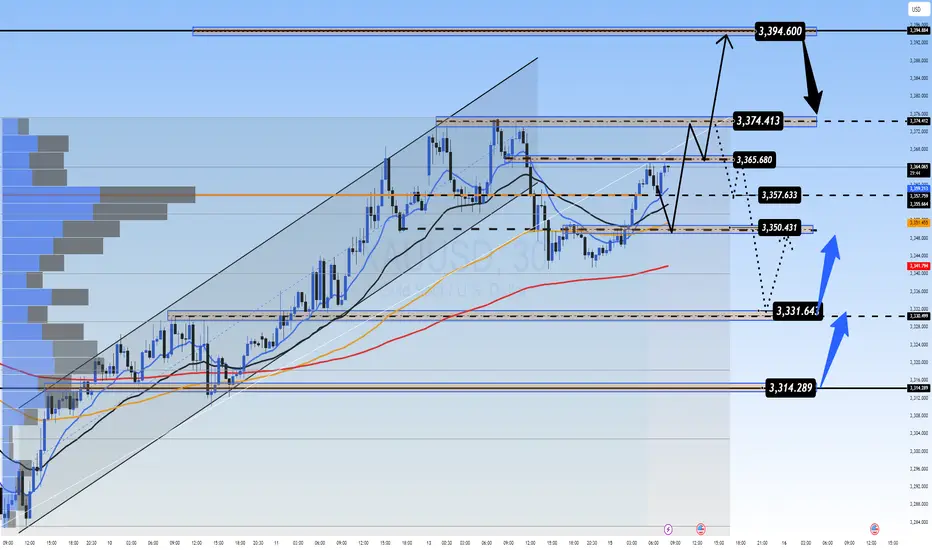
🔍 Technical Analysis – Current Trend with Key Resistance Levels
The current trend remains bullish, but the movement on higher timeframes isn’t as pronounced.
Key resistance levels are located around 337x to 339x, where selling pressure is currently strong.
If price breaks through these levels, Gold could find support and move towards 3400.
📈 Short-Term Forecast:
A pullback to around 333x is expected, offering a good buying opportunity.
Looking further, 331x is a potential target, as the price range remains quite wide.
🎯 Trading Strategy for Today
🟢 BUY ZONE:
Entry: 3331 – 3329
SL: 3325
TP: 3335 → 3340 → 3345 → 3350 → 3360 → 3370 → ????
🔴 SELL ZONE:
Entry: 3392 – 3394
SL: 3398
TP: 3388 → 3384 → 3380 → 3376 → 3370
⚠️ Important Notes:
Watch for support and resistance levels to set up scalping trades that align with the current market trend.
Always set SL and TP to protect your account and avoid FOMO when there’s no clear confirmation for entry.
The 3350-3347 range is a key zone to look for buy opportunities.
💬 What’s your take on Gold’s movement today? Do you think it will break the resistance or will we see further correction? Share your thoughts in the comments below and join the discussion with fellow traders!
👉 If you want more daily updates and to participate in live discussions, don’t forget to follow and join our community! Let’s take advantage of these market opportunities together.
Gold Outlook – Monday Session BreakdownOn the Monthly timeframe, gold has shown a triple wick rejection, which continues to signal potential downside movement. After several failed attempts to break above the $3,400 level, we’ve begun to see a retracement take shape.
On the Daily chart, a Head and Shoulders pattern appears to be forming — further reinforcing the bearish narrative.
During Monday’s session, price action retested the upward trendline from Friday, before sharply reversing down to the $3,353 zone, where it consolidated and formed a neckline. During the London session, gold once again tested the trendline, met sharp resistance, and formed a double top. The neckline and ascending channel were then broken at $3,353 during the New York session.
At present, gold is trading between the two key neckline levels: $3,353 and $3,330.
• A break and close above $3,353 could signal renewed bullish sentiment, with targets at the $3,378 trendline and potentially the $3,402 resistance.
• A break and close below $3,330 would point to continued bearish momentum, with a downside target at $3,312.
CPI data is scheduled for tomorrow, which may bring increased volatility and key level breaks.
Key Levels to Watch:
• Resistance: $3,402, $3,378, $3,353
• Support: $3,330, $3,312, $3,300, $3,283
Trade Zones:
• Buy entries: $3,330 – $3,328
• Sell entries: $3,353 – $3,355
Stay sharp this week, and remember to manage your risk wisely — 1–2% per trade.
Let the market come to you — patience pays.

Weekly Macro Brief: Chinese Economic Data, US Inflation, Tariff CME_MINI:ES1! CME_MINI:NQ1! COMEX:GC1! CME:BTC1! CME_MINI:RTY1! COMEX:SI1! CME_MINI:MNQ1! NYMEX:CL1! CME_MINI:M6E1! CBOT:ZN1! CME_MINI:MES1!
Highlights this week include Chinese economic data points, UK CPI, US CPI, PPI, and Retail Sales. Inflation data is key, as it comes ahead of the Fed's meeting on July 30th, 2025.
Market participants, including institutional investors and futures brokers like EdgeClear, will be scrutinizing these data points closely to monitor global growth and underlying inflation pressures.
Fed speakers are scheduled throughout the week. With increasing calls for Fed Chair Powell voluntary resignation and impeachment, the US administration desiring lower rates, the Fed’s independence and credibility to carry out its dual mandate is at risk. It will be interesting to monitor who folds first. Last week’s FOMC minutes revealed a divided Fed on the interest rate outlook, affirming its June dot plot.
On the fiscal policy front, we are already witnessing a shift in global trade policies, with many nations making concessions to negotiate trade deals with the world’s largest economy. In our analysis, the inflation impact of tariffs may not show up until Q4 2025 or early 2026, as tariff threats are mostly used as a lever to negotiate deals. While effective tariff rates have increased, as Trump reshapes how tariffs are viewed, cost pass-through to consumers will be limited in Q3 2025, as companies’ front-loaded inventory helps mitigate the risks of increased tariff exposure.
So, what we have is an interesting development shaping up where, while inflation may rise and remain sticky, it is yet to be seen whether slowing consumer spending will weaken enough to the point where companies have to start offering discounts, which would nullify the tariff risk to the end consumer and result in companies absorbing all tariffs. This scenario will see reduced earnings margins leading into the last quarter and early 2026. However, it will materially reduce risks of higher inflation.
In summary, the complex interplay between tariffs, inflation, and consumer behavior presents critical considerations for traders. EdgeClear, as a dedicated futures broker, remains focused on equipping clients with the insights needed to help navigate this evolving macroeconomic environment.
Overnight Data Recap:
• Chinese Trade Balance (CNY)(Jun) 826.0B (Prev. 743.6B)
• Chinese Trade Balance USD* (Jun) 114.77B vs. Exp. 109.0B (Prev. 103.22B)
• Chinese Imports YY* (Jun) 1.1% vs. Exp. 1.3% (Prev. -3.4%)
• Chinese Exports YY* (Jun) 5.8% vs. Exp. 5.0% (Prev. 4.8%)
Key Economic Releases:
• MON: EU 90-Day Retaliatory Pause Ends
• TUE: OPEC MOMR, Chinese House Prices (Jun), Retail Sales (Jun), GDP (Q2), EZ Industrial Production (May), German ZEW (Jun), US CPI (Jun), NY Fed Manufacturing (Jul), Canadian CPI (Jun)
• WED: UK CPI (Jun), EZ Trade (May), US PPI (Jun), Industrial Production (Jun)
• THU: Japanese Trade Balance (Jun), EZ Final HICP (Jun), US Export/Import Prices (Jun), Weekly Claims, Philadelphia Fed (Jul), Retail Sales (Jun)
• FRI: Japanese CPI (Jun), German Producer Prices (Jun), US Building Permits/Housing Starts (Jun), Uni. of Michigan Prelim. (Jul)
China GDP / Retail Sales/ Housing (TUE):
• Q2 GDP is expected to slow to 5.1% Y/Y (vs 5.4% in Q1) and 0.9% Q/Q.
• Retail sales have been resilient, but industrial production and investment show signs of weakness; deflation and labor market concerns persist.
• Property prices continue to decline, fueling stimulus speculation; policymakers remain cautious, with only modest easing expected (LPR and RRR cuts in Q4).
US CPI (TUE)
• June CPI expected at +0.3% M/M headline and core, suggesting a modest rebound from May’s subdued figures.
• Inflation impact from tariffs seen as temporary; Fed officials maintain a cautious stance with possible rate cuts only if price pressures stay benign.
• Markets are pricing near-zero odds for a July rate cut, but still expect two 25bps cuts by year-end in line with Fed guidance.
US Retail Sales (THU):
• Headline June retail sales expected flat M/M; ex-autos expected to rise +0.3%, showing signs of consumer stabilization.
• BofA data shows mild spending rebound, though discretionary service spending continues to weaken, especially among lower-income households.
• Spending strength remains concentrated in higher-income cohorts; weakness in wage growth limits broader consumption momentum.
US Trade Tensions – Tariffs & Negotiations:
• Trump announced 30% tariffs on EU and Mexican goods effective August 1st, separate from sector-specific tariffs.
• Trump stated the EU is engaging in talks and South Korea is also pursuing a trade deal.
Mexico Response:
• President Sheinbaum expects a deal before August 1st but reaffirmed Mexican sovereignty is non-negotiable.
• Mexico’s Economy Ministry is negotiating to protect domestic firms and workers, aiming for an alternative resolution.
EU Response:
• European Commission President von der Leyen warned that 30% tariffs would disrupt key transatlantic supply chains.
• The EU will extend suspension of countermeasures until early August but is prepared to respond proportionally if needed.
• The EU prefers a negotiated solution and dropped plans for a digital tax, seen as a concession to US tech interests.
• Separately, the EU is drafting a broad corporate tax on firms with turnover above EUR 50 million to support its budget.
Gold Eyes CPI as Tariffs BiteGold (XAU/USD) continues to push higher, recently hitting $3,360. The latest catalyst: escalating trade tensions, as President Trump imposes a fresh round of 30% tariffs on EU and Mexican goods. This is boosting safe-haven demand and weighing on the dollar, albeit modestly. Still, with the Federal Reserve signalling a cautious stance on rate cuts, gold may need an additional spark to clear long-term resistance.
Chart Setup:
• Current Resistance: Gold is trading just below $3,365, a multi-session ceiling.
• Indicators: The RSI remains above 50, reflecting bullish momentum.
• Breakout Potential: A strong CPI print tomorrow could challenge this uptrend. But if CPI cools, gold could test the $3,400 psychological barrier.
• Pullback Risk: A drop below $3,350 (23.6% Fibonacci) could bring us back to the $3,340–$3,320 support zone.
Markets are on edge ahead of Tuesday's U.S. CPI report, which may significantly influence inflation expectations, Fed policy, and safe-haven demand.

NAS100 - Stock market awaits inflation!The index is located between EMA200 and EMA50 on the one-hour timeframe and is trading in its ascending channel. Maintaining the ascending channel and confirming it after breaking the downtrend line will lead to the continuation of the Nasdaq's upward path to higher targets (23000), but in case of no increase and channel failure, one can look for selling positions up to the target of 22500.
Last week, the U.S.dollar demonstrated strong performance against major global currencies, despite having experienced some weakness since April 2, when President Donald Trump announced retaliatory tariffs against key U.S. trading partners. However, these tariffs were ultimately postponed, and only a baseline 10% tariff was maintained.
The 90-day deadline for implementing these tariffs, originally set to expire on Wednesday, has now been extended to August 1. Nevertheless, Trump surprised the markets this week by announcing a 25% tariff on imports from Japan and South Korea, threatening a 50% tariff on Brazilian goods, and implementing lower tariffs for other partners. These developments triggered a shift of capital toward the U.S. dollar as a safe-haven asset, boosting its strength.
This marks a notable shift in how the dollar is reacting to tariff tensions. In April, fears of an economic slowdown weighed on the greenback, but now it is gaining traction as a refuge in times of uncertainty, particularly as inflation risks mount—contributing to choppy moves in U.S. equity markets.
As is customary, the earnings season will kick off with reports from major banks and financial institutions. On Tuesday, JPMorgan is set to release its financial results, opening the floodgates for a wave of earnings reports. The image referenced lists several other companies, many of which are market heavyweights.
Following a relatively quiet week due to Independence Day holidays and a lack of major economic data, markets are now gearing up for a steady stream of reports in the coming days. Tuesday will bring the Consumer Price Index (CPI) for June along with the Empire State manufacturing survey. On Wednesday, the spotlight will shift to the Producer Price Index (PPI) for the same month. Then, on Thursday, traders will focus on June’s retail sales report, the Philadelphia Fed’s manufacturing survey, and the weekly jobless claims figures.
The week will conclude with two additional reports on Friday: the June housing starts data and the preliminary reading of the University of Michigan’s Consumer Sentiment Index.
June’s CPI report is expected to reflect an uptick in inflation, potentially driven by Trump’s tariff policies. Some analysts believe the tariffs will have an “undeniable” impact on prices, though others remain uncertain.
Despite concerns from both experts and consumers that businesses might pass tariff costs on to buyers, inflation has so far remained relatively moderate this year. The effects of Trump’s aggressive tariff campaign on hard economic data have not yet been clearly reflected—but that may be about to change.
According to Bloomberg’s consensus forecasts, as cited by Wells Fargo Securities, the CPI is expected to show a 2.7% year-over-year increase in June—up from 2.4% the previous month. Meanwhile, core CPI, which excludes volatile food and energy prices, is projected to have risen 3% over the same period, compared to a prior gain of 2.8%.
If these numbers come in as expected, it could support the forecasts of analysts who have warned that the costs of Trump’s heavy import tariffs would eventually show up on price tags, as manufacturers, importers, and retailers pass along the burden through the supply chain. Since taking office, Trump has imposed a wide array of tariffs, including a 10% levy on most imports, a 25% duty on foreign automobiles, and tariffs exceeding 50% on Chinese products.

USD/JPY: A High-Clarity Setup in a Coiling MarketFor weeks, the market has been choppy and difficult, grinding accounts down with indecisive price action. Many traders are getting stomped by the noise. This post is designed to cut through that chaos with a single, high-clarity trade idea based on a powerful fundamental story and a clean technical picture.
The focus is on the USD/JPY, where a major catalyst (US CPI) is about to meet a tightly coiling chart pattern.
The Fundamental Why 📰
Our entire thesis is now supported by both qualitative and quantitative analysis. The core driver is the profound monetary policy divergence between the U.S. and Japan, which manifests as a powerful Interest Rate Differential.
The Core Driver: The Bank of Japan maintains its ultra-easy policy while the Fed is in a "hawkish hold," creating a significant interest rate gap of over 400 basis points that fuels the carry trade.
Quantitative Validation: Our new analysis confirms this is the primary driver. We found a strong positive correlation of 0.54 between the USD/JPY exchange rate and this Interest Rate Differential. This provides a robust, data-backed reason for our long bias.
This creates a fundamental chasm between the two currencies, representing a compelling long-term tailwind for USD/JPY.
The Technical Picture 📊
The 4-hour chart perfectly visualizes the market's current state.
The Coiled Spring: Price is consolidating in a tight symmetrical triangle. This represents a balance between buyers and sellers and a build-up of energy. A breakout is imminent.
The Demand Zone: Our entry is not random. We are targeting a dip into the key demand zone between 144.50 - 144.80. This area is significant because it aligns with the 50-day moving average, a level that offers a more favorable risk/reward ratio.
The Underlying Conflict: It's important to note the long-term bearish "Death Cross" on the daily chart (50 MA below 200 MA). Our thesis is that the immense fundamental pressure—now validated by our quantitative study—will be strong enough to overwhelm this lagging technical signal.
The Plan & Setup 🎯
This is a conditional setup, and our analysis confirms the proposed levels are well-reasoned. We are waiting for the market to confirm our thesis before entering.
The Setup: 📉 Long (Buy) USD/JPY. We are looking for price to dip into our demand zone and then break out of the triangle to the upside.
Entry Zone: 👉 144.50 - 144.80. Watch for a 4H candle to show support in this area.
Stop Loss: ⛔️ 144.00. A break below this level would signal that the immediate bullish structure has failed and invalidates the trade thesis.
Take Profit: 🎯 149.50. This target is strategically set just below the major 150.00 psychological handle, a level where institutional orders are likely clustered.
This setup provides a clear, logical plan to engage with the market's next big move. It's all signal, no noise. Trade smart, and manage your risk.

China's PPI slides, Australian dollar steadyThe Australian dollar is almost unchanged on Wednesday. In the European session, AUD/USD is trading at 0.6532, up 0.03% on the day.
China's producer price index surprised on the downside in June, with a steep 3.6% y/y decline. TThe soft PPI report was driven by weak domestic demand and the continuing uncertainty over US tariffs. The lack of consumer demand was reflected in the weak CPI reading of 0.1% y /y, the first gain in four months. Monthly, CPI declined by 0.1%, following a 0.2% drop in May. There was a silver lining as core CPI rose 0.7% y/y, the fastest pace in 14 months.
The uncertainty over US President Trump's tariff policy continues to perplex the financial markets. Trump had promised a new round of tariffs against a host of countries on July 9 but he has delayed that deadline until August 1.
China, the world's second-largest economy after the US, has taken a hit from US tariffs, as China's exports to the US are down 9.7% this year, However, China has mitigated much of the damage as China's exports to the rest of the world are up 6%. There is a trade truce in effect between the two countries but the bruising trade war will continue to dampen US-China trade.
With no tier-1 events out of the US today, the FOMC minutes of the June meeting will be on center stage. The Fed held rates at that meeting and Fed Chair Powell, who has taken a lot of heat from Donald Trump to cut rates, defended his wait-and-see-attitude, citing the uncertainty that Trump's tariffs are having on US growth and inflation forecasts.his was below the May decline of 3.3% and the consensus of -3.2%. China has posted producer deflation for 33 successive months and the June figure marked the steepest slide since July 2023. Monthly, PPI declined by 0.4%, unchanged over the past three months.

German CPI flatlines, eurozone CPI nextThe euro is up for an eighth consecutive day and has gained 2.4% during that time. In the North American session, EUR/USD is trading at 1.1738, up 0.36% on the day.
German inflation data on Monday pointed to a weakening German economy. The CPI report indicated that the deflationary process slowly continues. The inflation rate for June came in at 0% m/m, down from 0.1% in May and below the consensus of 0.2%. Annually, inflation dropped to 2.0% from 2.1% and below the consensus of 2.1%. The eurozone releases its CPI report on Tuesday.
Inflation has been dropping in small increments and has now fallen to the European Central Bank's inflation target of 2%. The ECB cut the deposit rate to 2.0% earlier in June and meets next in July. Although eurozone inflation is largely contained, there are concerns about the impact that US tariffs and counter-tariffs by US trading partners could have on the inflation picture. The ECB is likely to maintain rates in July but could lower rates in September if disinflation continues.
The US continues to show signs that the economy is slowing down. Last week, GDP was revised downwards to -0.5% in the first quarter. This was followed by US consumer spending for May (PCE) which posted a 0.1% decline, following a 0.2% gain in April and shy of the consensus of 0.1%. This was the first contraction since January. If economic data continues to head lower, pressure will increase on the Federal Reserve to lower interest rates, which isn't expected before the September meeting.
EUR/USD is testing resistance at 1.1755. Above, there is resistance at 1.1791
1.1718 and 1.1682 are the next support levels

$GBINTR - Steady Rates by BoE (June/2025)ECONOMICS:GBINTR
June/2025
source: Bank of England
- The Bank of England voted 6-3 to keep the Bank Rate steady at 4.25% at its June meeting, amid ongoing global uncertainty and persistent inflation.
The central bank noted inflation is expected to remain at current rates for the rest of the year before easing back toward the target next year,
indicating that a gradual and cautious approach to further monetary policy easing remains appropriate.

AUDUSD Potential UpsidesHey Traders, in today's trading session we are monitoring AUDUSD for a buying opportunity around 0.64600 zone, AUDUSD is trading in an uptrend and currently is in a correction phase in which it is approaching the trend at 0.64600 support and resistance area.
Trade safe, Joe.

$USINTR -Fed Keeps Rates Uncut (June/2025)ECONOMICS:USINTR
June/2025
source: Federal Reserve
- The Federal Reserve left the federal funds rate unchanged at 4.25%–4.50% for a fourth consecutive meeting in June 2025, in line with expectations, as policymakers take a cautious stance to fully evaluate the economic impact of President Trump’s policies, particularly those related to tariffs, immigration, and taxation. However, officials are still pricing in two rate cuts this year.

EURUSD LONGPrice swept below support around 1.1473, grabbing liquidity and quickly bouncing back — this is a classic Wyckoff spring setup.
📌 Key Levels
Entry: Around 1.1500
Stop Loss: Below 1.1424 (spring low)
Target 1: 1.1567 (range high)
Target 2: 1.1614 (measured move)
🔍 Why I like this setup:
Fake breakdown (spring) and quick recovery
Buyers showed up right after the sweep
Expecting price to return to the top of the range and possibly break higher . This a trade we hold
💡 A spring is where smart money steps in after trapping sellers — I'm following them.
“I always say that you could publish my rules in the newspaper and no one would follow them. The key is consistency and discipline.”

Massive GBP/USD Reversal Ahead? Head & Shoulders FormationGBP/USD is at a critical technical juncture following a sharp bullish impulse that pushed the pair above the 1.34 handle, printing a strong weekly bullish engulfing candle and breaking out of a multi-week consolidation zone. This move unfolded in a macro context where the U.S. Dollar Index (DXY) is showing clear signs of weakness, with Non-Commercial net long positions dropping drastically—from around 20,000 to less than 5,000 contracts. This shift points to a fading speculative appetite for the dollar, historically a leading indicator of upcoming corrective phases or broader declines in the DXY.
On the flip side, the Commitments of Traders (COT) report on the British Pound reveals that Non-Commercials (typically hedge funds and asset managers) remain net long on GBP, with a slight increase week-over-week. However, Commercials (generally institutions and hedgers) have aggressively built up a significant net short position—levels that in the past preceded major reversals on the pair. This divergence between speculators and institutional hedgers suggests short-term bullish potential, but with rising risk of exhaustion near current resistance levels.
Adding fuel to this outlook is the retail sentiment: approximately 63% of retail traders are currently short GBP/USD, with an average entry price around 1.3021. This kind of retail crowd positioning, typically inefficient from a historical perspective, adds contrarian support for further upside, as long as price holds above the 1.3340 structure.
From a seasonality perspective, June tends to be a mildly bullish-to-sideways month for GBP/USD, especially when looking at the 10- and 15-year seasonal averages. While the seasonal bias is not particularly strong, there’s also no statistical downward pressure this time of year, leaving room for technically-driven moves influenced by liquidity and sentiment rather than macro patterns alone.
On the technical front, the daily chart shows a steep rally capped by a large green candle on Monday, breaking cleanly through the 1.34 resistance zone. The price is now hovering inside a key supply area between 1.3499 and 1.3550—a historically reactive zone that has triggered major rejections in previous months. How price reacts here will likely shape the next major swing. A confirmed breakout and consolidation above 1.3550 would open the door for an extension toward 1.37–1.3750. Conversely, a sharp rejection followed by a break below 1.3412—and especially under 1.3340—would set the stage for a deeper correction toward 1.3170.
The RSI is currently showing early signs of momentum loss, although no strong bearish divergence has emerged yet. This implies that the pair could still fuel another push higher before running out of steam—possibly forming the right shoulder of a head & shoulders pattern if the rejection scenario plays out.

US Unemployment Rising: How Is This NOT a Recession?The U.S. unemployment numbers are steadily climbing, as indicated by recent Bureau of Labor Statistics data. Typically, significant rises in unemployment correlate directly with recessions, which are shaded gray in historical data charts.
Currently, unemployment has reached over 7 million, significantly higher than recent lows. Historically, every similar increase has coincided with or preceded an official recession declaration. Yet, mainstream economic narratives have avoided labeling this a recession.
What does this data tell us, and is the market accurately pricing in the risk? Are we already in a recession, or is this time different?
Share your thoughts below. Let's discuss the disconnect between the unemployment reality and official recession narratives.

Gold may rise due to CPI and falling dollarMay CPI in the US rose by 2.4% - just below the forecast of 2.5%. This reinforced expectations of a Fed rate cut despite continued pressure from tariffs. The dollar is weakening, gold may gain in this situation
Gold is forming an upward structure. The fundamental background is changing and moving to the side of gold. Before the rise there may be a liquidity grab from below
Price is in consolidation. If trading shifts to the upper half of the current range, then a breakout and continued growth can be considered in this case

EUR/USD tests three-year ceiling Aside from a brief spike in April, EUR/USD has remained below 1.1500 for over three years.
Sellers again have had to defend the zone following the weaker-than-expected US CPI release. The main resistance zone potentially spans all the way up to 1.1573 (the April high).
Some indicators suggest potential room for further upside. The Relative Strength Index (RSI) has not yet reached overbought territory, and the Daily Moving Average is positively sloped. A break below the 4-hour Moving Average could trigger more selling pressure and a potential correction.
