What Disinflation - Beef Price Went Up 64 percent in 5 YearsCME: Live Cattle ( CME:LE1! ), Lean Hog ( CME:HE1! )
Last month, the Bureau of Labor Statistics (BLS) reported that US inflation on food items was 5.7% in June, exactly half of its peak of 11.4% in August 2022. Food inflation is at its lowest level since November 2021.
Under the sub-category “Meats, poultry, fish, and eggs” from Food-at-home, the BLS data shows a negative 0.2%, meaning that meat prices declined in the past year.
The official data contradicts my own experience. Anyone who has been shopping knows that the grocery bill gets bigger every month. Last weekend, I surveyed the Beef section at a local Walmart and found the following:
• Beef cuts with the USDA Choice label price between $12-$18 per pound.
• A primal loin, for example, costs $16.99/lb.
Next to Beef is the Pork section.
• A full slack of spareribs prices at $1.89/lb.
• This is back to the pre-Covid price level.
Why is beef so pricy? Will consumers get some relief as food inflation goes down? In this report, I attempt to find out what drives the beef/cattle price up.
The Cash Cattle Market
According to the National Daily Cattle & Beef Summary published by the USDA, Choice Beef averaged $301.79/cwt (per 100 pounds) nationwide on August 4th. Primal loin cutouts averaged $4.11/lb. This is so much lower than the retail price. But why?
The USDA reports transactions occurred at meatpackers, where cattle farmers sell their beef cows. The report shows the value chain throughout the packing process:
• Live Cattle: Steer (male cow), 187.55/cwt; Heifer (young female), $187.26/cwt;
• Beef Carcass: $284.86 (Choice);
• Primal Flank: $214.84 (Choice);
• Primal Rib: $457.54 (Choice);
• It also lists prices for Chuck, Round, Brisket, Short Plate, Trimmings, etc.
From the packing plant, beef goes through cold storage, wholesale, and retail distribution before consumers pick up their favorite meat at the grocery store.
During the inflationary period, labor and energy become more costly, driving up the cost of each stage of processing and distribution. Higher interest rates also raise the cost of business overhead. These together widen the price spread between live cattle and retail beef cutout significantly.
In the beef cattle value chain, it takes farmers two years to raise the cows, while processing and distribution take maybe two weeks to complete. However, farmers receive only about 20% of the final sales price.
The Cattle Cycle and A Shrinking Herd
Cattle cycle is the process in which the size of the national cattle herd changes over time, from low point to low point. The cattle cycle averages 8–12 years and is influenced by the cattle prices, input costs that drive producer profitability, the gestation period, the time needed for raising calves to market weight, and climate conditions.
If cattle prices and producer profits are expected to rise, producers may expand their herds; if prices are expected to decline, producers will reduce their herds by culling older cows and keeping fewer heifers to replace older cows.
Cow-calf producers’ response to price fluctuations may be delayed because of the lengthy gestation period for cattle relative to hogs and poultry. The total number of beef cattle in the United States is highly dependent on the stage in the cattle cycle.
Last month, the USDA reported that the latest herd inventory for all cows and calves was 95.9 million, down 3% year-over-year. Beef cow inventory was 29.4 million, also down 3%. The decline in beef cow supply is the main driver for higher beef prices.
Over the past 50 years, the US cattle herd has shrunk significantly.
• Inventory for all cows and calves peaked at 132 million in 1975. We have lost over 36 million cows or 27% of all cattle supply.
• Beef cattle inventory peaked at 45.7 million. We now have 2/3 of peak herd size.
A counter argument is that, with technology advancements, we need fewer cows for the same amount of beef supply. The production time gets shorter, and the cows gets bigger. People now have healthier diets and take in less red meat.
According to USDA data, per capita beef consumption was 63.3 pounds in 1960. It declined to 59.1 pounds in 2021, down 6.6%. But look at the huge population growth for people. The US had 203.2 million people according to the 1970 Census. US population grew to 331.4 million in the 2020 Census, up 63%. Beef demand clearly outpaced supply as US population grows.
Beef Export and Import
Interestingly, the US both exports and imports beef. In 2021, the US exported 3.43 billion pounds of beef while imported 3.35 billion pounds. Beef export was mainly higher-grade beef cutouts. And import was lower-grade beef for processing into ground beef.
The US used to be a net import country for beef. In 2020, China signed a trade agreement with the US and opened its vast market for US beef import. This resulted in China buying four times as much beef the following year.
More export reduces domestic beef supply. This is another factor driving up beef prices.
In conclusion, the days of lower priced beef are long gone. Beef prices are expected to remain high, even though food inflation goes down.
Cattle and Hog Spread Trade – A Revisit
How could we make use of this analysis? On May 15th, I published an idea about a spread trade between CME Live Cattle Futures ( NASDAQ:LE ) and Lean Hog Futures ( NYSE:HE ).
The 20-year chart shows that the price spread between live cattle (LE) and lean hog (HE) broadly stays in the range of $20-$60 per 100 pounds but could go up to as high as $100.
On May 12th, October cattle contract (LEV3) was quoted $166.2 per 100 lbs., while October hog contract (HEV3) priced at $77.425. Thus, the price spread was $88.775.
On August 4th, LEV3 settled at $183.10 while HEV3 was closed at $83.25. The spread has widened to nearly $100.
The Impact of Proposition 12
In 2018, California passed an animal welfare law called Proposition 12. It requires that breeding pigs be confined to a pen with no less than 24 square feet of floor space, allowing them to fully turn around in their living area.
Proposition 12 applies to not only hog farmers in California, but also any supplier selling hog and pork in the state of California. The hog industry fought hard but lost. The Supreme Court upheld the law in May, and it is finally taking effect in July.
The animal welfare law significantly increases the cost of hog production nationwide. Prices of live hog, pork cutout, ham and bacon shall all go up. However, as we are now in summer, a low pork consumption season, cash market price has not yet caught up.
In my opinion, the cost factor pushing pork prices up in the short run is greater than the supply-demand force that drives up beef prices in the long run. There may be room to short the cattle-hog spread, until pork prices stabilize in a new equilibrium.
A Short Spread trade entails selling 1 CME Live Cattle Futures and buying 1 CME Lean Hog Futures. Both contracts are based on 40,000 pounds of meat and require $1,600 in initial margins.
Happy Trading.
Disclaimers
*Trade ideas cited above are for illustration only, as an integral part of a case study to demonstrate the fundamental concepts in risk management under the market scenarios being discussed. They shall not be construed as investment recommendations or advice. Nor are they used to promote any specific products, or services.
CME Real-time Market Data help identify trading set-ups and express my market views. If you have futures in your trading portfolio, you can check out on CME Group data plans available that suit your trading needs www.tradingview.com
CPI

NQ1! Supply and Demand Levels 8/6/23 (15MIN TF)Link to chart: www.tradingview.com
Looking at the higher timeframe, we hit a ceiling of multiple rejections to the upside. On the /ES, we tapped into the 2022 highest resistance and we were immediately shut out.
Coming into this week, we do have important news that can rampage the numbers and volatility.
I am not planning to trade much but I wanted to share the levels on my chart that I am watching. Based on the pattern formations we can have a double top on the daily or a double bottom on the 4HR, and with news it may push 1-3% change. Following the pivot points on the 4HR as well.
EOW Possibilities:
BULLS: 15735-15900
BEARS: 15020-15166

AUDUSD will buyer momentum continue?Today's focus: AUDUSD
Pattern – HL
Possible targets – 68.11 – 68.85
Support – 67.17
Resistance – 67.75
Could we see further upside from the AUDUSD? Currently price is bouncing off short-term support. This could continue if some of this week's key news goes in favour of risk markets. The USD has had a solid run recently but could any hints at future rant holds set off a new pullback? If so this could be fuel for the AUD to continue its push.
Australian CPI is also due out on Thursday, its forecast to come in slightly lower Could a miss also help drive buying?
For now, we will continue to watch price as it holds off short-term support with a new HL and see if it can continue to push higher reclaiming some of last week's lost ground.
Have a great day and good trading.

So… how’s that deflation narrative looking?We’ve become so accustomed to headlines of ‘peak inflation’ and falling input prices that some have been throwing the wonderful ‘deflation’ word around. And we think most would enjoy a bit of deflation, as that would result in lower interest rates. However, with commodity prices (particularly oil) being a key driver of inflation, a lot of the softness can be tied back to the underperformance of commodities over the past 12 months. Supply chain disruptions have also been in the rear-view mirror and no longer a concern (or are they?)
Over 30,000 UPS workers are vowing to strike if a new pay deal is not negotiated by 1 August, which should throw a nice spanner in the works of the US (and global) parcel delivery system. Russia has pulled out of a key grain deal and is bombing Ukraine ports to derail trade in the Black Sea. And India has banned rice exports (apart from Basmati) to fight domestic inflation, adding to fears of another round of food inflation.
It is therefore worth noting that the Thomson Reuters CRB commodities index is seemingly breaking out of a 12-month retracement on the monthly chart. Furthermore, the retracement lasted 11 months before June’s small bullish candle, so the broad commodities index may have bottomed in May at -19.8% y/y. And assuming this is the breakout of a falling wedge, it projects a target around the 329.60 high. But if it were deemed a bull flag, the target sits around 365.
And what do we think will happen to consumer prices further down the track? Of course, they will begin to rise again. And the worrying fact is that inflation tends to come and go in waves, so if commodities continue to rally then it looks like the next wave of rising y/y inflation is pending.

Deciphering Divergent Signals The Complex Economic LandscapeThe global economy continues to face profound uncertainties in the wake of COVID-19's massive disruptions. For policymakers and business leaders, making sense of divergent signals on jobs, inflation, and growth remains imperative yet challenging.
In the United States, inflation pressures appear to be moderately easing after surging to 40-year highs in 2022. The annual Consumer Price Index (CPI) declined to 3% in June from the prior peak of 9.1%. Plunging gasoline and used car prices provided some consumer relief, while housing and food costs remained worryingly elevated. Core CPI, excluding food and energy, dipped to 4.8% but persists well above the Fed’s 2% target.
Supply chain improvements, waning pandemic demand spikes, and the strong dollar making imports cheaper all helped cool inflation. However, risks abound that high prices become entrenched with tight labor markets still buoying wages. Major central banks responded with substantial interest rate hikes to reduce demand, but the full economic drag likely remains unseen. Further supply shocks from geopolitics or weather could also reignite commodity inflation. While the direction seems promising, the Fed vows ongoing vigilance and further tightening until inflation durably falls to acceptable levels. The path back to price stability will be bumpy.
Yet even amidst surging inflation, the US labor market showed resilience through 2022. Employers added over 4 million jobs, driving unemployment down to 3.5%, matching pre-pandemic lows. This simultaneous inflation and job growth confounds historical norms where Fed tightening swiftly slows hiring.
Pandemic-era stimulus and savings initially cushioned households from rate hikes, sustaining consumer demand. Early retirements, long COVID disabilities, caregiving needs, and possibly a cultural rethinking of work also constricted labor supply. With fewer jobseekers available, businesses retained and attracted talent by lifting pay, leading to nominal wage growth even outpacing inflation for some months.
However, the labor market's anomalous buoyancy shows growing fragility. Job openings plunged over 20% since March, tech and housing layoffs multiplied, and wage growth decelerated – all signals of softening demand as higher rates bite. Most economists expect outright job losses in coming months as the Fed induces a deliberate recession to conquer inflation.
Outside the US, other economies show similar labor market resilience assisted by generous pandemic supports. But with emergency stimulus now depleted, Europe especially looks vulnerable. Energy and food inflation strain household budgets as rising rates threaten economies already flirting with recession. Surveys show consumer confidence nosediving across European markets. With less policy space, job losses may mount faster overseas if slowdowns worsen.
Meanwhile, Mexico’s economy and currency proved surprisingly robust. Peso strength reflects Mexico’s expanding manufacturing exports, especially autos, amid US attempts to nearshore production and diversify from China reliance. Remittances from Mexican immigrants also reached new highs, supporting domestic demand. However, complex immigration issues continue challenging US-Mexico ties.
The pandemic undoubtedly accelerated pre-existing workforce transformations. Millions older employees permanently retired. Younger cohorts increasingly spurn traditional career ladders, cobbling together gig work and passion projects. Remote technology facilitated this cultural shift toward customized careers and lifestyle priorities.
Many posit these preferences will now permanently reshape labor markets. Employers clinging to old norms of in-office inflexibility may struggle to hire and retain talent, especially younger workers. Tighter immigration restrictions also constrain domestic labor supply. At the same time, automation and artificial intelligence will transform productivity and skills demands.
In this context, labor shortages could linger regardless of economic cycles. If realized, productivity enhancements from technology could support growth with fewer workers. But displacement risks require better policies around skills retraining, portable benefits, and income supports. Individuals must continually gain new capabilities to stay relevant. The days of lifelong stable employer relationships appear gone.
For policymakers, balancing inflation control and labor health presents acute challenges. Achieving a soft landing that curtails price spikes without triggering mass unemployment hardly looks guaranteed. The Fed’s rapid tightening applies tremendous pressure to an economy still experiencing profound demographic, technological, and cultural realignments.
With less room for stimulus, other central banks face even more daunting dilemmas. Premature efforts to rein in inflation could induce deep recessions and lasting scars. But failure to act also risks runaway prices that erode living standards and stability. There are no easy solutions with both scenarios carrying grave consequences.
For business leaders, adjusting to emerging realities in workforce priorities and automation capabilities remains imperative. Companies that embrace flexible work options, prioritize pay equity, and intelligently integrate technologies will gain a competitive edge in accessing skills and talent. But transitions will inevitably be turbulent.
On the whole, the global economy's trajectory looks cloudy. While the inflation fever appears to be modestly breaking, risks of resurgence remain as long as labor markets show tightness. But just as rising prices moderate, the delayed impacts from massive rate hikes threaten to extinguish job growth and demand. For workers, maintaining adaptability and skills development is mandatory to navigate gathering storms. Any Coming downturn may well play out differently than past recessions due to demographic shifts, cultural evolution, and automation. But with debt levels still stretched thin across sectors, the turbulence could yet prove intense. The path forward promises to be volatile and uneven amidst the lingering pandemic aftershocks. Navigating uncertainty remains imperative but challenging.

Harmonically, US Interest Rates are Headed Toward 35%The US Interest Rate chart has been trading within a Descending Broadening Wedge and has recently broken out of the wedge. The target for a pattern like this is typically back to the inception of the pattern, which in this case would be 20%; but we also have an additional variable here, and that's the Potential Logscale Harmonic Formation we've made here. If we are to treat the action of this chart as we'd treat any other chart, then we'd expect that once B gets broken, we'd get an accelerated move all the way up to the Harmonic Completion of a Bearish Shark, which would land us at the 1.13/1.618 Harmonic Confluence Zone up at around 34-35%
There have been previous instances where Harmonics have had a predictive quality over data like this, such as the accelerated liquidity exit out of the reverse repo facility, the bond yield charts on multiple occasions, and the US Inflation Rate Charts. Which can all be seen in the related ideas tab if you are skeptical of my use of Harmonic Patterns in this context.

Golds Recent PushGold has been pushing upwards the past week, 1963 area seems to have formed a resistance of price. I have implemented kill zones into my strategy now. Also looking to sell from rejection of resistance, but, price could push through from CPI and Retail Sales news at 1:30pm GMT.
Caution on USD and CAD pairs at this time.

Can Gold Break 1979?Holding a buy from the resistance of 78-79. Im looking at EMA200 as 1Hr candles have closed above.
Again using kill zones in my strategy now. Waiting for more news at 3:30pm on USD pairs

More Downside for DXY?Last week's US Consumer Price Index (CPI) release of 3% (Forecast: 3.1% Previous: 4%) indicates that inflation growth has slowed significantly, likely due to the compounded effect of aggressive interest rate hikes from the Federal Reserve.
This slowdown in inflation growth has also improved market sentiment that the Fed Funds Rate has reached its peak at 5.25% and the likelihood for further rate hikes has diminished.
With the DXY breaking below the round number level of 100 and reaching a low, last seen in April 2022, further downside can be expected.
However, watch out for the possibility of stronger-than-expected US retail sales data. A sustained rebound is unlikely, with the 100.85 resistance level likely to cap the upside potential.
Confirmation of further downside could be signaled if the price breaks below 99.45, with the price likely to trade toward the next key support level at 97.75.

17/07/23 Weekly outlookLast weeks high: $ 31843.6
Last weeks low: $30858.7
Midpoint: $29873.8
Post CPI week and BTC finds itself back within the same local range despite some very positive news coming from the SEC VS Ripple case. Alts rallied upon the news but BTC was capped at 31.8K, still short of the 32.5k target.
I do believe that was bitcoins best chance to break above the range, the daily close on Friday 14th was a bearish engulfing and that is a worry for the bulls as all the progress from the SEC news got retraced and some...
This could be the start of bitcoin unwinding should we lose the range bottom around 29.5k, the target would be to fill the inefficiency FVG around 27k before another attempt at that local high.

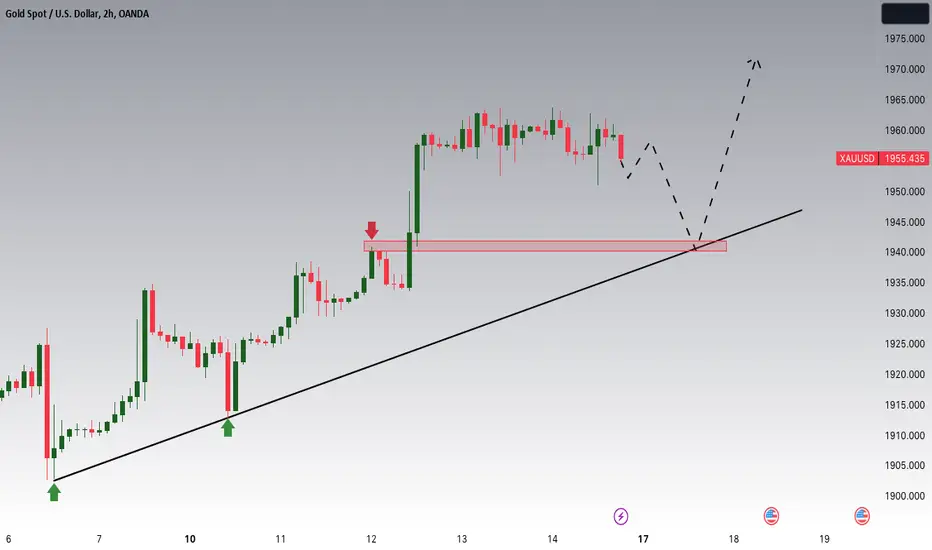
Gold Outlook: Vulnerable Dollar and Promising Upside PotentialHey Traders, In tomorrow's upcoming trading session, our keen focus will be on XAUUSD, the trading pair of gold against the US dollar. We are closely monitoring this market for a potential buying opportunity within the price range of approximately 1940. From a technical standpoint, XAUUSD is currently engaged in an upward trend and undergoing a consolidation phase, gradually approaching the key level of support and resistance at 1940.
Furthermore, it is important to consider the fundamental factors influencing this market. The latest Consumer Price Index (CPI) data indicated a softer performance, implying that future monetary policies are likely to adopt a more dovish stance. Additionally, the Producer Price Index (PPI) also displayed a similar softness. These factors combined have generated an increased appeal for gold and cryptocurrencies among investors.
Given this context, the convergence of favorable technical indicators and supportive fundamental factors enhances the attractiveness of gold and cryptocurrencies as investment options. Thus, we anticipate a heightened interest from investors in exploring opportunities within the XAUUSD market, particularly around the 1940 zone.
The end of the tightening cycle is nighThe decline in the US inflation rate to more than a two-year low, marks a major step towards the end of the Fed’s historic monetary tightening cycle1. We believe key deflationary forces are in play – (1) weaker commodity prices (2) improvement in global supply chains (3) moderation in demand (4) lower inflation expectations. Therefore, the June decline in inflation is just the start of a series of decreases.
Softer than expected inflation report
As highlighted in the chart below, the details for June were also better than expected with key measures of underlying inflation coming in below forecasts. The inflation report suggests that some of the stickier components of inflation such as used cars and airline fares are also moderating.
It’s important to note that most of the rise in the June CPI can be attributed to housing, however because of the way it is calculated it tends to lag current conditions. The S&P Case Shiller Home Price Index which tends to lead CPI shelter by roughly a year, is already flat which highlights US inflation is likely headed lower. Inflation for labour intensive services such as restaurants, recreation and personal care remained higher in June reflecting the pass -through of higher wages and robust services demand2. Potential further softening in the labour market could bring these categories back to target consistent levels. Softening in the labour market was evident in June’s employment report (nonfarm payrolls rose by 209k versus consensus 230k) which was weaker than expected for the first time in 15 months3.
US Producer Prices confirmed a similar deflationary theme. The US Producer Price Index (PPI) inflation for June was softer than expected with headline and core PPI advancing 0.1% over the prior month4. Business surveys are also pointing to weakening pricing power, such as the Institute of Supply Management (ISM) services index which ties in with a lower inflation backdrop.
US inflation can’t prevent the July rate hike
While expectations for the July rate hike of 25Bps remain firmly in place, the market has scaled back expectations for a second hike – with 21bps / 3bps / 3bps of hikes priced for the July / September / November FOMC meetings5. The disinflation trend increases our belief that the Fed is close to, or will be, at the end of the current rate hike cycle.
Earnings take centre stage for the next leg of the rally
The key question now remains whether the market continues to trade off expectations of an easing narrative. Central bank policy has been the biggest drag for equities last year. The timing of the easing narrative comes at the heels of a volatile Q2 2023 earnings season. The S&P 500 Index earnings in the Q2 2023 are expected to decline 6.8% y/y, worse than the decline of 3.9% in the Q1 20233. This would be the largest earnings decline since the pandemic-fuelled 31.6% y/y decline in the Q2 2020. Earnings will be the key deciding factor for an extension in the current rally.
Investors will be keen to hear from management whether they are looking to adopt a leaner cost structure and ways they are looking to remove excess capacity. Investors will be looking for guidance on productivity and efficiency gains rather than the financial engineering we have witnessed over the past decade.
This material is prepared by WisdomTree and its affiliates and is not intended to be relied upon as a forecast, research or investment advice, and is not a recommendation, offer or solicitation to buy or sell any securities or to adopt any investment strategy. The opinions expressed are as of the date of production and may change as subsequent conditions vary. The information and opinions contained in this material are derived from proprietary and non-proprietary sources. As such, no warranty of accuracy or reliability is given and no responsibility arising in any other way for errors and omissions (including responsibility to any person by reason of negligence) is accepted by WisdomTree, nor any affiliate, nor any of their officers, employees or agents. Reliance upon information in this material is at the sole discretion of the reader. Past performance is not a reliable indicator of future performance.

✏️ GOLD : Bull or Bear ? (PPI's effect)Well, as you can see, after yesterday's latest update and the 60 pip price correction, gold faced buying pressure again and managed to grow up to $1963! Now, in half an hour we will have the PPI statistics and unemployment claims in America, which will have a great impact on the price and the market and can bring the price to extreme fluctuations. I don't have many special offers for you today, and it is better to watch the price movements than trading on it . But in general, there are 2 important possibilities, one is that the price from this area will attack the large liquidity pool in the area above $1973, and the other is that if the actual PPI rate is will be announced higher than predicted rate, It may cause rejection of gold from this area!
Don't Forghet To Push The Boost (Like) Button and Follow Me for more !
Best Regards , Arman Shaban

✏️ GOLD : Bull or Bear ?? (CPI's effect)By checking the gold chart in the 2-hour time frame, we see that after what we expected, the price experienced a heavy fall and was able to correct up to $1912! After that, since yesterday, the price has faced buying pressure and is hitting new and higher highs ! Today, we will have the CPI statistics in a few minutes, and according to the price range, there is a possibility of correction, but before that, the price will probably move upwards towards $1944 and $1947, and after that, with seeing the right trigger We can look for a SELL position! The important supply ranges are $1944 and $1947 to $1957 respectively!
Don't Forghet To Push The Boost (Like) Button and Follow Me for more !
Best Regards , Arman Shaban

CPI (June)CPI YoY:
Forecast: 3.1%
Previous: 4.0%
Actual: ?
With CPI on the very near horizon, here are my thoughts on what Bitcoin could do in terms of price action:
Bullish scenario - We all know that CPI tends to be a volatile event with aggressive whipsaws in price in both directions irrespective of the outcome. Therefore there is an opportunity to capitalise on the frantic LTF price action.
For the bulls A good place to enter is the local range low if we see a reclaim after a demand zone sweep. I think this is fairly likely and ideally we see price move to the downside first upon the data release as in general, THE FIRST MOVE IS THE WRONG MOVE... following this initial move to the downside a reclaim would be primed for local highs in my opinion. If there is no reclaim then unfortunately there really isn't much support on the way down as BTC would seek to fill the FVG at 27K. A reaction off this level will leave BTC in a good place to attack 32.5k, reinforced with the ETF narrative and decision coming not too far down the line.
Bearish scenario - As was suggested previously, the first move is wrong, therefore the second move is the true move and for the bears it's the opposite to the bulls. If we see price move to the upside upon data release, I would like to see a SFP of the local range highs before entering short with the range midpoint as first target, then range low, then FVG as final target. If that LTF range high holds after being broken, I would like to see a strong wick up into 32.5K resistance and a reaction off this level to the downside and supply liquidity has been taken. Any slow grind up into this level would have me concerned as to BTC printing a swing fail and not just blasting through after consolidating. If that does play out then I would re-evaluate and stay in cash while doing so.
Reminder: First move is the wrong move.
CPI is usually very volatile and therefor risky. It's easy to FOMO into random positions as a gamble, the market usually wins in those positions.

Rise in EURUSDThe EURUSD rally continues and we are now above 1.1200.
The next resistance level is at 1.1274.
All active buys should have stops moved and a close option considered.
There is no basis for new entries at these levels!
At the end of the week, there may be some profit taking which will lead to a correction.

10/07/23 Weekly outlookLast weeks high: $ 31542.8
Last weeks low: $30610.1
Midpoint: $29677.4
Previous weeks price action tells an interesting tale. Beginning the week precisely on the midpoint of the week and ending on the 0.25 line.
The choppiness from last week follows a similar pattern to weeks previous, the target for the bulls of 32.5k and above is still in sight. Last weeks new local high of 31.5k took out the previous local high but has now printed a swing fail pattern (SFP).
With CPI on Wednesday this could be a high volatility event to get to that 32.5k wick and take liquidity in the supply zone. Just an idea.
As of now there is quite a large FVG at around 27k and this should be the bears target. I think this has an equal chance of happening as the 32.5k, however, losing 29.1k and acceptance below that level will increase the possibility of that happening and the added confluence would prompt me to look to go long around that 27k level. We will see once we get there.
Good luck to everyone this week!

Gold Potential Upsides after a soft CPI.Hey Traders, In today's trading session, our attention is focused on monitoring XAUUSD for a potential buying opportunity around the 1937 zone. Gold has been trading in a downtrend but has recently managed to break out of this trend. As a result, we are currently awaiting a correction in order to assess the potential for a retracement of the trend towards higher levels.
From a fundamental perspective, the release of soft CPI data yesterday suggests that the Federal Reserve is making progress in its battle against inflation. This outcome implies that there may be fewer restrictions in upcoming monetary policies, potentially leading to a weaker US dollar. In such a scenario, gold becomes more appealing to investors as it is often considered a safe-haven asset during times of currency weakness.
Therefore, considering the potential for a weaker dollar and the technical breakout in gold, we believe that XAUUSD presents an interesting opportunity to consider buying around the 1937 zone.
Trade safe, Joe.

EURUSD:Did the fed win the battle against inflation?Hey Traders, In today's trading session, our focus is on monitoring EURUSD for a potential buying opportunity around the 1.1100 zone. From a technical standpoint, EURUSD has successfully breached a significant resistance level at 1.1100. As a result, we are now observing the possibility of a retracement of this breakout, which could potentially lead to further upward movement and new highs.
From a fundamental perspective, the recent release of soft CPI data has important implications. The softer CPI data suggests that inflationary pressures may be easing, which, in turn, could prompt the monetary policy to become less restrictive. When monetary policy becomes less restrictive, it typically leads to a weaker USD. Therefore, based on this fundamental analysis, there is a potential for USD weakness, further supporting the case for a potential buying opportunity in EURUSD around the 1.1100 zone.
Trade safe, Joe.

EURUSD after CPIYesterday the big news passed and EURUSD went up over 100 pips.
Thus, it broke the resistance and confirmed the upward movement.
All active buys can be with stops moved below 1.1000.
The next resistances are at 1.1178 and 1.1274.
The levels around 1.1080 will now act as a support and we will look for buys on a pullback.
Today, we are more likely to see a continuation of the move towards 1.1178 before the correction starts.

NQ1! Supply and Demand Levels 7/12Link to chart: www.tradingview.com
Insane move after CPI! We are hitting a strong Daily supply zone. I am looking forward to a break through it as we continue to the 1HR R2 Pivot Target at 15562. For bears, maybe in the next week or 2 we can have a full retracement of the CPI move down to 15310.
Zooming out on the 4HR chart, we had the break out the downtrend, a retracement of the breakout, and now the continuation to break the highs of the downtrend and now moving into new territory since 2022 (Covid Era).

Short USD/CAD with big announcements due With US CPI due to land in the next 6-8 hours, I'm speculating that it will come in low and the USD will weaken off the back of it.
Combining this with the Bank of Canada also announcing their next interest rate decision an hour and a half after US CPI, if they do hike rates I can see strength in the $CAD.
Good pairs trade here for short USD/long CAD.
Will confirm if correct in 8 hours...

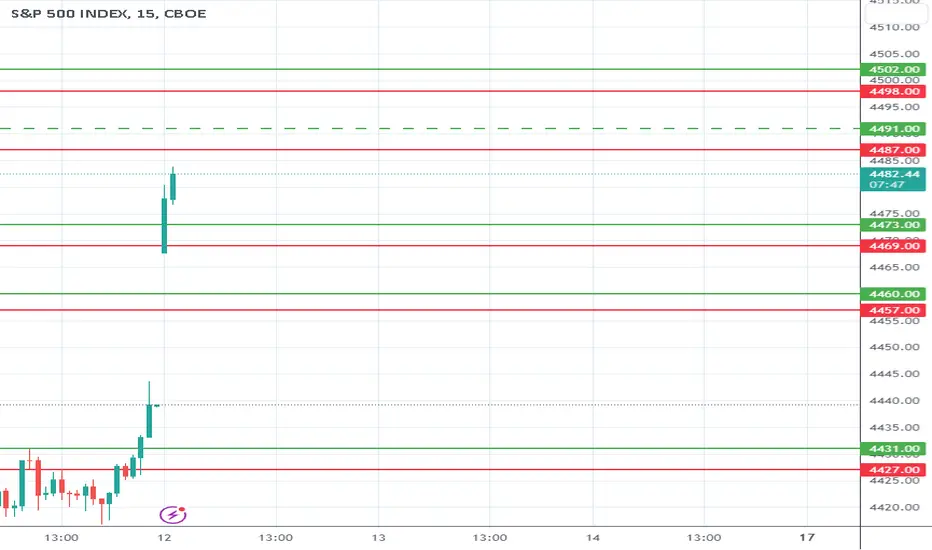
Inflation Tame. Next Question - Earnings Soft?S&P 500 INDEX MODEL TRADING PLANS for WED. 07/12
Markets are happy with the soft inflation numbers. The next question on the minds of investors - is it going to impact earnings numbers? If early earnings show any unexpected weakness ("unexpected" is the key word there), then we might have seen an interim top; but, if the earnings appear to be on track or with a bias to the upside surprises then the next bull leg could get well entrenched. We will begin to get a sense of it starting Friday and then into early next week.
The previously stated level of 4400-4410 continues to be in play as critical support. 4500-4505 is the next area of resistance.
Positional Trading Models: Our positional models indicate staying out of the markets until otherwise stated.
By definition, positional trading models may carry the positions overnight and over multiple days, and hence assume trading an index-tracking instrument that trades beyond the regular session, with the trailing stops - if any - being active in the overnight session.
Aggressive/Intraday Models: Our aggressive, intraday models indicate the trading plans below for today.
Aggressive, Intraday Trading Plans:
For today, our aggressive intraday models indicate going long on a break above 4502, 4473, 4460, or 4431 with a 9-point trailing stop, and going short on a break below 4498, 4487, 4469, 4457, or 4427 with a 9-point trailing stop.
Models indicate no explicit long exits, and short exits on a break above 4491. Models also indicate a break-even hard stop once a trade gets into a 4-point profit level. Models indicate taking these signals from 10:01am EST or later.
By definition the intraday models do not hold any positions overnight - the models exit any open position at the close of the last bar (3:59pm bar or 4:00pm bar, depending on your platform's bar timing convention).
To avoid getting whipsawed, use at least a 5-minute closing or a higher time frame (a 1-minute if you know what you are doing) - depending on your risk tolerance and trading style - to determine the signals.
(WHAT IS THE CREDIBILITY and the PERFORMANCE OF OUR MODEL TRADING PLANS over the LAST WEEK, LAST MONTH, LAST YEAR? Please check for yourself how our pre-published model trades have performed so far! Seeing is believing!)
NOTES - HOW TO INTERPRET/USE THESE TRADING PLANS:
(i) The trading levels identified are derived from our A.I. Powered Quant Models. Depending on the market conditions, these may or may not correspond to any specific indicator(s).
(ii) These trading plans may be used to trade in any instrument that tracks the S&P 500 Index (e.g., ETFs such as SPY, derivatives such as futures and options on futures, and SPX options), triggered by the price levels in the Index. The results of these indicated trades would vary widely depending on the timeframe you use (tick chart, 1 minute, or 5 minute, or 15 minute or 60 minute etc.), the quality of your broker's execution, any slippages, your trading commissions and many other factors.
(iii) These are NOT trading recommendations for any individual(s) and may or may not be suitable to your own financial objectives and risk tolerance - USE these ONLY as educational tools to inform and educate your own trading decisions, at your own risk.
#spx, #spx500, #spy, #sp500, #esmini, #indextrading, #daytrading, #models, #tradingplans, #outlook, #economy, #bear, #yields, #stocks, #futures, #inflation, #recession, #earnings